Angular applications often grow in complexity, making it challenging to monitor performance and troubleshoot issues effectively. Enter OpenTelemetry: a powerful, vendor-neutral framework for telemetry collection. This guide will walk you through implementing OpenTelemetry in your Angular projects, enhancing your ability to observe and optimize your applications.
What is OpenTelemetry and Why Use it in Angular?
OpenTelemetry is an open-source vendor-agnostic set of tools, APIs, and SDKs used to instrument applications to create and manage telemetry data(logs, metrics, and traces). It aims to make telemetry data(logs, metrics, and traces) a built-in feature of cloud-native software applications.
The telemetry data is then sent to an observability tool for storage and visualization.
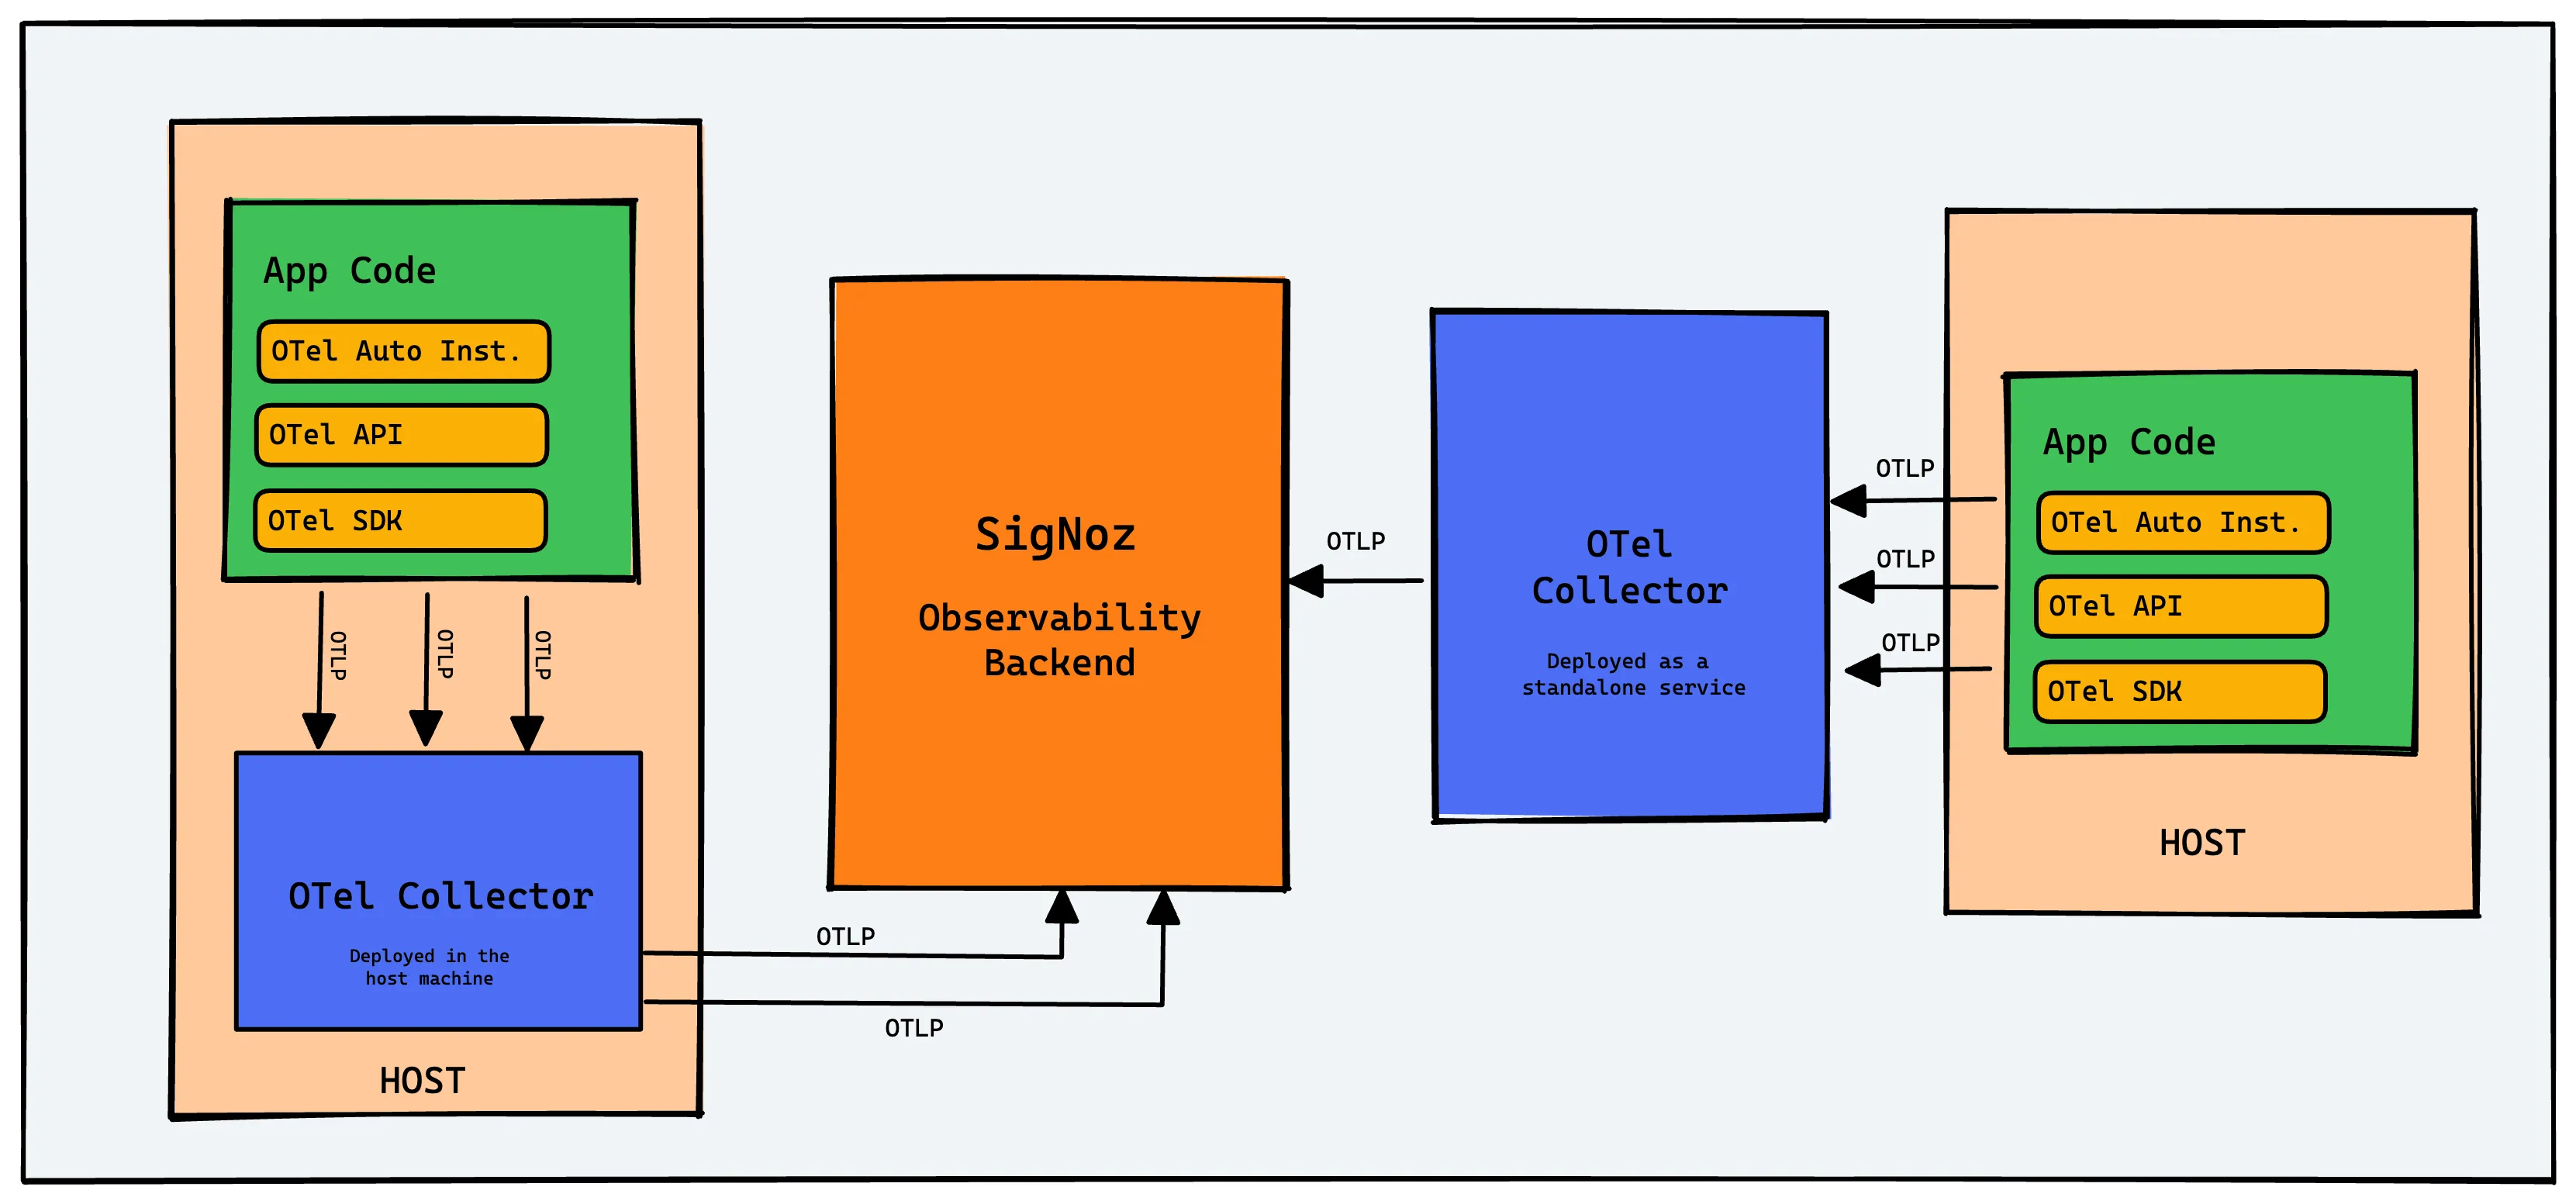
OpenTelemetry is the bedrock for setting up an observability framework. It also provides you the freedom to choose a backend analysis tool of your choice.
Why should you consider using OpenTelemetry in your Angular applications?
- Comprehensive insights: OpenTelemetry offers a holistic view of your application's performance, covering both frontend and backend operations.
- Standardization: It provides a unified approach to instrumentation across different languages and frameworks.
- Flexibility: OpenTelemetry is vendor-neutral, allowing you to switch between different monitoring backends without changing your instrumentation code.
- Future-proofing: As an industry-standard solution, OpenTelemetry ensures your observability strategy remains relevant and adaptable.
Compared to traditional monitoring solutions, OpenTelemetry offers greater flexibility and depth of insights. It allows you to trace requests across your entire stack, providing a more comprehensive understanding of your application's behavior.
OpenTelemetry and SigNoz
In this article, we will use SigNoz as our backend analysis tool. SigNoz is a full-stack open-source APM tool that can be used for storing and visualizing the telemetry data collected with OpenTelemetry. It is built natively on OpenTelemetry and supports OTLP data formats.
SigNoz provides query and visualization capabilities for the end-user and comes with out-of-box charts for application metrics, traces and logs. With metrics, traces, and logs under a single pane of glass, SigNoz can be a one-stop open source observability platform.
Now let’s get down to how to implement OpenTelemetry Angular libraries and then visualize the collected data in SigNoz.
Running Angular application with OpenTelemetry
Step 1: Create a SigNoz Cloud Account
SigNoz cloud is the easiest way to run SigNoz. You can sign up here for a free account and get 30 days of unlimited access to all features.

After you sign up and verify your email, you will be provided with details of your SigNoz cloud instance. Once you set up your password and log in, you will be greeted with the following onboarding screen.
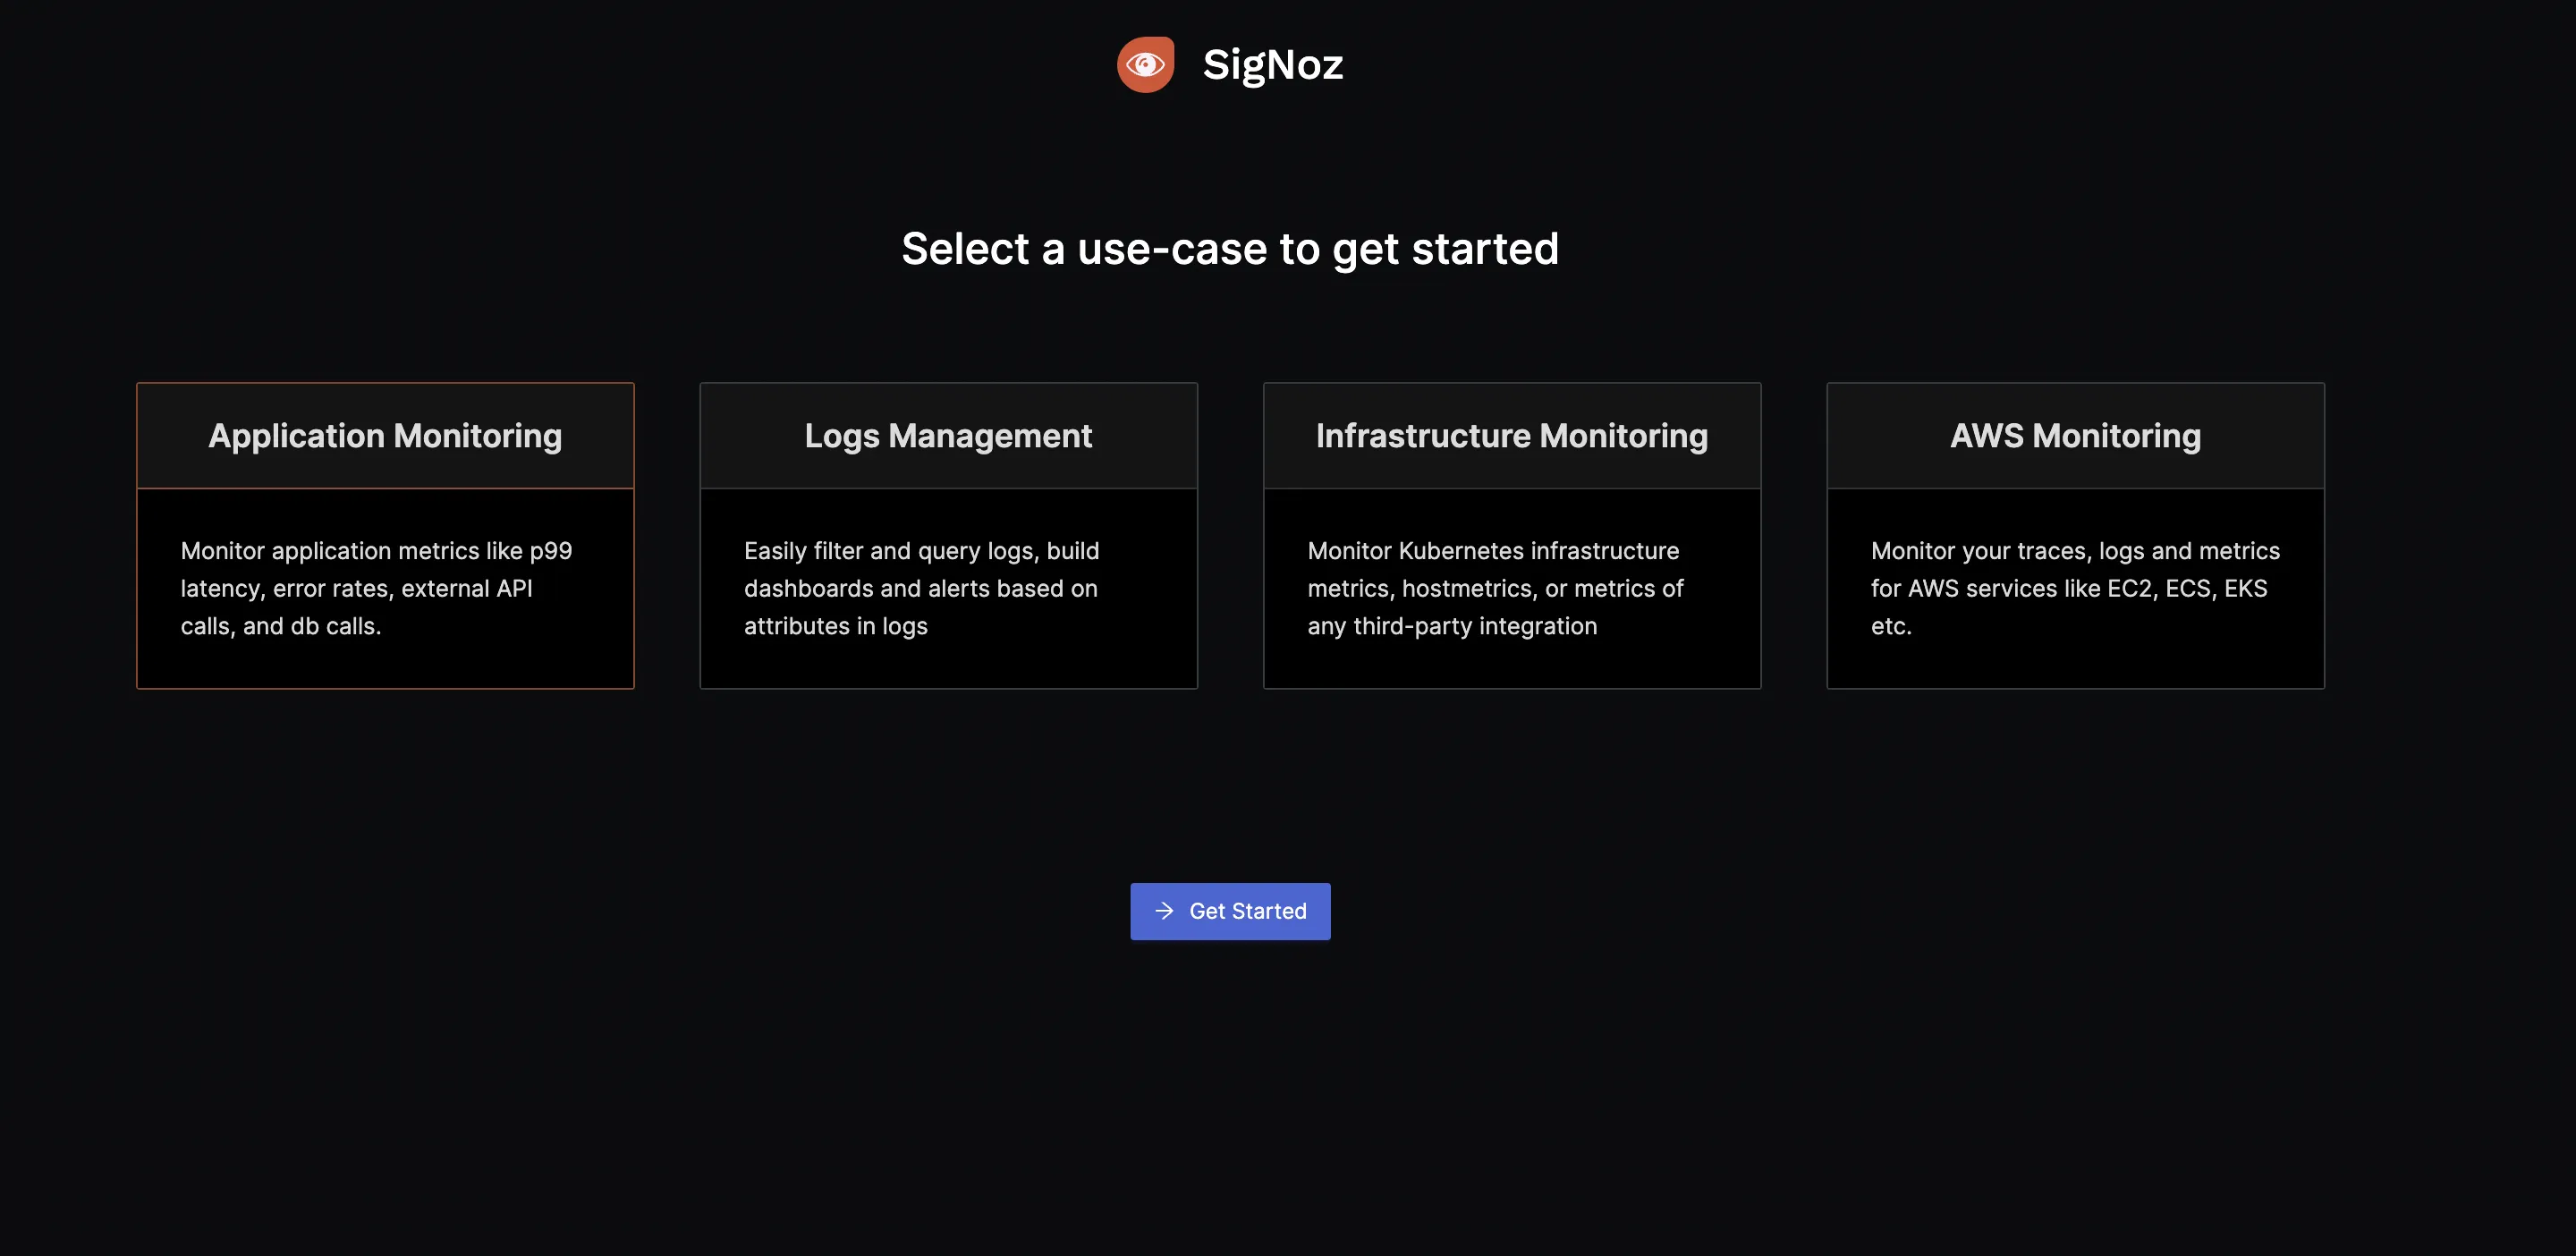
Since we will be following instructions from the tutorial, you can skip onboarding by clicking on the SigNoz logo.
You will see the below screen:
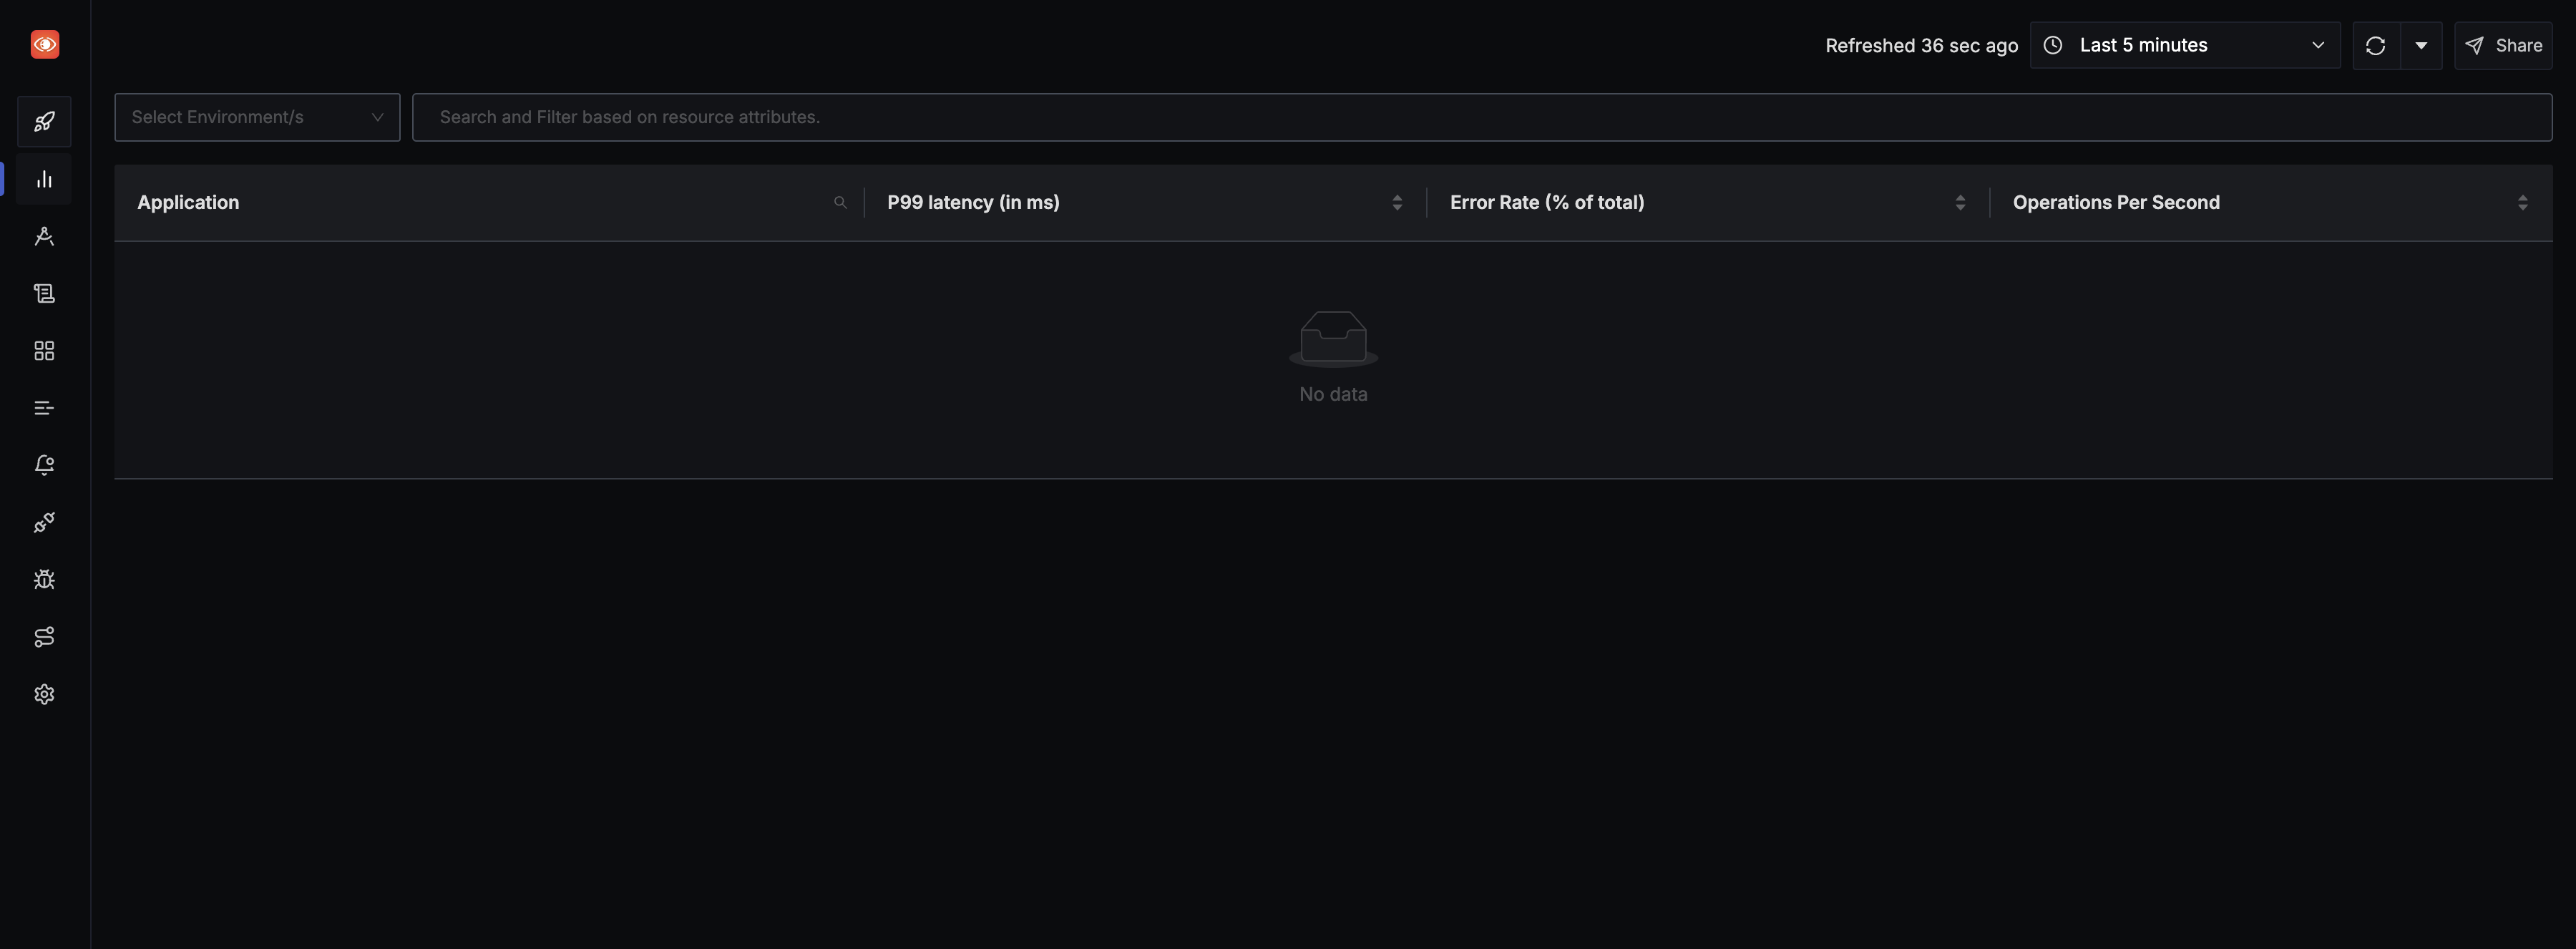
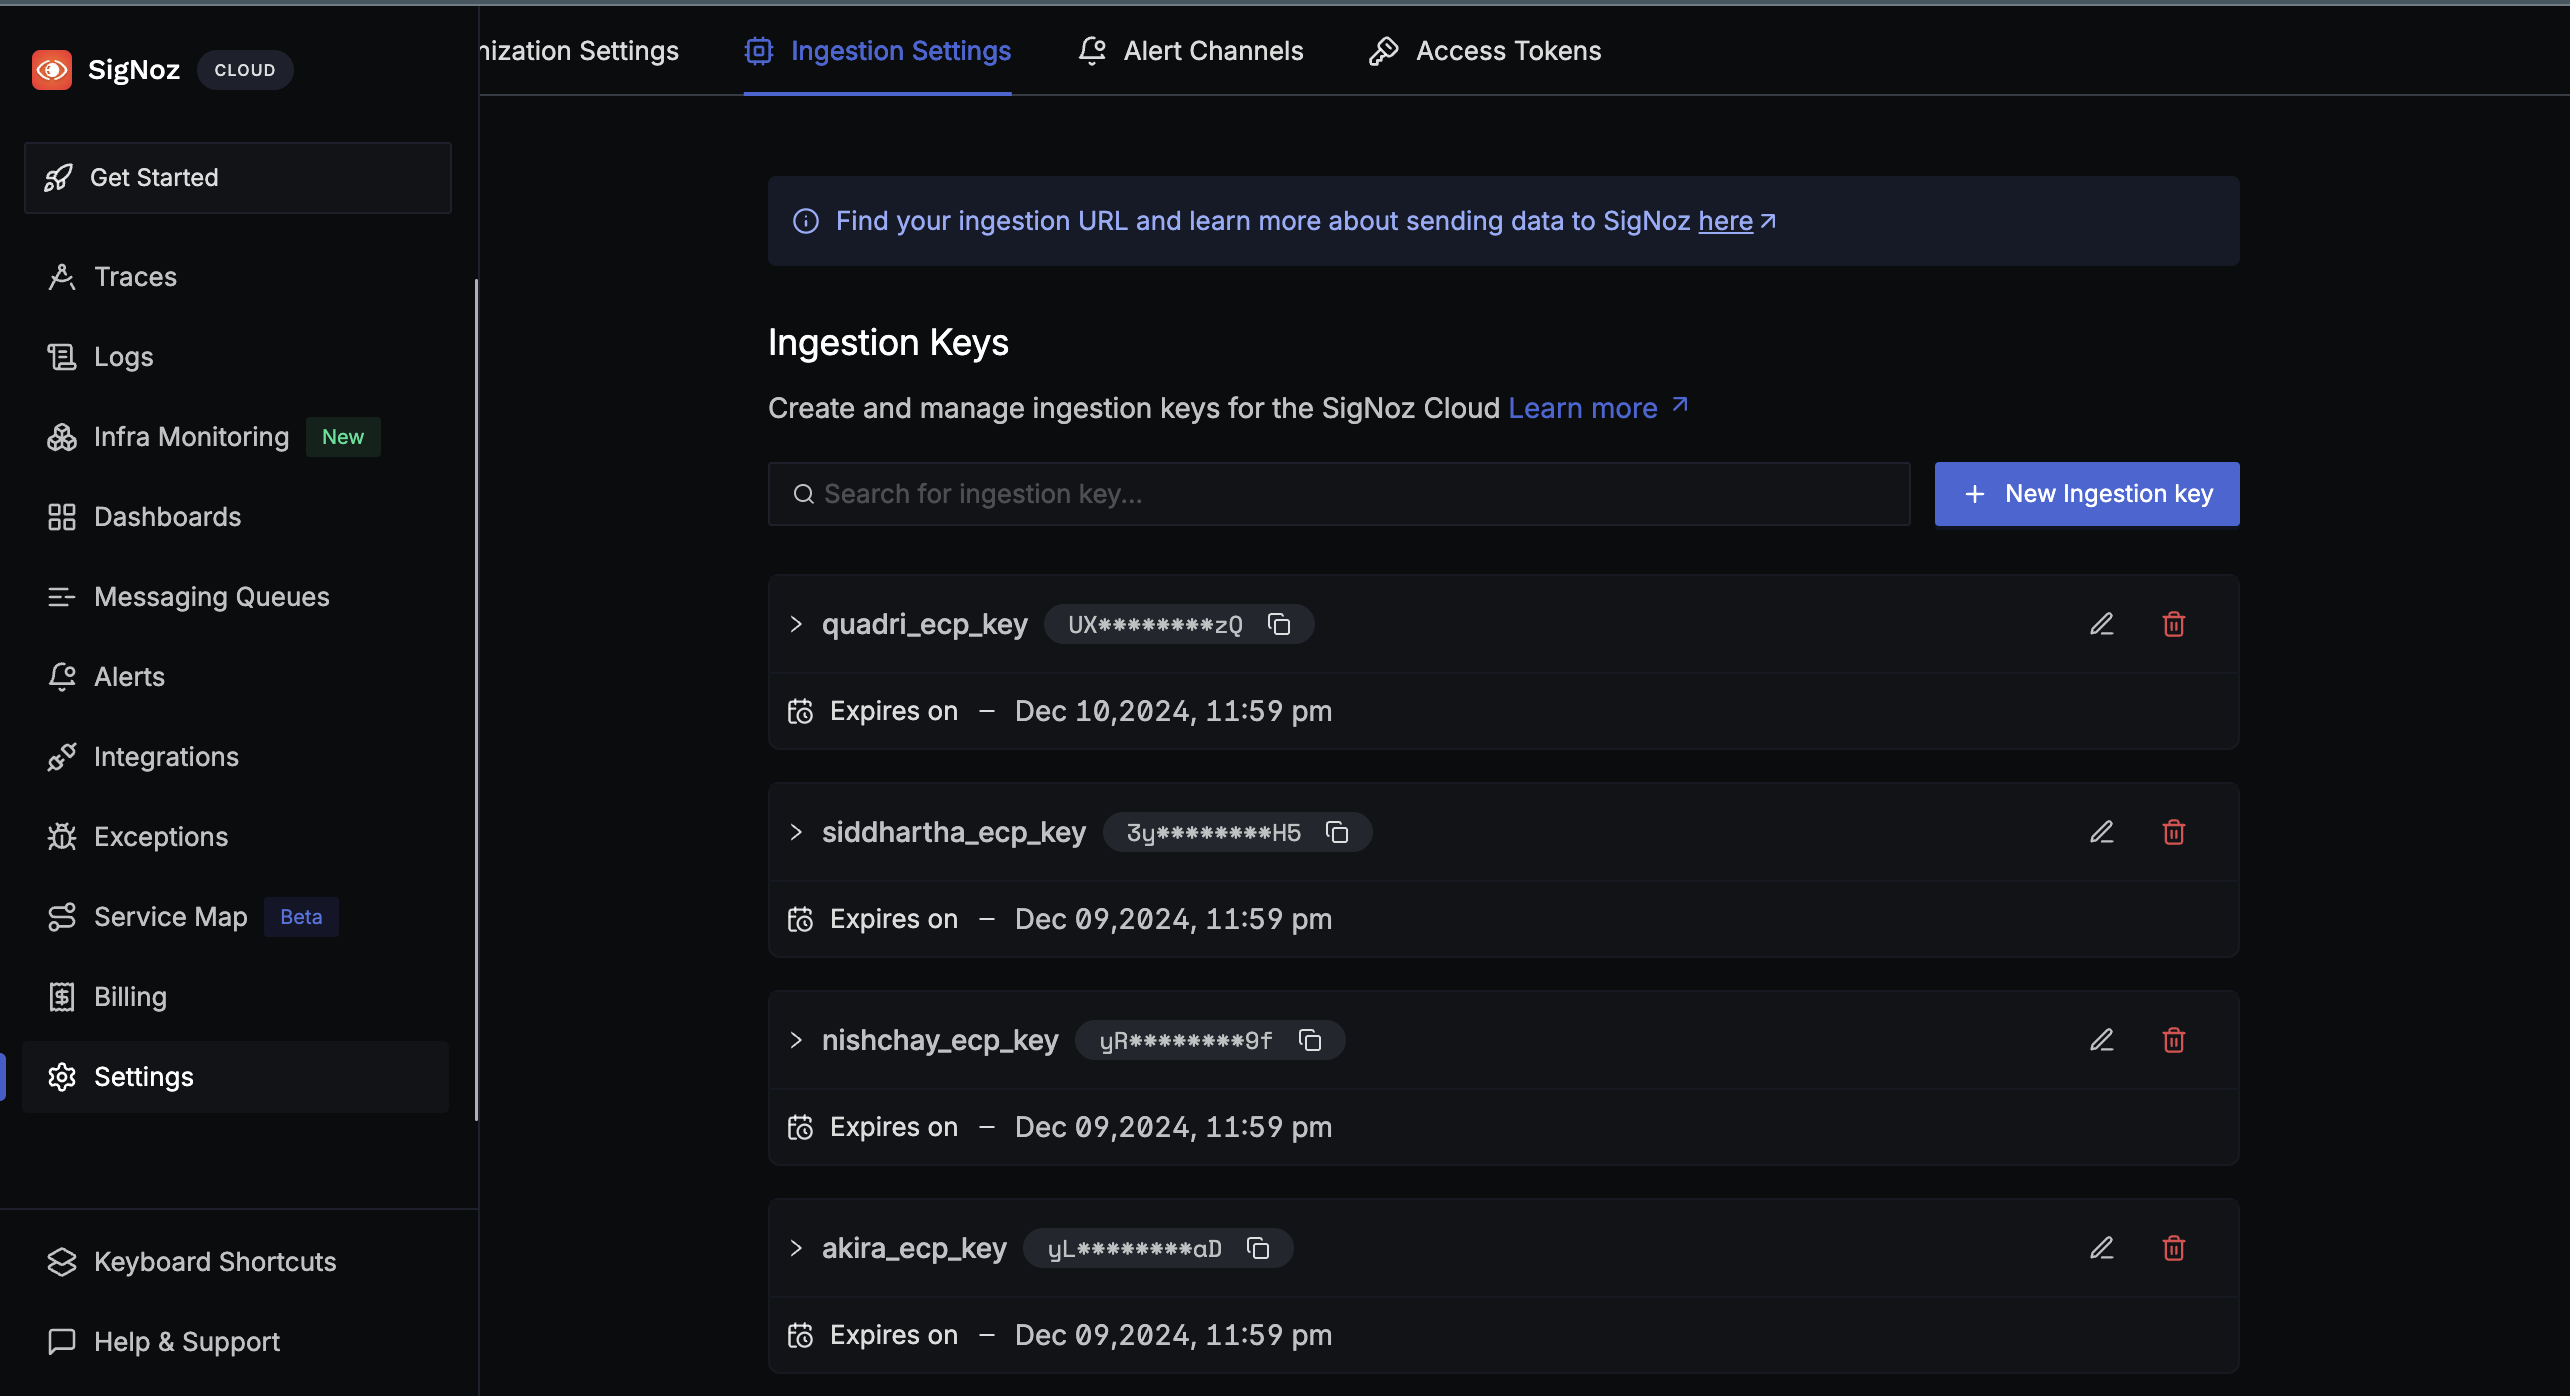
For sending data to SigNoz cloud, you will be needing details like ingestion key and region. You can find them under Ingestion Settings under Settings.
Step 2: Get sample Angular app
If you already have a sample Angular application, you can follow the steps below to instrument it for observability. Alternatively, you can use this sample Angular app provided. This app includes boilerplate code with instrumentation already set up.
While the app is pre-configured for instrumentation, you can follow along with the steps in this guide to replicate the instrumentation process in your own Angular applications.
Step 3: Install OpenTelemetry packages
Install the necessary OpenTelemetry packages by running the following commands:
npm install --save @opentelemetry/sdk-trace-web@^1.21.0
npm install --save @opentelemetry/instrumentation@^0.48.0
npm install --save @opentelemetry/auto-instrumentations-web@^0.36.0
npm install --save @opentelemetry/exporter-trace-otlp-http@^0.48.0
npm install --save @opentelemetry/resources@^1.21.0
npm install --save @opentelemetry/propagator-b3@^1.21.0
npm install --save @opentelemetry/semantic-conventions@^1.21.0
💡 If you face issues in dependency installation, please use `npm install --force`.
Step 4. Create an instrument.ts File
In the src/app directory of your project folder, create a file named instrument.ts and add the following code to configure SigNoz cloud ingestion:
import opentelemetry from '@opentelemetry/api';
import { registerInstrumentations } from '@opentelemetry/instrumentation';
import {
  WebTracerProvider,
  ConsoleSpanExporter,
  SimpleSpanProcessor,
  BatchSpanProcessor,
} from '@opentelemetry/sdk-trace-web';
import { getWebAutoInstrumentations } from '@opentelemetry/auto-instrumentations-web';
import { OTLPTraceExporter } from '@opentelemetry/exporter-trace-otlp-http';
import { Resource } from '@opentelemetry/resources';
import { B3Propagator } from '@opentelemetry/propagator-b3';
import { SemanticResourceAttributes } from '@opentelemetry/semantic-conventions';
import { OTLPMetricExporter } from '@opentelemetry/exporter-metrics-otlp-http';
import {
  MeterProvider,
  PeriodicExportingMetricReader,
} from '@opentelemetry/sdk-metrics';

const resource = Resource.default().merge(
  new Resource({
    [SemanticResourceAttributes.SERVICE_NAME]: 'signoz-angular-native',
    [SemanticResourceAttributes.SERVICE_VERSION]: '0.1.0',
  })
);

const provider = new WebTracerProvider({ resource });

provider.addSpanProcessor(new SimpleSpanProcessor(new ConsoleSpanExporter()));

provider.addSpanProcessor(
  new BatchSpanProcessor(
    new OTLPTraceExporter({
      url: 'https://ingest.<REGION>.signoz.cloud:443/v1/traces',
      headers: {
        'signoz-ingestion-key': '<SIGNOZ_INGESTION_KEY>',
      },
    })
  )
);

provider.register({
  propagator: new B3Propagator(),
});

registerInstrumentations({
  instrumentations: [
    getWebAutoInstrumentations({
      '@opentelemetry/instrumentation-document-load': {},
      '@opentelemetry/instrumentation-user-interaction': {},
      '@opentelemetry/instrumentation-fetch': {
        propagateTraceHeaderCorsUrls: /.+/,
      },
      '@opentelemetry/instrumentation-xml-http-request': {
        propagateTraceHeaderCorsUrls: /.+/,
      },
    }),
  ],
});

const metricReader = new PeriodicExportingMetricReader({
  exporter: new OTLPMetricExporter({
    url: 'https://ingest.<REGION>.signoz.cloud:443/v1/metrics',
    headers: {
      'signoz-ingestion-key': '<SIGNOZ_INGESTION_KEY>',
    },
  }),
  // Default is 60000ms (60 seconds). Set to 10 seconds for demonstrative purposes only.
  exportIntervalMillis: 6000,
});

const myServiceMeterProvider = new MeterProvider({
  resource,
  readers: [metricReader],
});

// Set this MeterProvider to be global to the app being instrumented.
opentelemetry.metrics.setGlobalMeterProvider(myServiceMeterProvider);
Replace:
{REGION}with your SigNoz cloud region.{SIGNOZ_INGESTION_KEY}with the key found in your SigNoz account settings. You can read more about it here.
Depending on the choice of your region for SigNoz cloud, the ingest endpoint will vary according to this table:
| Region | Endpoint |
|---|---|
| US | ingest.us.signoz.cloud:443/v1/traces |
| IN | ingest.in.signoz.cloud:443/v1/traces |
| EU | ingest.eu.signoz.cloud:443/v1/traces |
Step 5. Import instrument.ts in main.ts
Add the following line to the imports section of your main.ts file, located in src/main.ts:
import './app/instrument';
This imports the instrument.ts file you created earlier at src/app/instrument.ts and ensures that your OpenTelemetry configuration is initialized when the application starts.
After adding this line, your main.ts file should look like this:
import { bootstrapApplication } from '@angular/platform-browser';
import { appConfig } from './app/app.config';
import { AppComponent } from './app/app.component';
import './app/instrument';

bootstrapApplication(AppComponent, appConfig)
  .catch((err) => console.error(err));
Step 6. Run the Application
Start the Angular app:
ng serve
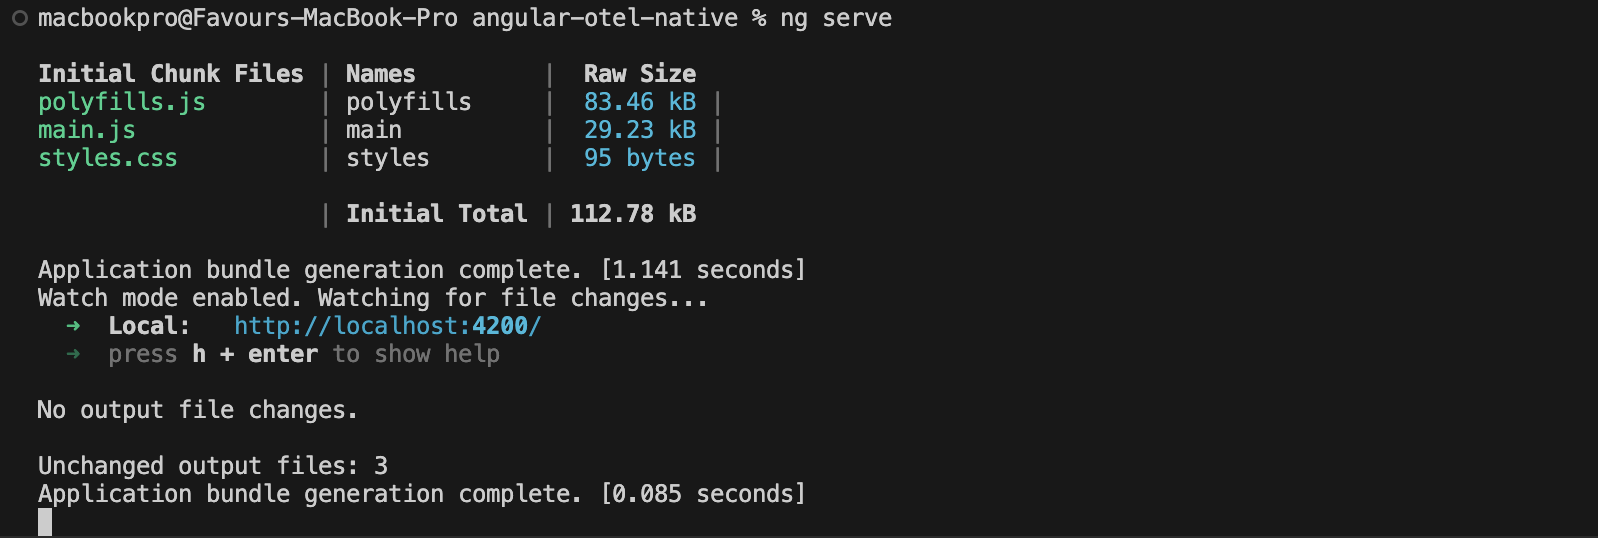
You should be able to access the application at http://localhost:4200:

Step 7: Generate Trace Data
Applications will not produce traces unless they are being interacted with, and OpenTelemetry will often buffer data before sending. So you need to interact with your application and wait for some time to see your tracing data in SigNoz. For example, perform actions like triggering web requests, navigating through the app, or refreshing the page multiple times. Wait a few moments to allow traces to propagate and appear in SigNoz.
Step 8: View Your Application in SigNoz
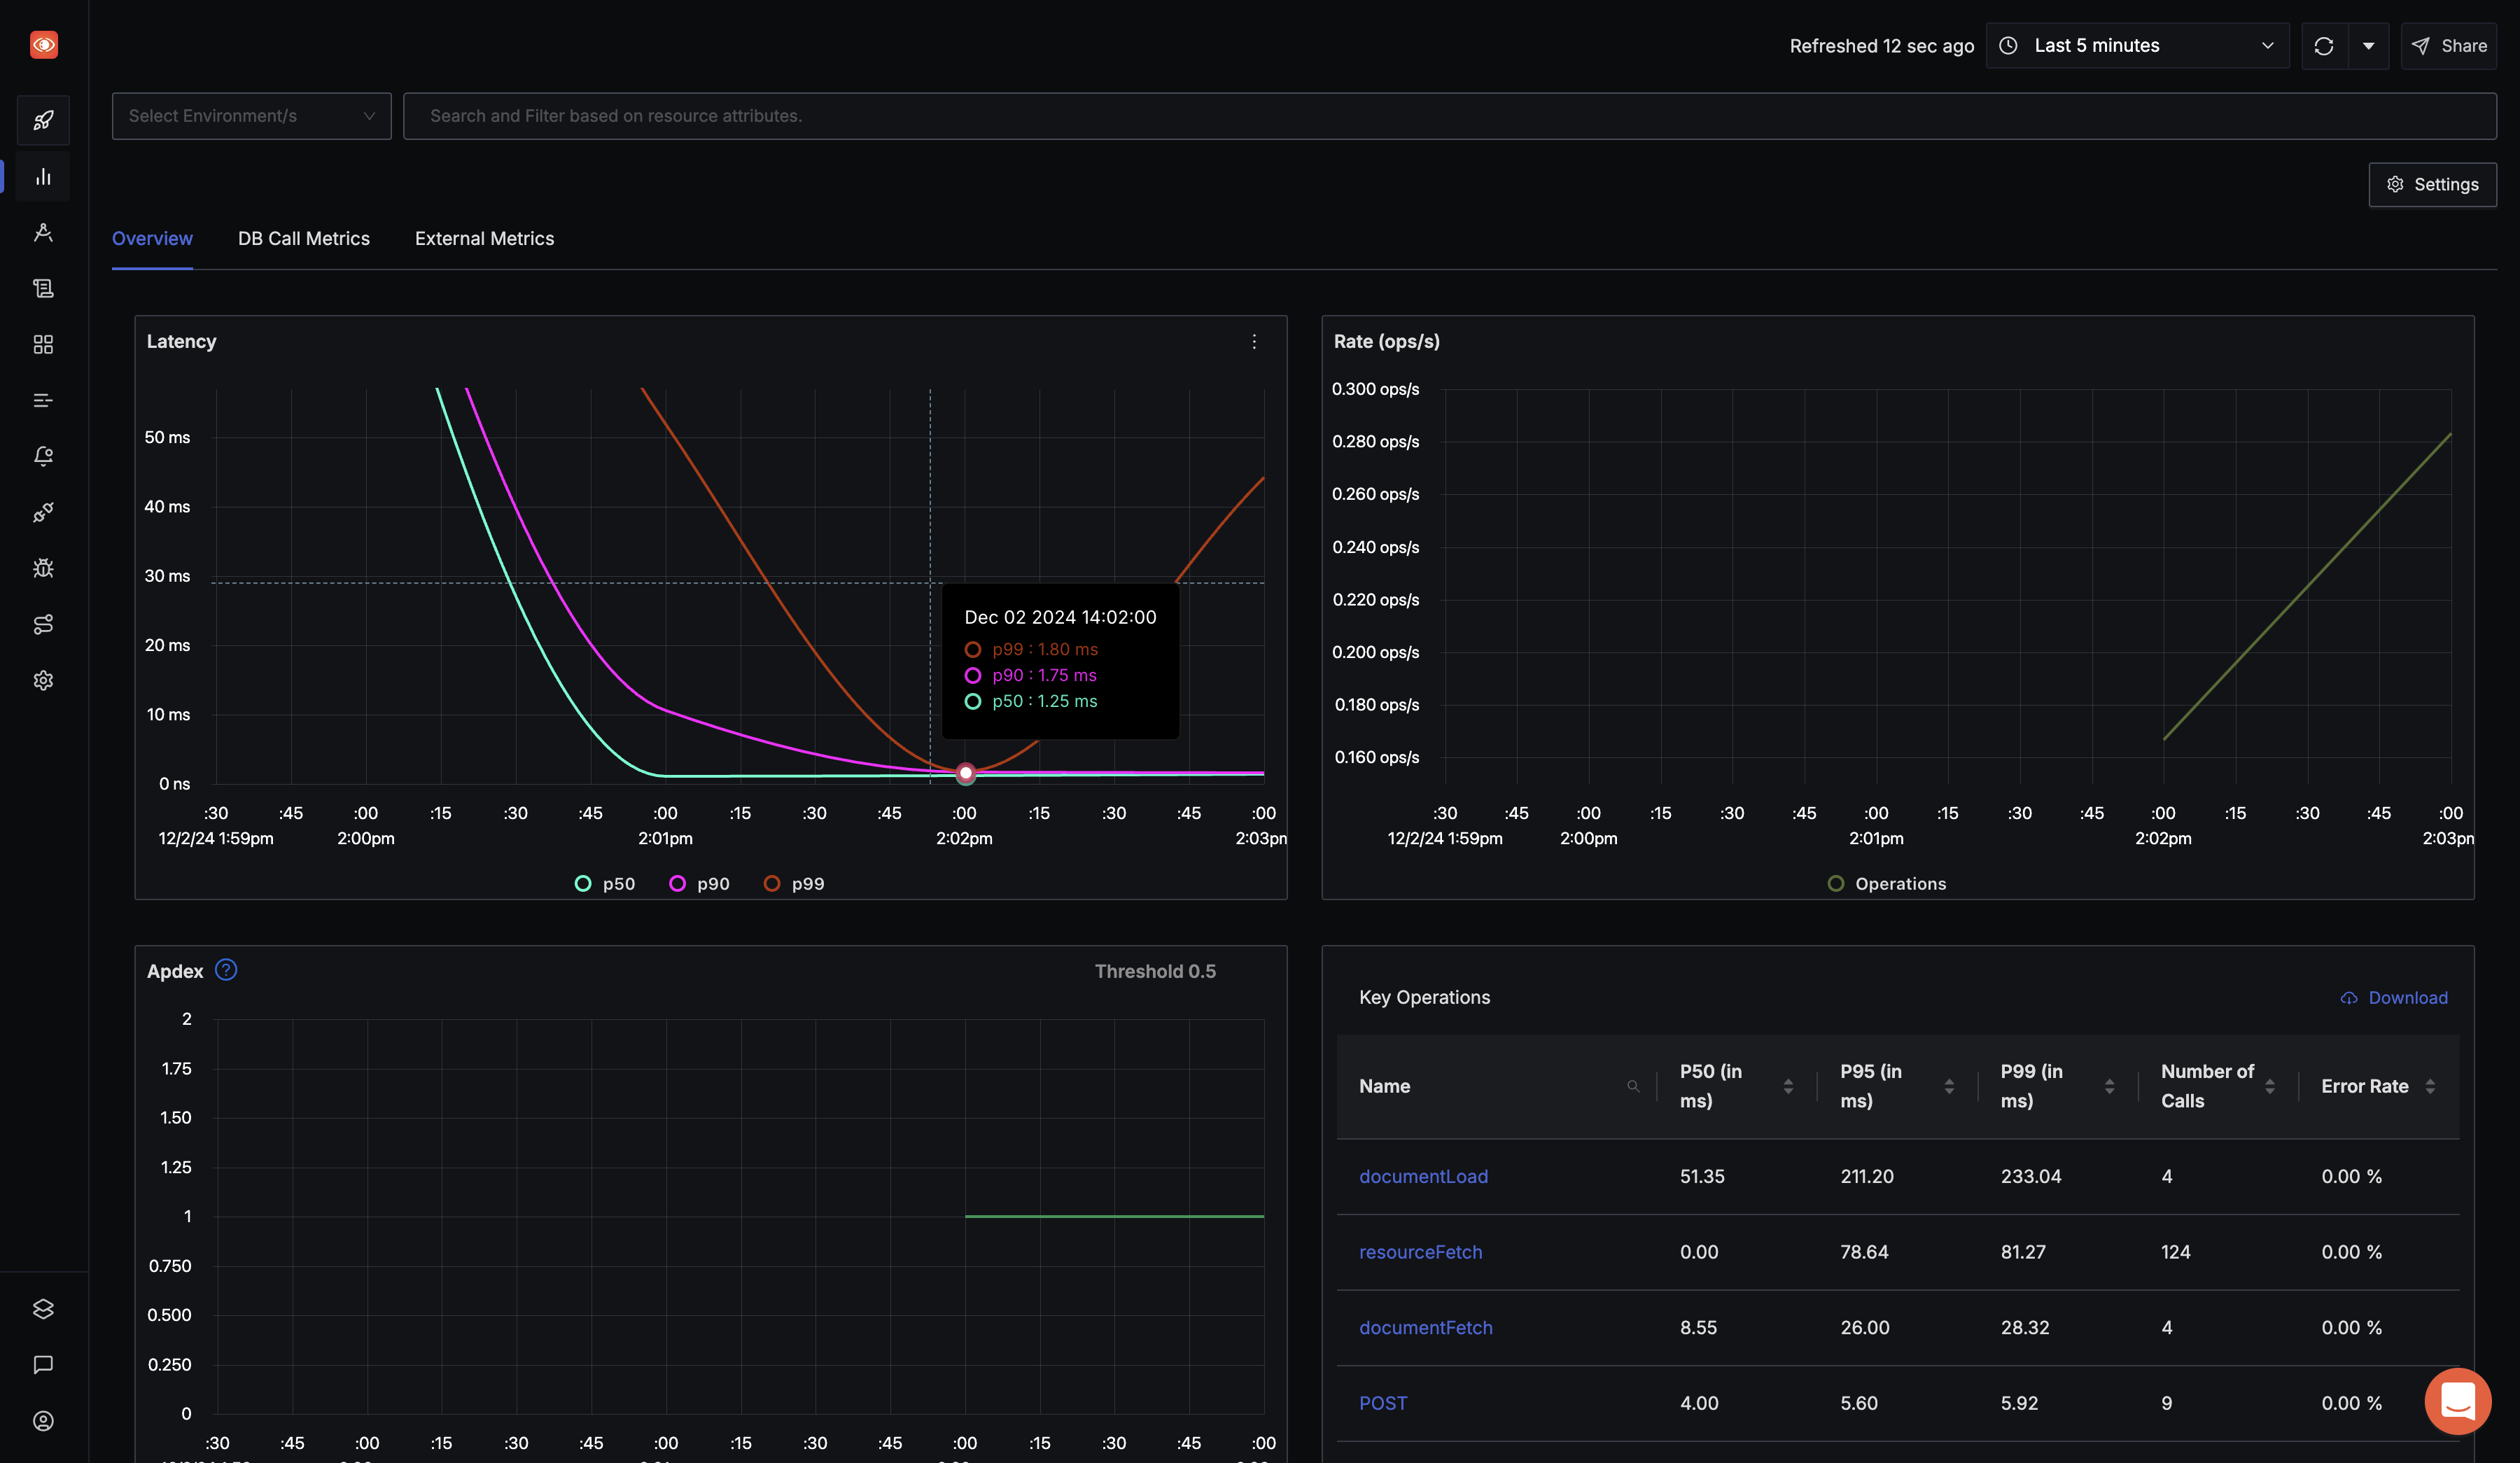
Log in to your SigNoz Cloud account. Navigate to the Services tab and click the refresh button in the top-right corner. After refreshing, your application should appear in the list of services.
The displayed application service name will correspond to the name defined in your instrument.ts file.

Select your application from the list to access its metrics overview. Here, you can monitor essential details like latency, request rates, Apdex scores, and key operations.
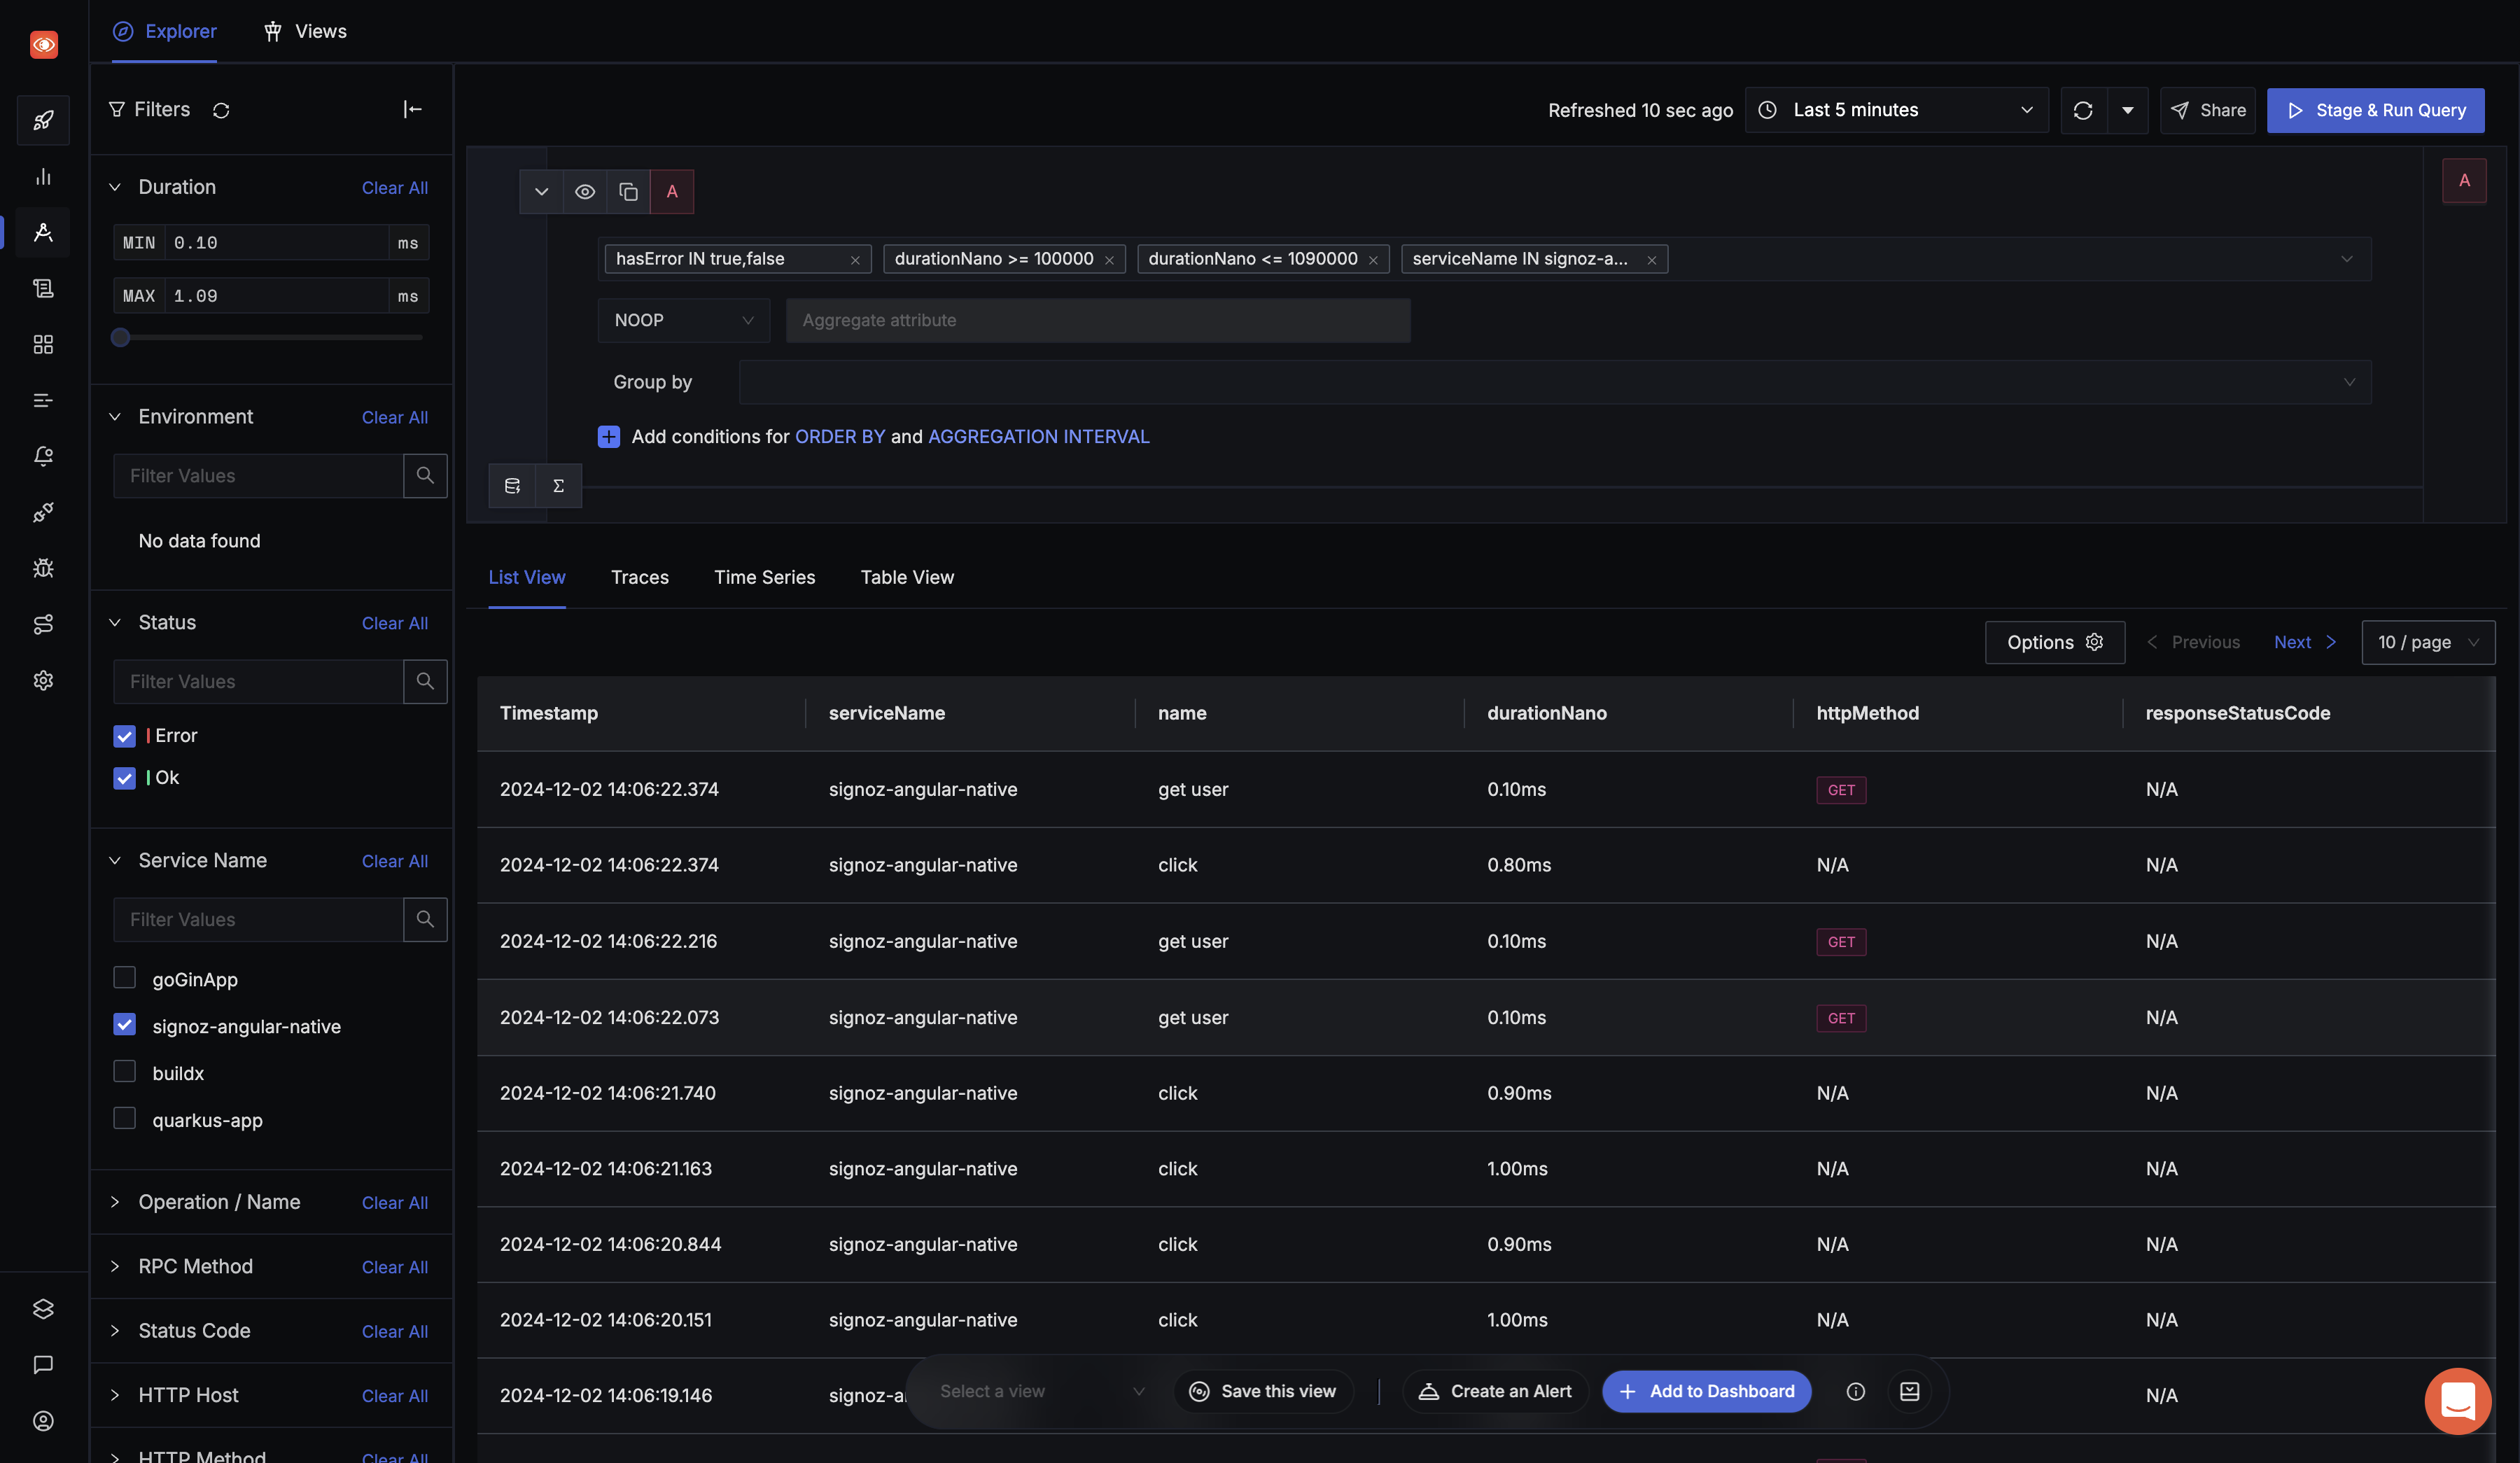
Switch to the Traces tab to analyze trace data for your application. Use filters to refine the results based on specific criteria, such as endpoints or timeframes.
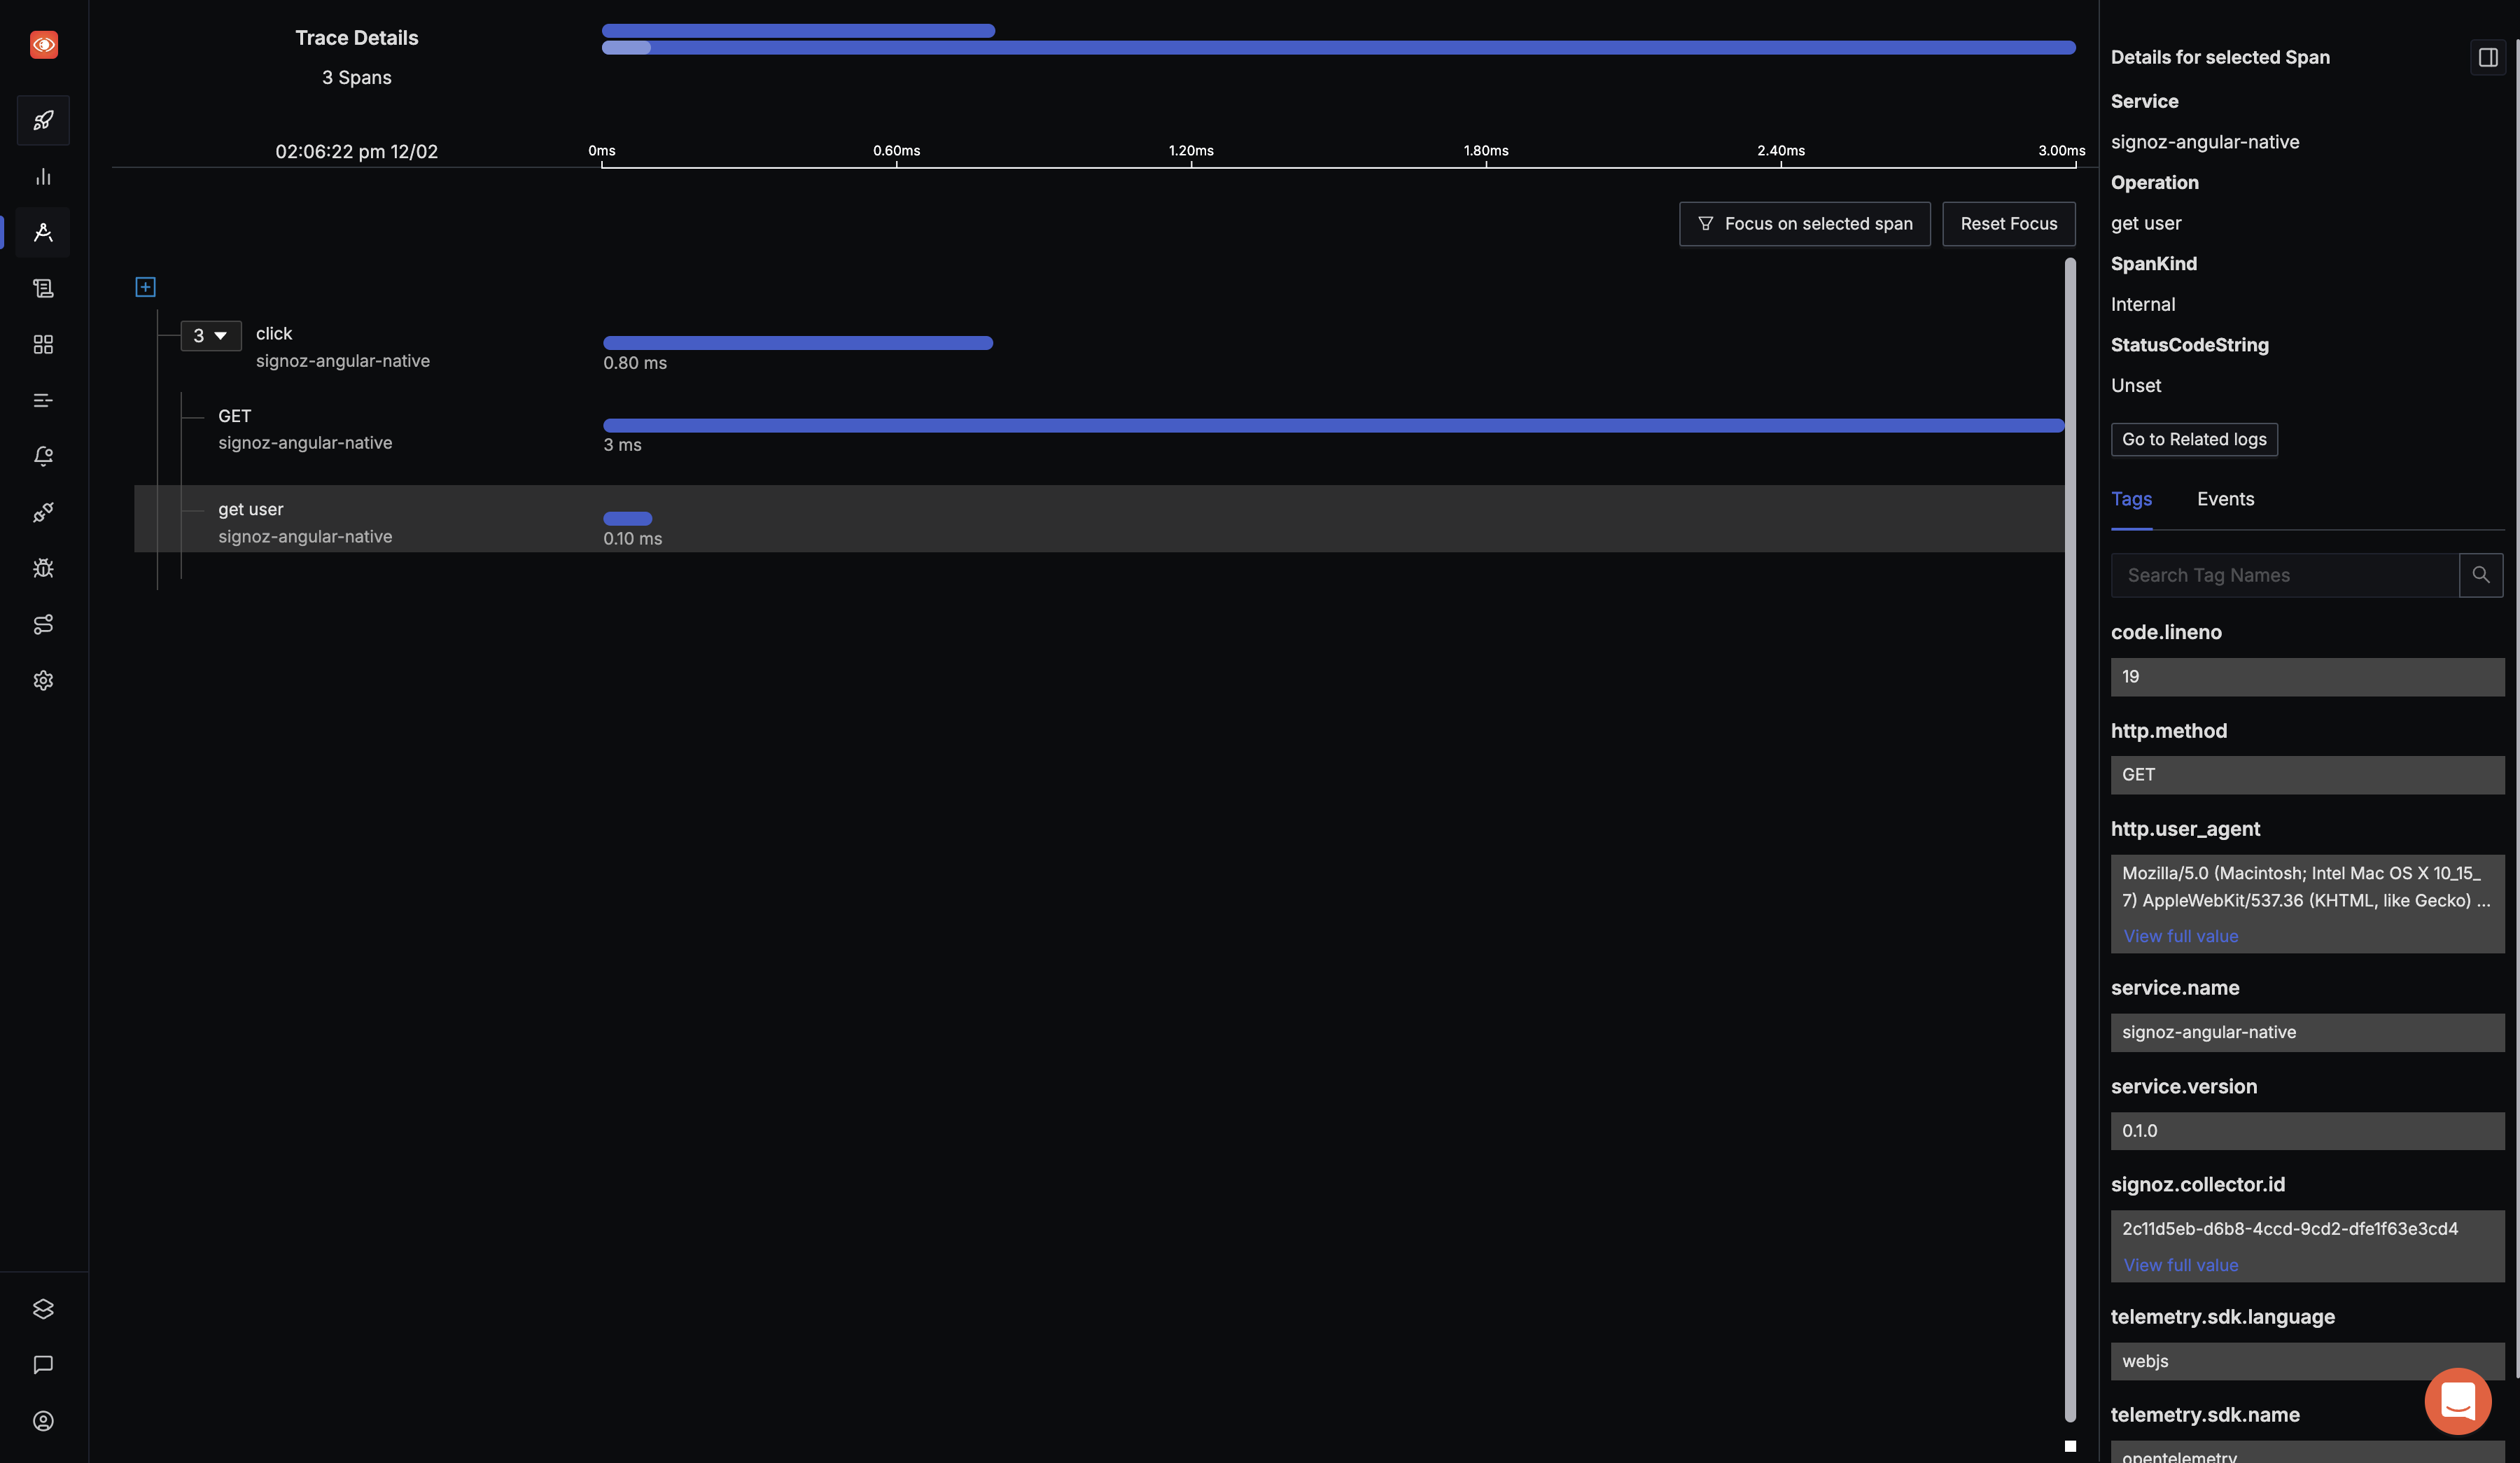
Click on any trace in the list to view detailed information about the operation, including its timeline, associated spans, and any errors. This allows you to analyze performance and troubleshoot issues effectively.
Benefits of Using OpenTelemetry with Angular
Implementing OpenTelemetry in Angular applications offers numerous advantages for developers and organizations. Let's explore the key benefits and specific use cases:
1. Comprehensive Observability
Benefit: OpenTelemetry provides a unified approach to observability, covering traces, metrics, and logs.
Use Case: In a complex Angular application with multiple services and APIs, OpenTelemetry can trace user interactions from the frontend through various backend services, providing a complete picture of the application's behavior.
Performance Improvement: Identifying bottlenecks across the entire application stack, potentially reducing end-to-end response times by 30-50% in complex scenarios.
2. Vendor Neutrality
Benefit: OpenTelemetry's vendor-neutral approach allows you to switch between different observability backends without changing your instrumentation code.
Use Case: An organization using a commercial APM tool can gradually transition to an open-source solution like SigNoz without rewriting its instrumentation, saving weeks of development time.
Performance Improvement: Flexibility to choose the most performant or cost-effective backend for your specific needs, potentially reducing observability costs by 40-60%.
3. Detailed Frontend Performance Insights
Benefit: OpenTelemetry can provide granular insights into Angular-specific operations and user interactions.
Use Case: Tracking component render times, change detection cycles, and user interactions (like button clicks or form submissions) to identify UI performance issues.
Performance Improvement: Fine-tuning based on these insights can lead to 20-40% improvement in perceived application responsiveness.
4. Correlation Between Frontend and Backend
Benefit: OpenTelemetry allows for tracing requests from the user's browser through your Angular app and into backend services.
Use Case: Debugging a slow user transaction by following its path through the entire system, from UI interaction to database queries.
Performance Improvement: This end-to-end visibility can lead to more efficient problem resolution, reducing MTTR (Mean Time To Resolution) by up to 70%.
5. Custom Business Metrics
Benefit: OpenTelemetry allows you to define and track custom metrics that are specific to your business logic.
Use Case: In an e-commerce Angular application, you can track metrics like cart abandonment rate, checkout flow efficiency, or product search accuracy.
Performance Improvement: Insights from custom metrics can drive UX improvements, potentially increasing conversion rates by 10-20%.
6. Improved Error Tracking and Debugging
Benefit: OpenTelemetry provides detailed context around errors, including the full trace leading up to the error.
Use Case: When a user reports an error, developers can see the exact sequence of events and state of the application at the time of the error.
Performance Improvement: This context can reduce debugging time by 40-60%, leading to faster issue resolution and improved application stability.
7. Performance Baseline and Regression Detection
Benefit: Continuous monitoring with OpenTelemetry allows you to establish performance baselines and detect regressions quickly.
Use Case: Automatically detecting performance degradation after a new deployment, allowing for quick rollback or fixes.
Performance Improvement: Early detection of performance issues can prevent 90% of performance-related user complaints before they occur.
8. Load Testing and Capacity Planning
Benefit: OpenTelemetry data can inform load testing strategies and capacity planning.
Use Case: Using production telemetry data to simulate realistic load scenarios and predict infrastructure needs for upcoming high-traffic events.
Performance Improvement: More accurate capacity planning can lead to 20-30% cost savings on infrastructure while ensuring application performance during peak loads.
By leveraging these benefits, Angular developers can create more robust, performant, and user-friendly applications while also streamlining their development and operations processes.
Common Challenges and Troubleshooting Tips for OpenTelemetry in Angular
When implementing OpenTelemetry in Angular applications, you may encounter several challenges. Here are some common issues and their solutions:
1. Context Propagation Issues
Challenge: Traces not connecting properly across different services or components.
Solution:
- Ensure that the
W3CTraceContextPropagatoris properly configured in yourapp.module.ts. - Use the
@opentelemetry/context-zonepackage to manage context in Angular's Zone.js.
Example configuration:
import { W3CTraceContextPropagator } from '@opentelemetry/core';
import { ZoneContextManager } from '@opentelemetry/context-zone';

*// In your OpenTelemetry configuration*const provider = new WebTracerProvider({
  *// ... other config*});

provider.register({
  propagator: new W3CTraceContextPropagator(),
  contextManager: new ZoneContextManager()
});
2. Performance Overhead
Challenge: Noticeable performance degradation after implementing OpenTelemetry.
Solution:
- Use sampling to reduce the volume of telemetry data.
- Optimize your instrumentation by focusing on critical paths.
Example of configuring a sampler:
import { ParentBasedSampler, TraceIdRatioBasedSampler } from '@opentelemetry/core';

const sampler = new ParentBasedSampler({
  root: new TraceIdRatioBasedSampler(0.5), *// Sample 50% of traces*});

const provider = new WebTracerProvider({
  sampler,
  *// ... other config*});
3. Asynchronous Operations Not Being Traced
Challenge: Traces not capturing asynchronous operations correctly.
Solution:
- Ensure that Zone.js is properly integrated with OpenTelemetry.
- Manually create spans for complex asynchronous operations.
Example of manually creating a span:
import { trace } from '@opentelemetry/api';

async function complexOperation() {
  const span = trace.getTracer('my-tracer').startSpan('complexOperation');
  try {
    *// Perform async operation*await someAsyncTask();
    span.end();
  } catch (error) {
    span.recordException(error);
    span.end();
    throw error;
  }
}
4. Incorrect Configuration of Exporters
Challenge: Telemetry data not reaching the backend (e.g., SigNoz).
Solution:
- Double-check the exporter configuration, especially the endpoint URLs.
- Ensure that CORS is properly configured if your collector is on a different domain.
Example of configuring the OTLPTraceExporter:
import { OTLPTraceExporter } from '@opentelemetry/exporter-trace-otlp-http';

const exporter = new OTLPTraceExporter({
  url: 'http://your-collector-url:4318/v1/traces', *// Adjust this URL*});

const provider = new WebTracerProvider();
provider.addSpanProcessor(new BatchSpanProcessor(exporter));
5. Handling Third-Party Libraries
Challenge: Difficulty in tracing operations within third-party libraries.
Solution:
- Use auto-instrumentation packages when available.
- For libraries without auto-instrumentation, wrap their methods with custom spans.
Example of wrapping a third-party library method:
import { trace } from '@opentelemetry/api';

function wrapThirdPartyMethod(originalMethod) {
  return function(...args) {
    const span = trace.getTracer('my-tracer').startSpan('thirdPartyOperation');
    try {
      const result = originalMethod.apply(this, args);
      span.end();
      return result;
    } catch (error) {
      span.recordException(error);
      span.end();
      throw error;
    }
  }
}

*// Usage*
thirdPartyLibrary.someMethod = wrapThirdPartyMethod(thirdPartyLibrary.someMethod);
By being aware of these common challenges and their solutions, you can more effectively implement and troubleshoot OpenTelemetry in your Angular applications.
Comparison: OpenTelemetry vs Other Monitoring Solutions for Angular
Developers have several options when choosing a monitoring solution for Angular applications. Here's how OpenTelemetry compares to other popular monitoring solutions:
OpenTelemetry vs Google Analytics
| Item | OpenTelemetry | Google Analytics |
|---|---|---|
| Primary Focus | Application Performance | User Behavior |
| Customizability | Highly customizable | Limited customization |
| Data Ownership | Self-hosted or choice of backend | Google-hosted |
| Technical Depth | Deep technical insights | Surface-level technical data |
| Cost | Open-source, backend costs vary | Free tier available, paid for advanced features |
Key Difference: OpenTelemetry provides deep technical insights into application performance, while Google Analytics focuses on user behavior and high-level metrics.
OpenTelemetry vs New Relic
| Feature | OpenTelemetry | New Relic |
|---|---|---|
| Vendor Lock-in | No lock-in | Proprietary solution |
| Setup Complexity | Moderate | Low |
| Customizability | Highly customizable | Customizable within platform limits |
| Cost | Open-source, backend costs vary | Subscription-based, can be expensive at scale |
| Out-of-the-box Features | Requires configuration | Many features available immediately |
Key Difference: OpenTelemetry offers more flexibility and avoids vendor lock-in, while New Relic provides a more turnkey solution with a steeper cost curve.
OpenTelemetry vs Sentry
| Feature | OpenTelemetry | Sentry |
|---|---|---|
| Primary Focus | Comprehensive observability | Error tracking and performance |
| Language Support | Wide language support | Wide language support |
| Integration Effort | Moderate | Low |
| Real User Monitoring | Possible with custom implementation | Built-in RUM features |
| Cost | Open-source, backend costs vary | Free tier, paid plans for advanced features |
Key Difference: OpenTelemetry provides a more comprehensive observability solution, while Sentry excels in error tracking and offers easier integration for basic use cases.
OpenTelemetry vs Custom Logging Solution
| Feature | OpenTelemetry | Custom Logging |
|---|---|---|
| Standards Compliance | Industry standard | Custom implementation |
| Community Support | Large community | No community support |
| Integration with Tools | Wide range of integrations | Limited to custom integrations |
| Development Time | Reduced development time | Significant development time |
| Scalability | Designed for scale | Depends on implementation |
Key Difference: OpenTelemetry provides a standardized, scalable solution with community support, while custom logging offers maximum control but requires significant development effort.
Best Practices for Configuring OpenTelemetry in Production Angular Environments
When deploying Angular applications instrumented with OpenTelemetry to production, it's crucial to optimize for performance, reliability, and security. Here are some best practices to consider:
1. Implement Proper Sampling
- Use intelligent sampling to reduce data volume without losing important information.
- Consider using a parent-based sampler to maintain consistency across traces.
Example configuration:
import { ParentBasedSampler, TraceIdRatioBasedSampler } from '@opentelemetry/core';

const sampler = new ParentBasedSampler({
  root: new TraceIdRatioBasedSampler(0.1), *// Sample 10% of traces*});

const provider = new WebTracerProvider({
  sampler,
  *// other config...*});
2. Use Batch Processing
- Implement batch processing to reduce network overhead and improve performance.
Example:
import { BatchSpanProcessor } from '@opentelemetry/sdk-trace-base';
import { OTLPTraceExporter } from '@opentelemetry/exporter-trace-otlp-http';

const exporter = new OTLPTraceExporter({
  url: 'https://your-collector-endpoint',
});

const provider = new WebTracerProvider();
provider.addSpanProcessor(new BatchSpanProcessor(exporter, {
  maxQueueSize: 100,
  maxExportBatchSize: 10,
  scheduledDelayMillis: 500,
}));
3. Secure Your Data
- Use HTTPS for all communication with your collector.
- Implement proper authentication for your collector endpoints.
- Be cautious about what data you include in spans, avoiding sensitive information.
4. Optimize Performance
- Use async operations where possible to avoid blocking the main thread.
- Implement custom spans judiciously, focusing on critical paths and operations.
Example of an optimized custom span:
import { trace } from '@opentelemetry/api';

async function performCriticalOperation() {
  const span = trace.getTracer('critical-ops').startSpan('criticalOperation');
  try {
    *// Perform operation*const result = await someAsyncOperation();
    span.setAttributes({ 'operation.result': result });
    return result;
  } catch (error) {
    span.recordException(error);
    throw error;
  } finally {
    span.end();
  }
}
5. Implement Proper Error Handling
- Ensure all exceptions are properly caught and recorded in spans.
- Use span events to record important application events.
6. Use Resource Detection
- Implement resource detection to automatically capture environment information.
Example:
import { Resource } from '@opentelemetry/resources';
import { SemanticResourceAttributes } from '@opentelemetry/semantic-conventions';

const resource = Resource.default().merge(
  new Resource({
    [SemanticResourceAttributes.SERVICE_NAME]: 'my-angular-app',
    [SemanticResourceAttributes.SERVICE_VERSION]: '1.0.0',
    environment: 'production',
  })
);

const provider = new WebTracerProvider({
  resource: resource,
  *// other config...*});
7. Monitor Your Monitoring
- Implement health checks for your OpenTelemetry pipeline.
- Set up alerts for issues with data collection or exporting.
Conclusion
Using OpenTelemetry Angular libraries, you can instrument your frontend applications for end-to-end tracing. You can then use an open-source APM tool like SigNoz to ensure the smooth performance of your Angular apps.
OpenTelemetry is the future for setting up observability for cloud-native apps. It is backed by a huge community and covers a wide variety of technology and frameworks. Using OpenTelemetry, engineering teams can instrument polyglot and distributed applications with peace of mind.
Using SigNoz to monitor your Angular applications offers several advantages:
Real-Time Insights: Track critical performance metrics such as success rates, execution durations, and failure counts in real-time.
Intuitive Dashboards: SigNoz provides visually appealing dashboards that make it easy to analyze key metrics, pinpoint issues, and optimize application performance.
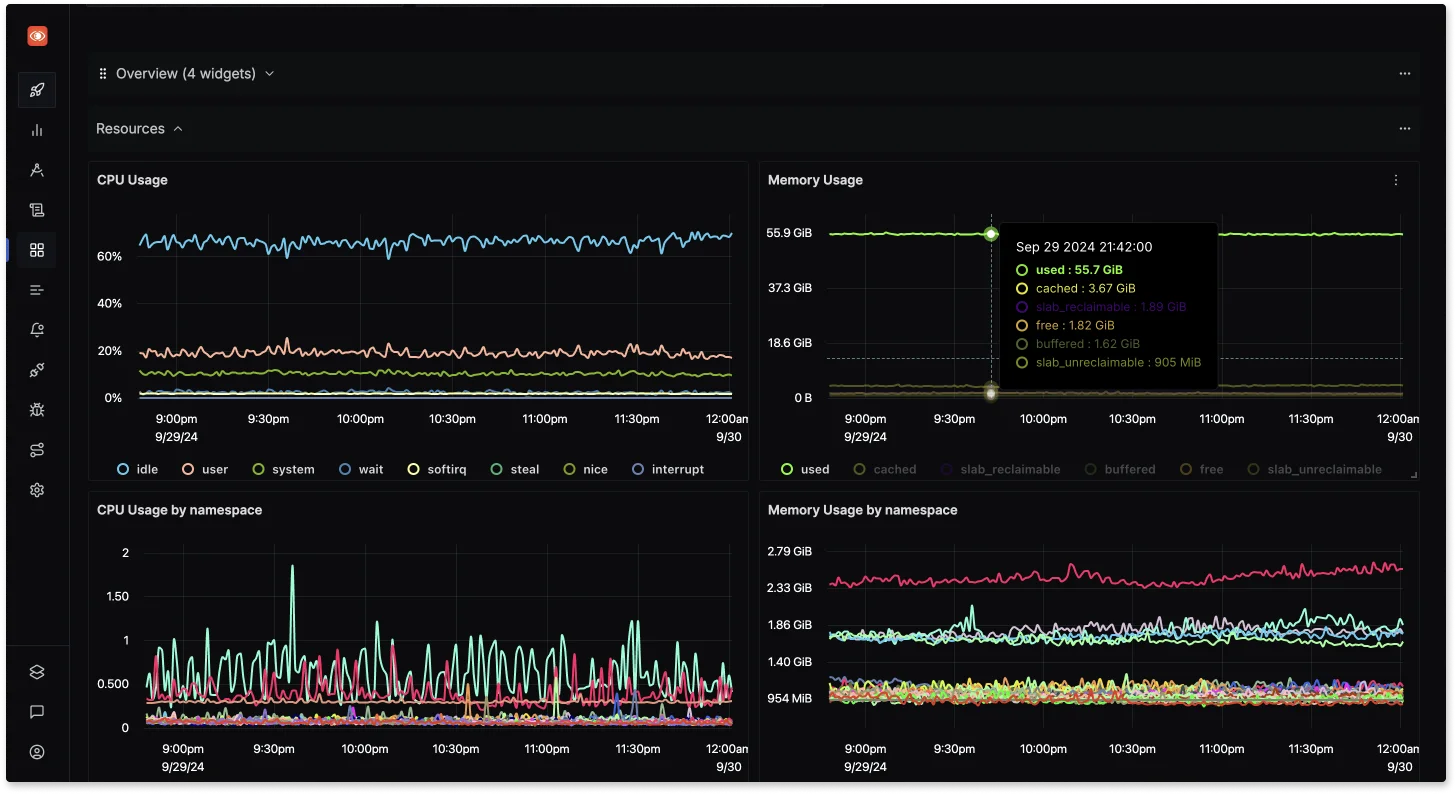
SigNoz: metrics and dashboards
Proactive Monitoring: With advanced alerting capabilities, SigNoz notifies you of critical failures or performance bottlenecks, empowering faster troubleshooting and maintaining smooth operations.
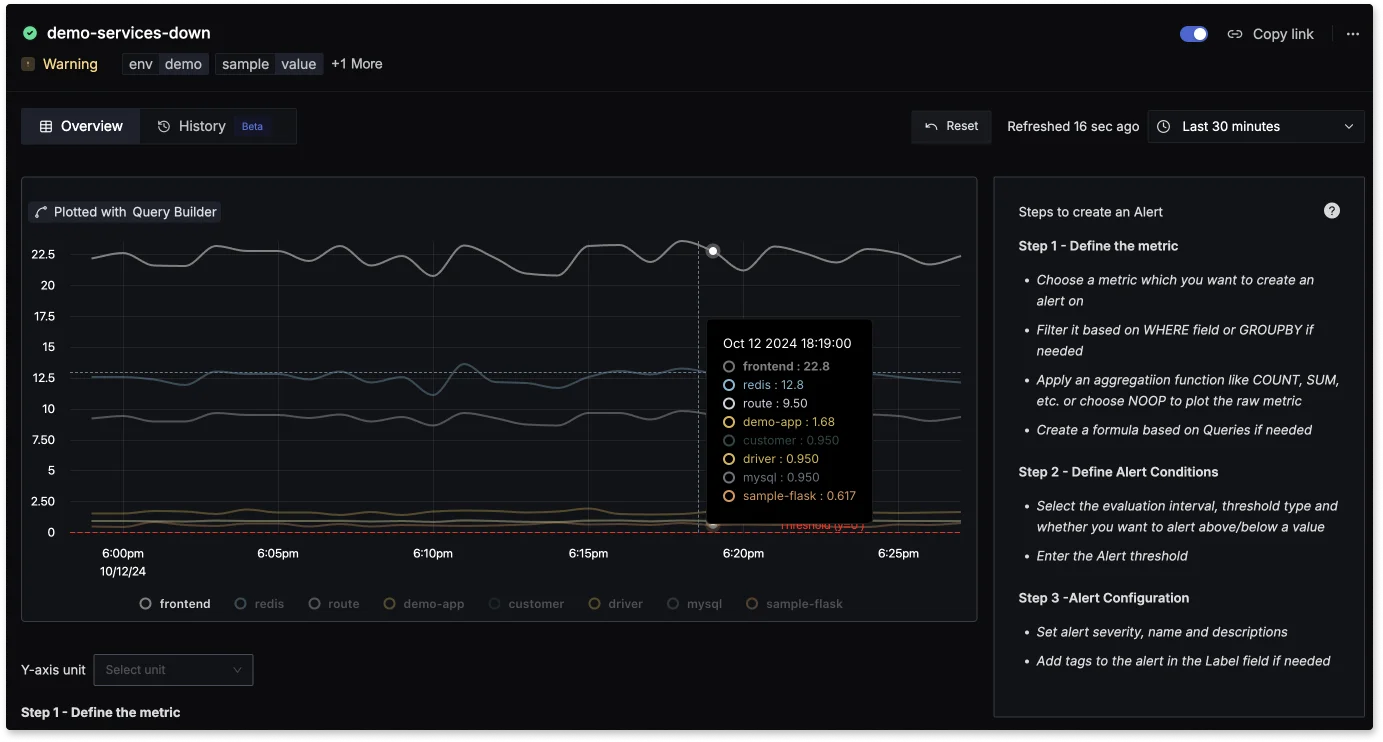
SigNoz alerting capabilities
By combining OpenTelemetry and SigNoz, you can establish a powerful observability framework, ensuring your Angular applications are performant.
SigNoz cloud is the easiest way to run SigNoz. Sign up for a free account and get 30 days of unlimited access to all features.
You can also install and self-host SigNoz yourself since it is open-source. With 19,000+ GitHub stars, open-source SigNoz is loved by developers. Find the instructions to self-host SigNoz.
FAQs
How does OpenTelemetry differ from other Angular monitoring solutions?
OpenTelemetry stands out due to its vendor-neutral approach and comprehensive coverage of both frontend and backend operations. Unlike some Angular-specific solutions, OpenTelemetry allows for standardized instrumentation across your entire stack.
Can OpenTelemetry impact my Angular app's performance?
While OpenTelemetry does add some overhead, it's designed to be lightweight. With proper configuration and use of sampling techniques, the impact on your application's performance should be minimal.
Is it possible to use OpenTelemetry with existing monitoring tools?
Yes, OpenTelemetry is designed to be compatible with many existing monitoring solutions. You can often export OpenTelemetry data to your current tools, allowing for a gradual transition or hybrid approach.
How can I troubleshoot common OpenTelemetry issues in Angular?
Common issues often relate to context propagation or incorrect configuration. Start by verifying your setup, checking console outputs, and ensuring Zone Context is properly integrated. If problems persist, the OpenTelemetry community forums are an excellent resource for troubleshooting.
Further Reading
Monitor gRPC calls with OpenTelemetry
Distributed Tracing for a nodejs application


