Django is a popular open-source python web framework that enables rapid development while taking out much of the hassle from routine web development. It also helps developers to avoid common security mistakes. As such, many applications are built with Django.

Django is very popular among web developers and has a huge community behind it. It gives web developers ready-to-use components for common things that you will need to accomplish for a web application. Some examples are user authentication, admin panel for your website, forms, etc.
A Django application is built of different components like a web server, database, web server gateway interface, etc. To monitor a Django application for performance, you need to monitor all these components. And that’s where OpenTelemetry comes into the picture.
What is OpenTelemetry Django?
OpenTelemetry Django instrumentation enables generation of telemetry data from your Django application. The data is then used to monitor performance of Django application.
OpenTelemetry provides an open-source standard with a consistent collection mechanism and data format. As application owners, you will always have the freedom to choose different vendors to visualize the collected telemetry data.
Instrumentation is the biggest challenge engineering teams face when starting out with monitoring their application performance. OpenTelemetry is the leading open-source standard that is solving the problem of instrumentation. It is currently an incubating project under the Cloud Native Computing Foundation.
It is a set of tools, APIs, and SDKs used to instrument applications to create and manage telemetry data(Logs, metrics, and traces). It aims to make telemetry data(logs, metrics, and traces) a built-in feature of cloud-native software applications.
One of the biggest advantages of using OpenTelemetry is that it is vendor-agnostic. It can export data in multiple formats which you can send to a backend of your choice.
In this article, we will use SigNoz as a backend. SigNoz is an open-source APM tool built natively for OpenTelemetry and can be used for both metrics and distributed tracing. We will visualize the data captured by OpenTelemetry using SigNoz.
Running Django application with OpenTelemetry
First, you need to install SigNoz. Data collected by OpenTelemetry will be sent to SigNoz for storage and visualization.
Setting up SigNoz
You need a backend to which you can send the collected data for monitoring and visualization. SigNoz is an OpenTelemetry-native APM that is well-suited for visualizing OpenTelemetry data.
SigNoz cloud is the easiest way to run SigNoz. You can sign up here for a free account and get 30 days of unlimited access to all features.
You can also install and self-host SigNoz yourself. Check out the docs for installing self-host SigNoz.
Instrumenting a sample Django application with OpenTelemetry
Prerequisites:
Python 3.8 or newer. Download the latest version of Python.
for Django, you must define
DJANGO_SETTINGS_MODULEcorrectly. If your project is calledmysite, something like following should work:export DJANGO_SETTINGS_MODULE=mysite.settings
Step 1. Running sample Django app
We will be using the Django app at this Github repo. All the required OpenTelemetry and Python packages are contained within the requirements.txt file.
git clone https://github.com/SigNoz/sample-django.git
cd sample-django
It’s a good practice to create virtual environments for running Python apps, so we will be using a virtual python environment for this sample Django app
Create a Virtual Environment
python3 -m venv .venv
source .venv/bin/activate
Step 2. Installing necessary OpenTelemetry and Python packages
The requirements.txt file contains all the necessary OpenTelemetry and Python packages needed for instrumentation. In order to install those packages, run the following command:
python -m pip install -r requirements.txt
The dependencies included are briefly explained below:
opentelemetry-distro - The distro provides a mechanism to automatically configure some of the more common options for users. It helps to get started with OpenTelemetry auto-instrumentation quickly.
opentelemetry-exporter-otlp - This library provides a way to install all OTLP exporters. You will need an exporter to send the data to SigNoz.
💡 The opentelemetry-exporter-otlp is a convenient wrapper package to install all OTLP exporters. Currently, it installs:
opentelemetry-exporter-otlp-proto-http
opentelemetry-exporter-otlp-proto-grpc
(soon) opentelemetry-exporter-otlp-json-http
The opentelemetry-exporter-otlp-proto-grpc package installs the gRPC exporter which depends on the grpcio package. The installation of grpcio may fail on some platforms for various reasons. If you run into such issues, or you don't want to use gRPC, you can install the HTTP exporter instead by installing the opentelemetry-exporter-otlp-proto-http package. You need to set the OTEL_EXPORTER_OTLP_PROTOCOL environment variable to http/protobuf to use the HTTP exporter.
Step 3. Install application-specific packages
This step is required to install packages specific to the application. This command figures out which instrumentation packages the user might want to install and installs it for them:
opentelemetry-bootstrap --action=install
Please make sure that you have installed all the dependencies of your application before running the above command. The command will not install instrumentation for the dependencies which are not installed.
Step 4. Prepare your Django app
Now you need to run the following three commands to prepare the sample Django application.
a. This command is used to perform the initial database migration. You will only need to run this the very first time you deploy your app.
python3 manage.py migrate
b. This command is used to collect static files from multiple apps into a single path.
python3 manage.py collectstatic
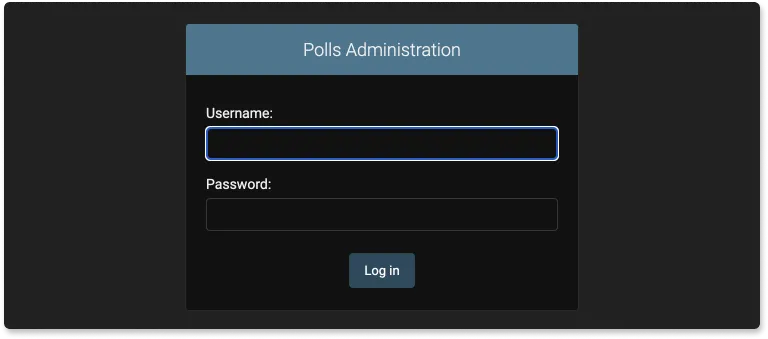
c. The following command creates a user who can log in to the admin site. You will be asked to create a username and a password. You will need the username and password to login to the admin portal later.
python3 manage.py createsuperuser
The sample app creates an admin login as shown in the picture below.

Step 5. Configure environment variables to run app and send data to SigNoz
Finally you can run your Django app with OpenTelemetry and send data to SigNoz for monitoring. You can do that in three ways and you can choose what’s more suited to you.
a. To run with gunicorn you need to add post_fork hook
To run the sample app with Gunicorn, we have added a file named gunicorn.config.py. In this step, you just need to configure a few environment variables for your OTLP exporters. Environment variables that need to be configured:
OTEL_RESOURCE_ATTRIBUTES=service.name=<service_name> \
OTEL_EXPORTER_OTLP_ENDPOINT="https://ingest.{region}.signoz.cloud:443" \
OTEL_EXPORTER_OTLP_HEADERS="signoz-ingestion-key=SIGNOZ_INGESTION_KEY" \
OTEL_EXPORTER_OTLP_PROTOCOL=grpc \
opentelemetry-instrument <your_run_command>
<service_name>is the name of the service you want<your_run_command>can be python3 app.py or python manage.py runserver --noreload or gunicorn<DJANGO_APP>.wsgi -c gunicorn.config.py --workers 2 --threads 2 --reload- Replace SIGNOZ_INGESTION_KEY with the api token provided by SigNoz. You can find it in the email sent by SigNoz with your cloud account details.
You will be able to get ingestion details in SigNoz cloud account under settings --> ingestion settings.

Don’t run app in reloader/hot-reload mode as it breaks instrumentation. For example, if you use --reload or reload=True, it enables the reloader mode which breaks OpenTelemetry isntrumentation.
For our sample django application, the run command will look like:
OTEL_RESOURCE_ATTRIBUTES=service.name=sample-django-app \
OTEL_EXPORTER_OTLP_ENDPOINT="https://ingest.{region}.signoz.cloud:443" \
OTEL_EXPORTER_OTLP_HEADERS="signoz-ingestion-key=SIGNOZ_INGESTION_KEY" \
OTEL_EXPORTER_OTLP_PROTOCOL=grpc \
opentelemetry-instrument gunicorn mysite.wsgi -c gunicorn.config.py --workers 2 --threads 2 --reload
And, congratulations! You have enabled OpenTelemetry to capture telemetry data from your Django application. And, you are sending the captured data to SigNoz.
You can check if your app by opening the admin panel at http://localhost:8000/admin.
You need to generate some load on your app so that there is data to be captured by OpenTelemetry. Try adding a few questions in the polls app and play around.
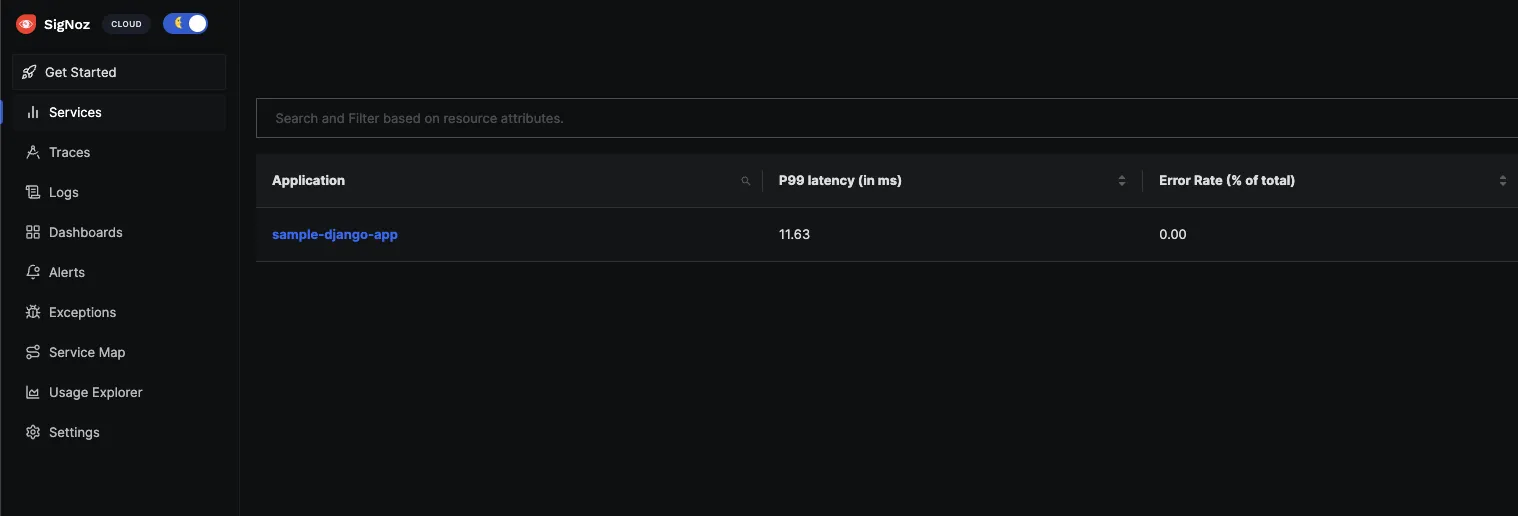
You will find sample-django-app in the list of sample applications being monitored by SigNoz.

If you want to run the application with a docker image, refer to the section below for instructions.
Run with docker
You can use the below instructions if you want to run your app as a docker image, below are the instructions.
Build docker image
docker build -t sample-django-app .
Setting environment variables
You need to set some environment variables while running the application with OpenTelemetry and send collected data to SigNoz. You can do so with the following commands at the terminal:
# If you have your SigNoz IP Address, replace <IP of SigNoz> with your IP Address.

docker run -d --name django-container \
-e OTEL_METRICS_EXPORTER='none' \
-e OTEL_RESOURCE_ATTRIBUTES='service.name=djangoApp' \
-e OTEL_EXPORTER_OTLP_ENDPOINT="https://ingest.{region}.signoz.cloud:443" \
-e OTEL_EXPORTER_OTLP_HEADERS="signoz-ingestion-key=SIGNOZ_INGESTION_KEY" \
-e OTEL_EXPORTER_OTLP_PROTOCOL=grpc \
-p 8000:8000 sample-django-app
If you're using docker compose setup:
# If you are running signoz through official docker compose setup, run `docker network ls` and find clickhouse network id. It will be something like this clickhouse-setup_default
# and pass network id by using --net <network ID>

docker run -d --name django-container \
--net clickhouse-setup_default  \
--link clickhouse-setup_otel-collector_1 \
-e OTEL_METRICS_EXPORTER='none' \
-e OTEL_RESOURCE_ATTRIBUTES='service.name=djangoApp' \
-e OTEL_EXPORTER_OTLP_ENDPOINT="https://ingest.{region}.signoz.cloud:443" \
-e OTEL_EXPORTER_OTLP_HEADERS="signoz-ingestion-key=SIGNOZ_INGESTION_KEY" \
-e OTEL_EXPORTER_OTLP_PROTOCOL=grpc \
-p 8000:8000 sample-django-app
Monitor Django application with SigNoz
SigNoz makes it easy to visualize metrics and traces captured through OpenTelemetry instrumentation.
SigNoz comes with out of box RED metrics charts and visualization. RED metrics stands for:
- Rate of requests
- Error rate of requests
- Duration taken by requests

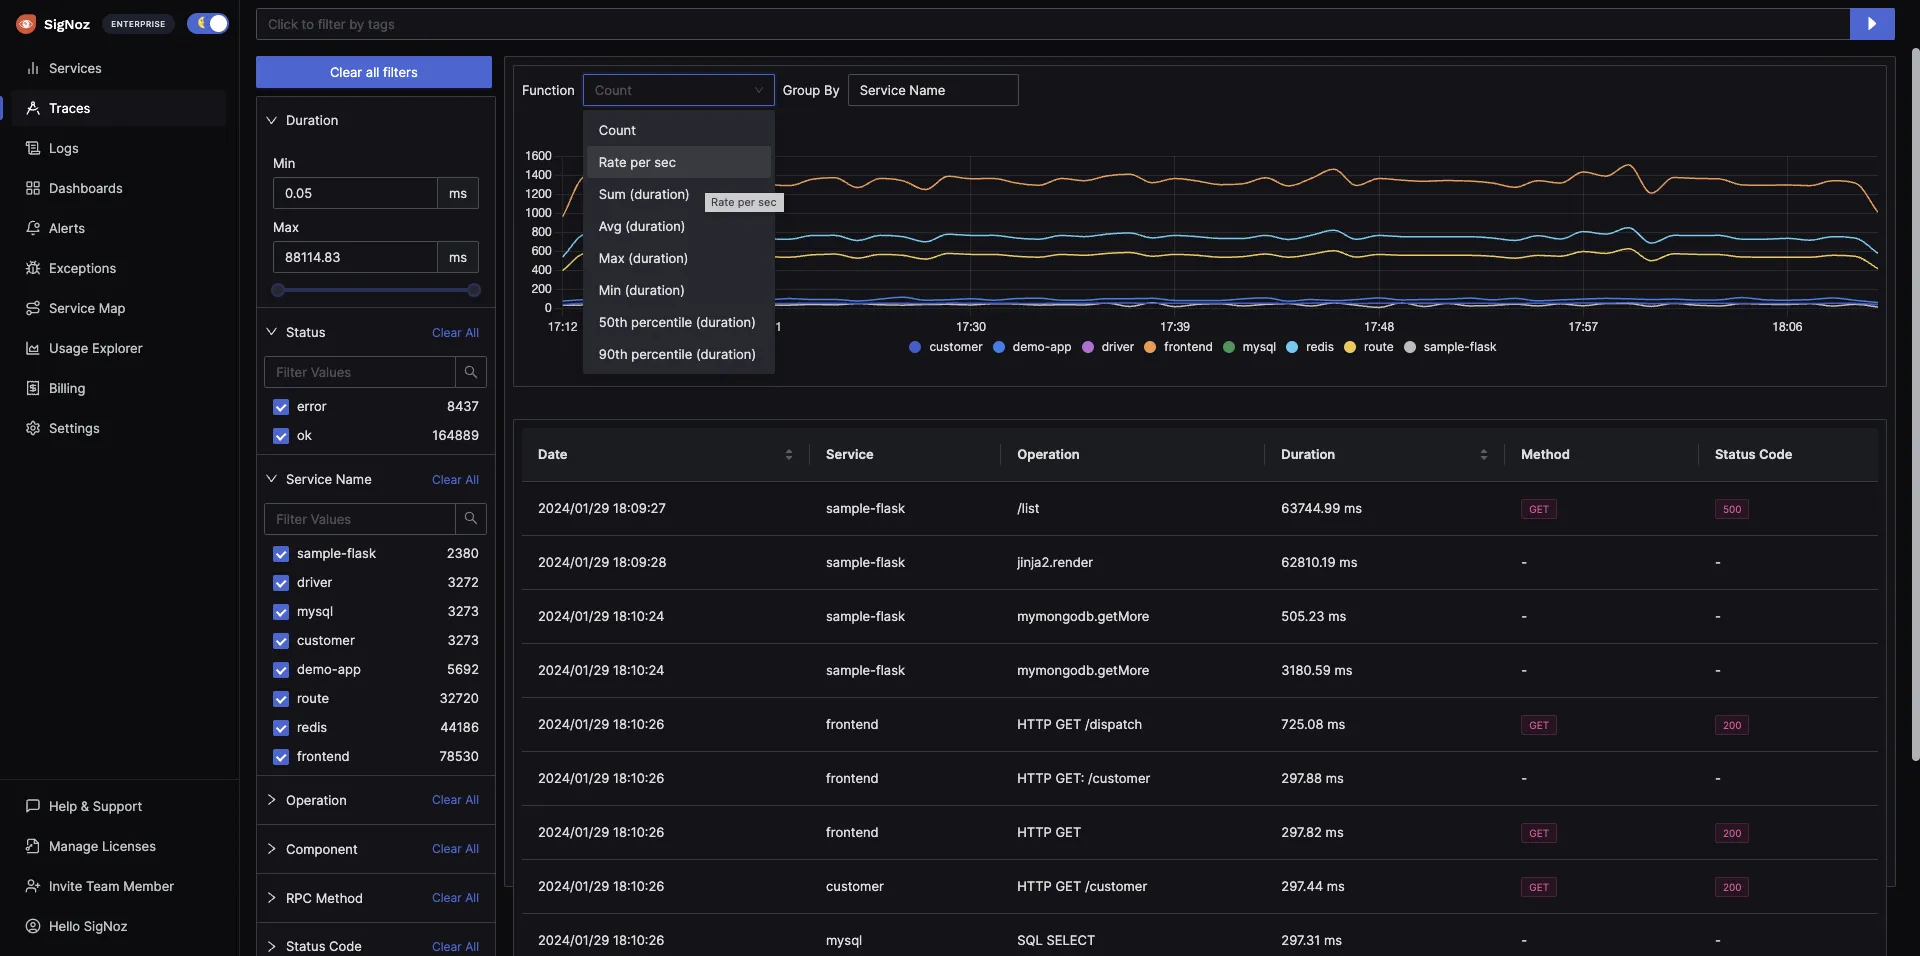
You can then choose a particular timestamp where latency is high to drill down to traces around that timestamp.

You can use flamegraphs to exactly identify the issue causing the latency.

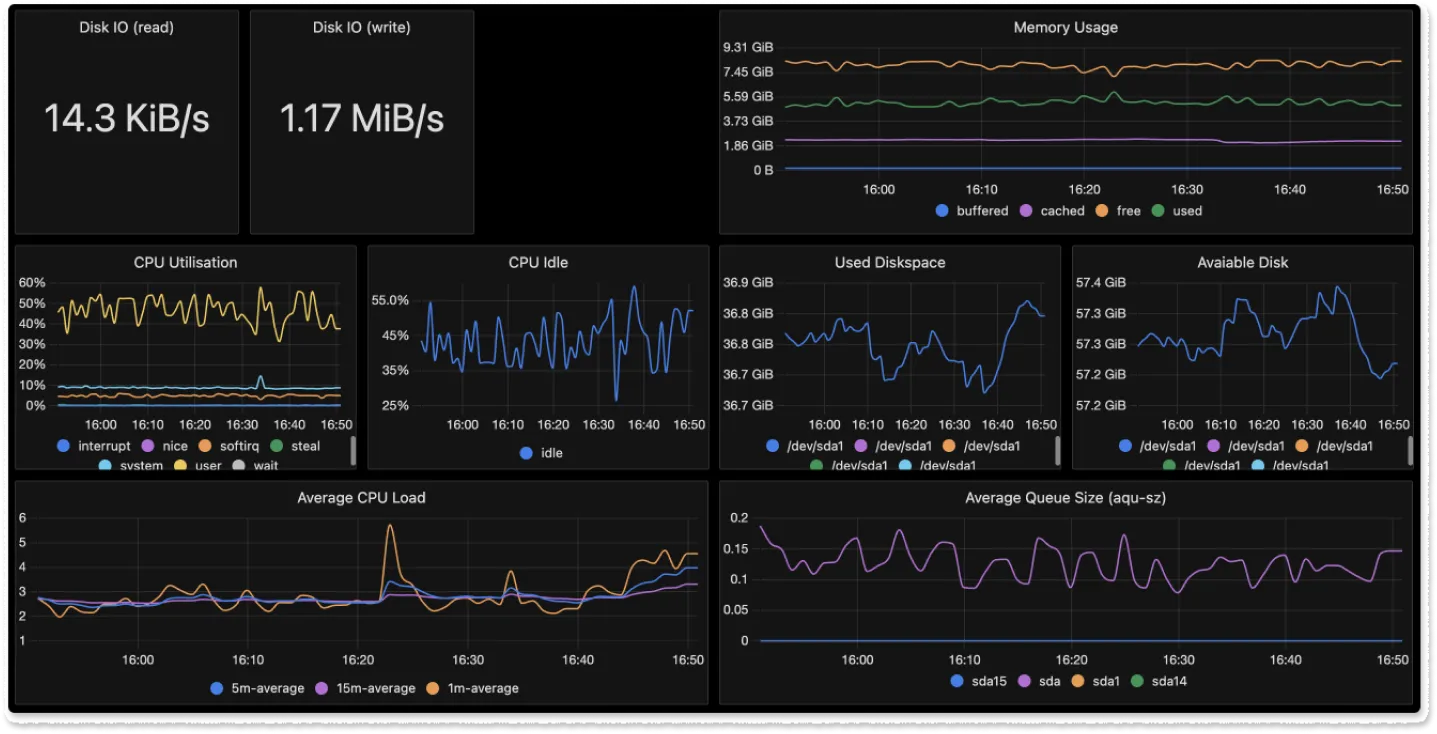
You can also build custom metrics dashboard for your infrastructure.

OpenTelemetry vs Other Django Monitoring Solutions
When it comes to monitoring Django applications, OpenTelemetry offers several advantages over other solutions. Let's compare OpenTelemetry with some popular alternatives:
1. OpenTelemetry vs Django Debug Toolbar
Django Debug Toolbar:
- Pros: Easy to set up, provides detailed information about queries, templates, and HTTP headers.
- Cons: Only works in development, not suitable for production monitoring.
OpenTelemetry:
- Pros: Works in both development and production, provides distributed tracing, more comprehensive data collection.
- Cons: Requires more initial setup.
2. OpenTelemetry vs New Relic
New Relic:
- Pros: Comprehensive APM solution, easy to set up with Django.
- Cons: Proprietary solution, can be expensive for large-scale applications.
OpenTelemetry:
- Pros: Open-source, vendor-agnostic, more flexible and customizable.
- Cons: Requires more configuration and a separate backend for data storage and visualization.
3. OpenTelemetry vs Sentry
Sentry:
- Pros: Excellent for error tracking and crash reporting.
- Cons: Limited in terms of performance monitoring and distributed tracing.
OpenTelemetry:
- Pros: Provides both error tracking and performance monitoring, supports distributed tracing.
- Cons: May require additional setup for error tracking features.
4. OpenTelemetry vs Datadog
Datadog:
- Pros: Comprehensive monitoring solution with wide integration support.
- Cons: Can be expensive, proprietary solution.
OpenTelemetry:
- Pros: Open-source, more cost-effective for large-scale deployments, vendor-agnostic.
- Cons: Requires more initial setup and configuration.
Key Advantages of OpenTelemetry:
Vendor Agnostic: OpenTelemetry allows you to switch between different backends without changing your instrumentation code.
Comprehensive Data Collection: Collects traces, metrics, and logs in a standardized format.
Community-Driven: Being open-source, it benefits from community contributions and rapid improvements.
Future-Proof: As an emerging standard backed by major tech companies, it's likely to have long-term support and development.
Flexibility: Can be used with various languages and frameworks beyond Django.
Cost-Effective: Open-source nature makes it more cost-effective for large-scale deployments.
While OpenTelemetry requires more initial setup compared to some out-of-the-box solutions, its flexibility, comprehensive data collection, and vendor-agnostic nature make it an excellent choice for Django applications, especially those looking for a scalable, future-proof monitoring solution.
Conclusion
OpenTelemetry makes it very convenient to instrument your Django application. You can then use an open-source APM tool like SigNoz to analyze the performance of your app. As SigNoz offers a full-stack observability tool, you don't have to use multiple tools for your monitoring needs.
You can try out SigNoz by visiting its GitHub repo 👇 
If you are someone who understands more from video, then you can watch the below video tutorial on the same with SigNoz.
If you have any questions or need any help in setting things up, join our slack community and ping us in #support channel.
FAQs
What is OpenTelemetry Django?
OpenTelemetry Django instrumentation enables the generation of telemetry data from your Django application. This data is then used to monitor the performance of Django applications. OpenTelemetry provides an open-source standard with a consistent collection mechanism and data format.
Why should I use OpenTelemetry for monitoring my Django application?
OpenTelemetry is vendor-agnostic and provides a standardized way to instrument your Django application. It allows you to collect telemetry data (logs, metrics, and traces) which can be exported to various backends. This flexibility ensures that you're not locked into a specific monitoring solution.
How do I set up OpenTelemetry instrumentation for my Django application?
To set up OpenTelemetry instrumentation for Django:
- Install necessary packages (opentelemetry-distro, opentelemetry-exporter-otlp)
- Configure environment variables for the OTLP exporter
- Use the opentelemetry-instrument command to run your Django application
- Choose a backend (like SigNoz) to visualize and analyze the collected data
Can I use OpenTelemetry with Docker for my Django application?
Yes, you can use OpenTelemetry with Docker for your Django application. You'll need to build a Docker image of your app, set the necessary environment variables for OpenTelemetry, and run the container with these variables. The article provides specific instructions for this setup.
What kind of metrics can I monitor with OpenTelemetry for Django?
With OpenTelemetry, you can monitor various metrics for your Django application, including:
- Request rate
- Error rate
- Request duration (latency)
- Database query performance
- External service calls
- Custom metrics specific to your application logic
How does OpenTelemetry Django instrumentation affect my application's performance?
OpenTelemetry is designed to have minimal impact on application performance. However, as with any instrumentation, there may be a slight overhead. The benefits of comprehensive monitoring and troubleshooting capabilities usually outweigh this minimal performance impact.
If you want to read more about SigNoz 👇
Django Logging - Complete Guide to Python Django Logging
Golang Aplication Monitoring with OpenTelemetry and SigNoz
OpenTelemetry collector - complete guide


