OpenTelemetry can auto-instrument your Java Spring Boot application to capture telemetry data from a number of popular libraries and frameworks that your application might be using. It can be used to collect logs, metrics, and traces from your Spring Boot application. In this tutorial, we will integrate OpenTelemetry with a Spring Boot application for traces and logs.
Before the demo begins, let's have a brief overview of OpenTelemetry.
What is OpenTelemetry?
OpenTelemetry is a set of API, SDKs, libraries, and integrations aiming to standardize the generation, collection, and management of telemetry data(logs, metrics, and traces). OpenTelemetry is a Cloud Native Computing Foundation project created after the merger of OpenCensus(from Google) and OpenTracing(From Uber).
It consists of three core components:
- Traces: Detailed records of request flows through your system
- Metrics: Quantitative measurements of your application's performance
- Logs: Timestamped records of discrete events
The data you collect with OpenTelemetry is vendor-agnostic and can be exported in many formats. Telemetry data has become critical to observe the state of distributed systems. With microservices and polyglot architectures, there was a need to have a global standard. OpenTelemetry aims to fill that space and is doing a great job at it thus far.
There are two important components in OpenTelemetry that comes in handy to collect telemetry data:
- Client Libraries
For Java applications, OpenTelemetry provides a JAR agent that can be attached to any Java 8+ application. It can detect a number of popular libraries and frameworks and instrument applications right out of the box for generating telemetry data. - OpenTelemetry Collector
It is a stand-alone service provided by OpenTelemetry. It can be used as a telemetry-processing system with a lot of flexible configurations to collect and manage telemetry data.
Typically, here's how an application architecture instrumented with OpenTelemetry looks like.
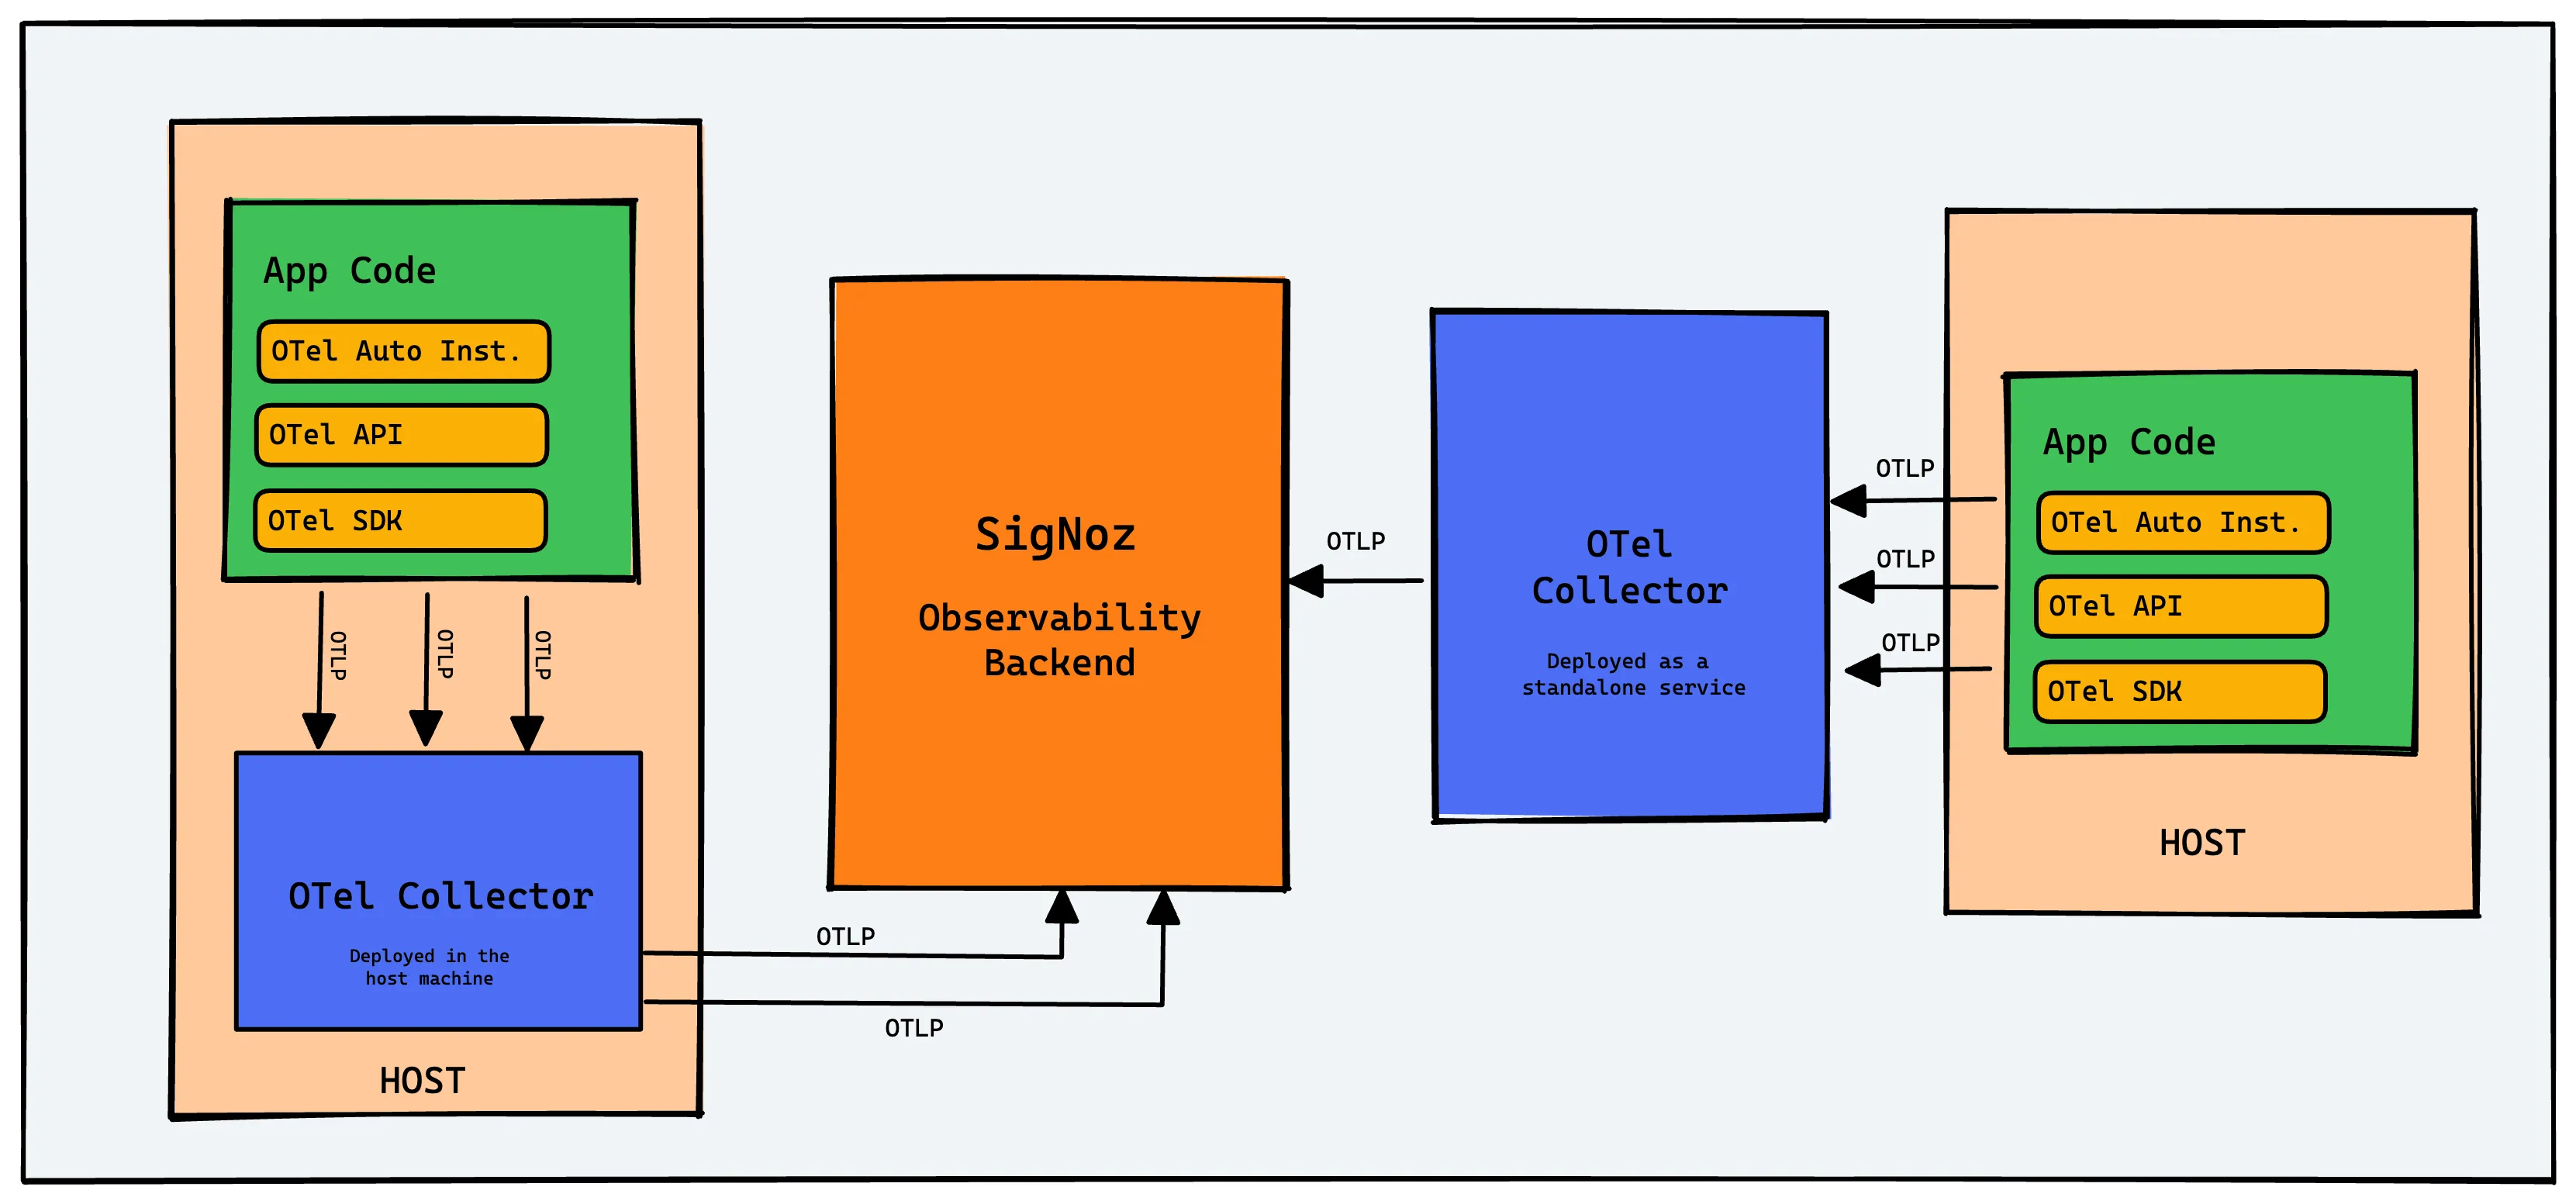
Architecture - How OpenTelemetry fits in an application architecture. OTel collector refers to OpenTelemetry Collector
OpenTelemetry provides client libraries and agents for most of the popular programming languages. There are two types of instrumentation:
- Auto-instrumentation
OpenTelmetry can collect data for many popular frameworks and libraries automatically. You don’t have to make any code changes. - Manual instrumentation
If you want more application-specific data, OpenTelemetry SDK provides you with the capabilities to capture that data using OpenTelemetry APIs and SDKs.
For a Java Spring Boot application, we can use the OpenTelemetry Java Jar agent to instrument the application. The agent is capable of capturing telemetry data from various popular libraries and frameworks used in the application.
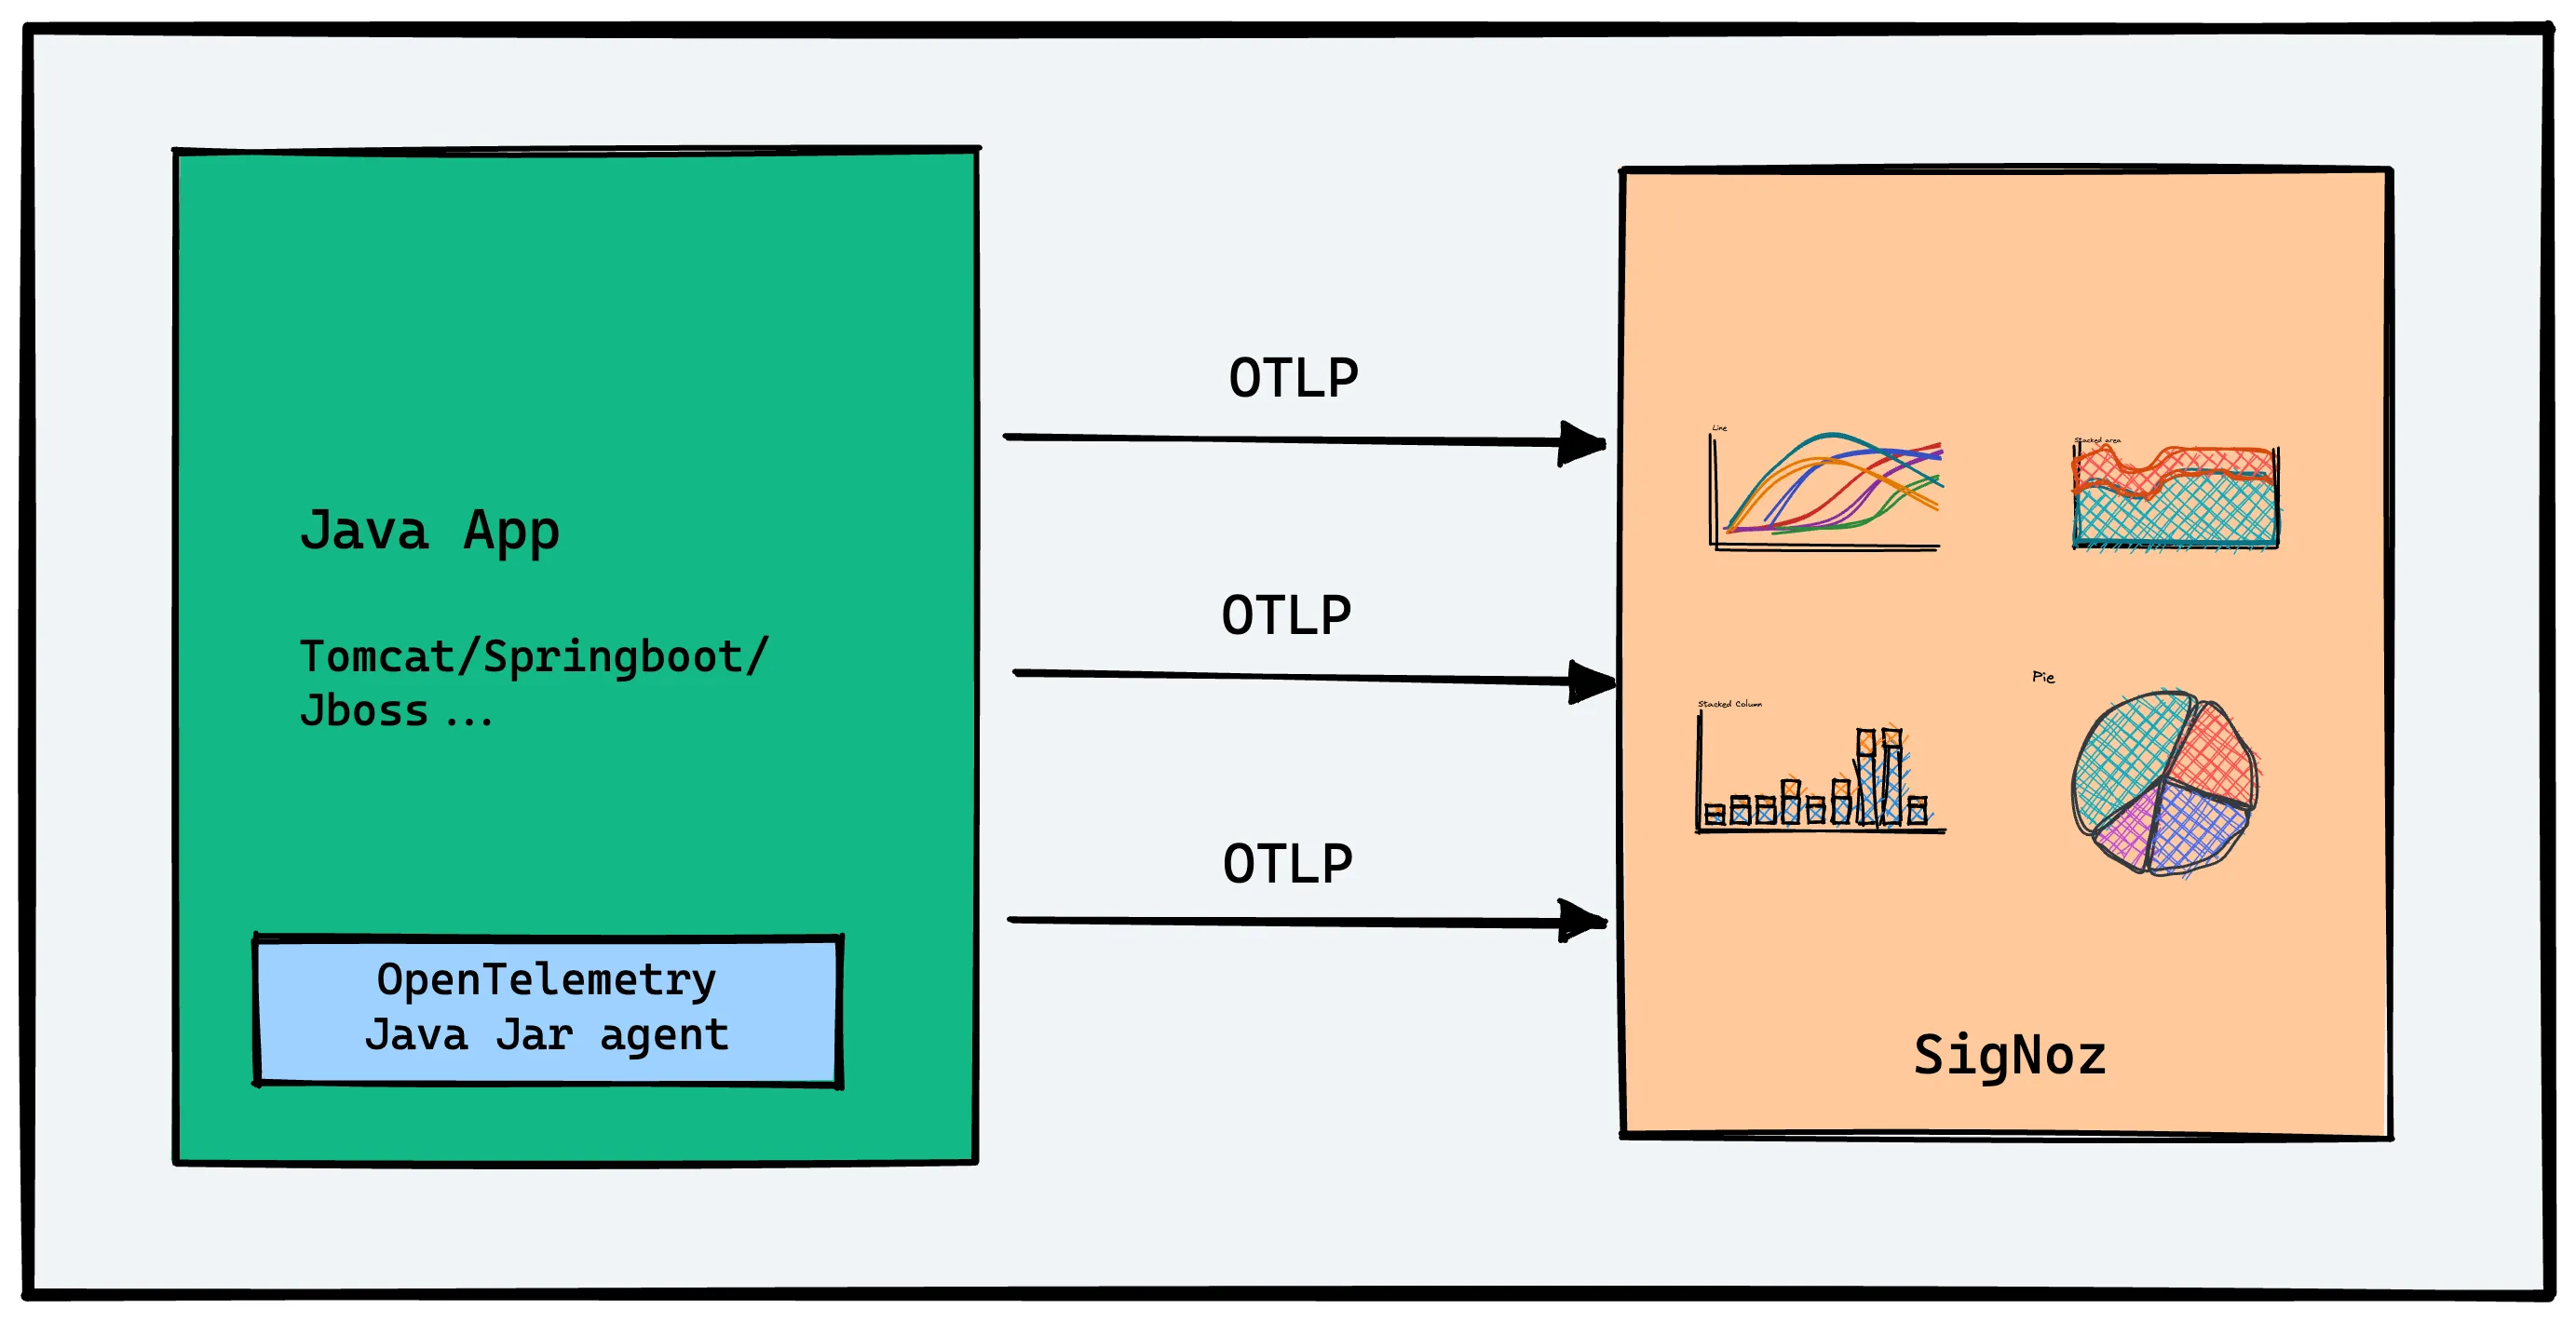
OpenTelemetry helps generate and collect telemetry data from Spring Boot applications which can then be sent to SigNoz for storage, visualization, and analysis.
OpenTelemetry does not provide storage and visualization layer for the collected data. The advantage of using OpenTelemetry is that it can export the collected data in many different formats. So you're free to choose your telemetry backend.
In this tutorial, we will use SigNoz, an OpenTelemetry-native APM as the backend and visualization layer.
Steps to integrate OpenTelemetry with your Spring Boot application.
- Setting up SigNoz
- Setting up Sample Spring Boot Application
- Downloading OpenTelemetry Java Agent Jar
- Running the application with Java Agent Jar
- Monitoring application with SigNoz
Why should you use OpenTelemetry with Spring Boot?
Here are the key benefits:
- Standardization: OpenTelemetry offers a vendor-neutral approach, allowing you to switch between different observability backends easily.
- Comprehensive visibility: It provides a holistic view of your application's performance across distributed systems.
- Easy integration: OpenTelemetry seamlessly integrates with Spring Boot, requiring minimal configuration.
- Extensibility: You can easily extend OpenTelemetry to capture custom metrics and traces specific to your business needs.
Compared to other observability solutions like Micrometer, OpenTelemetry offers broader language support and a more comprehensive approach to telemetry data collection. While Micrometer focuses primarily on metrics, OpenTelemetry provides a unified solution for traces, metrics, and logs.
Prerequisites
- SigNoz Cloud account
- Java 8 or Higher (Download here)
Step 1: Setting up SigNoz
You need a backend to which you can send the collected data for monitoring and visualization. SigNoz is an OpenTelemetry-native APM that is well-suited for visualizing OpenTelemetry data.
SigNoz cloud is the easiest way to run SigNoz. Sign up for a free account and get 30 days of unlimited access to all features.
You can also install and self-host SigNoz yourself since it is open-source. With 19,000+ GitHub stars, open-source SigNoz is loved by developers. Find the instructions to self-host SigNoz.
Step 2: Setting up Sample Spring Boot application
For this tutorial, we will use the popular Spring PetClinic application and integrate it with OpenTelemetry.
The Spring PetClinic application is a well-known sample application used to demonstrate the capabilities of the Spring Framework in Java. It is a web application that uses Spring MVC (Model-View-Controller) to handle web requests, manage controllers, and render views. You can read more about it here.
Git clone the repository and go to the root folder:
git clone https://github.com/SigNoz/spring-petclinic.git
cd spring-petclinic
Run the application using the following commands:
./mvnw package
java -jar target/*.jar
If your application runs successfully, you will be able to access the application UI here: http://localhost:8090/
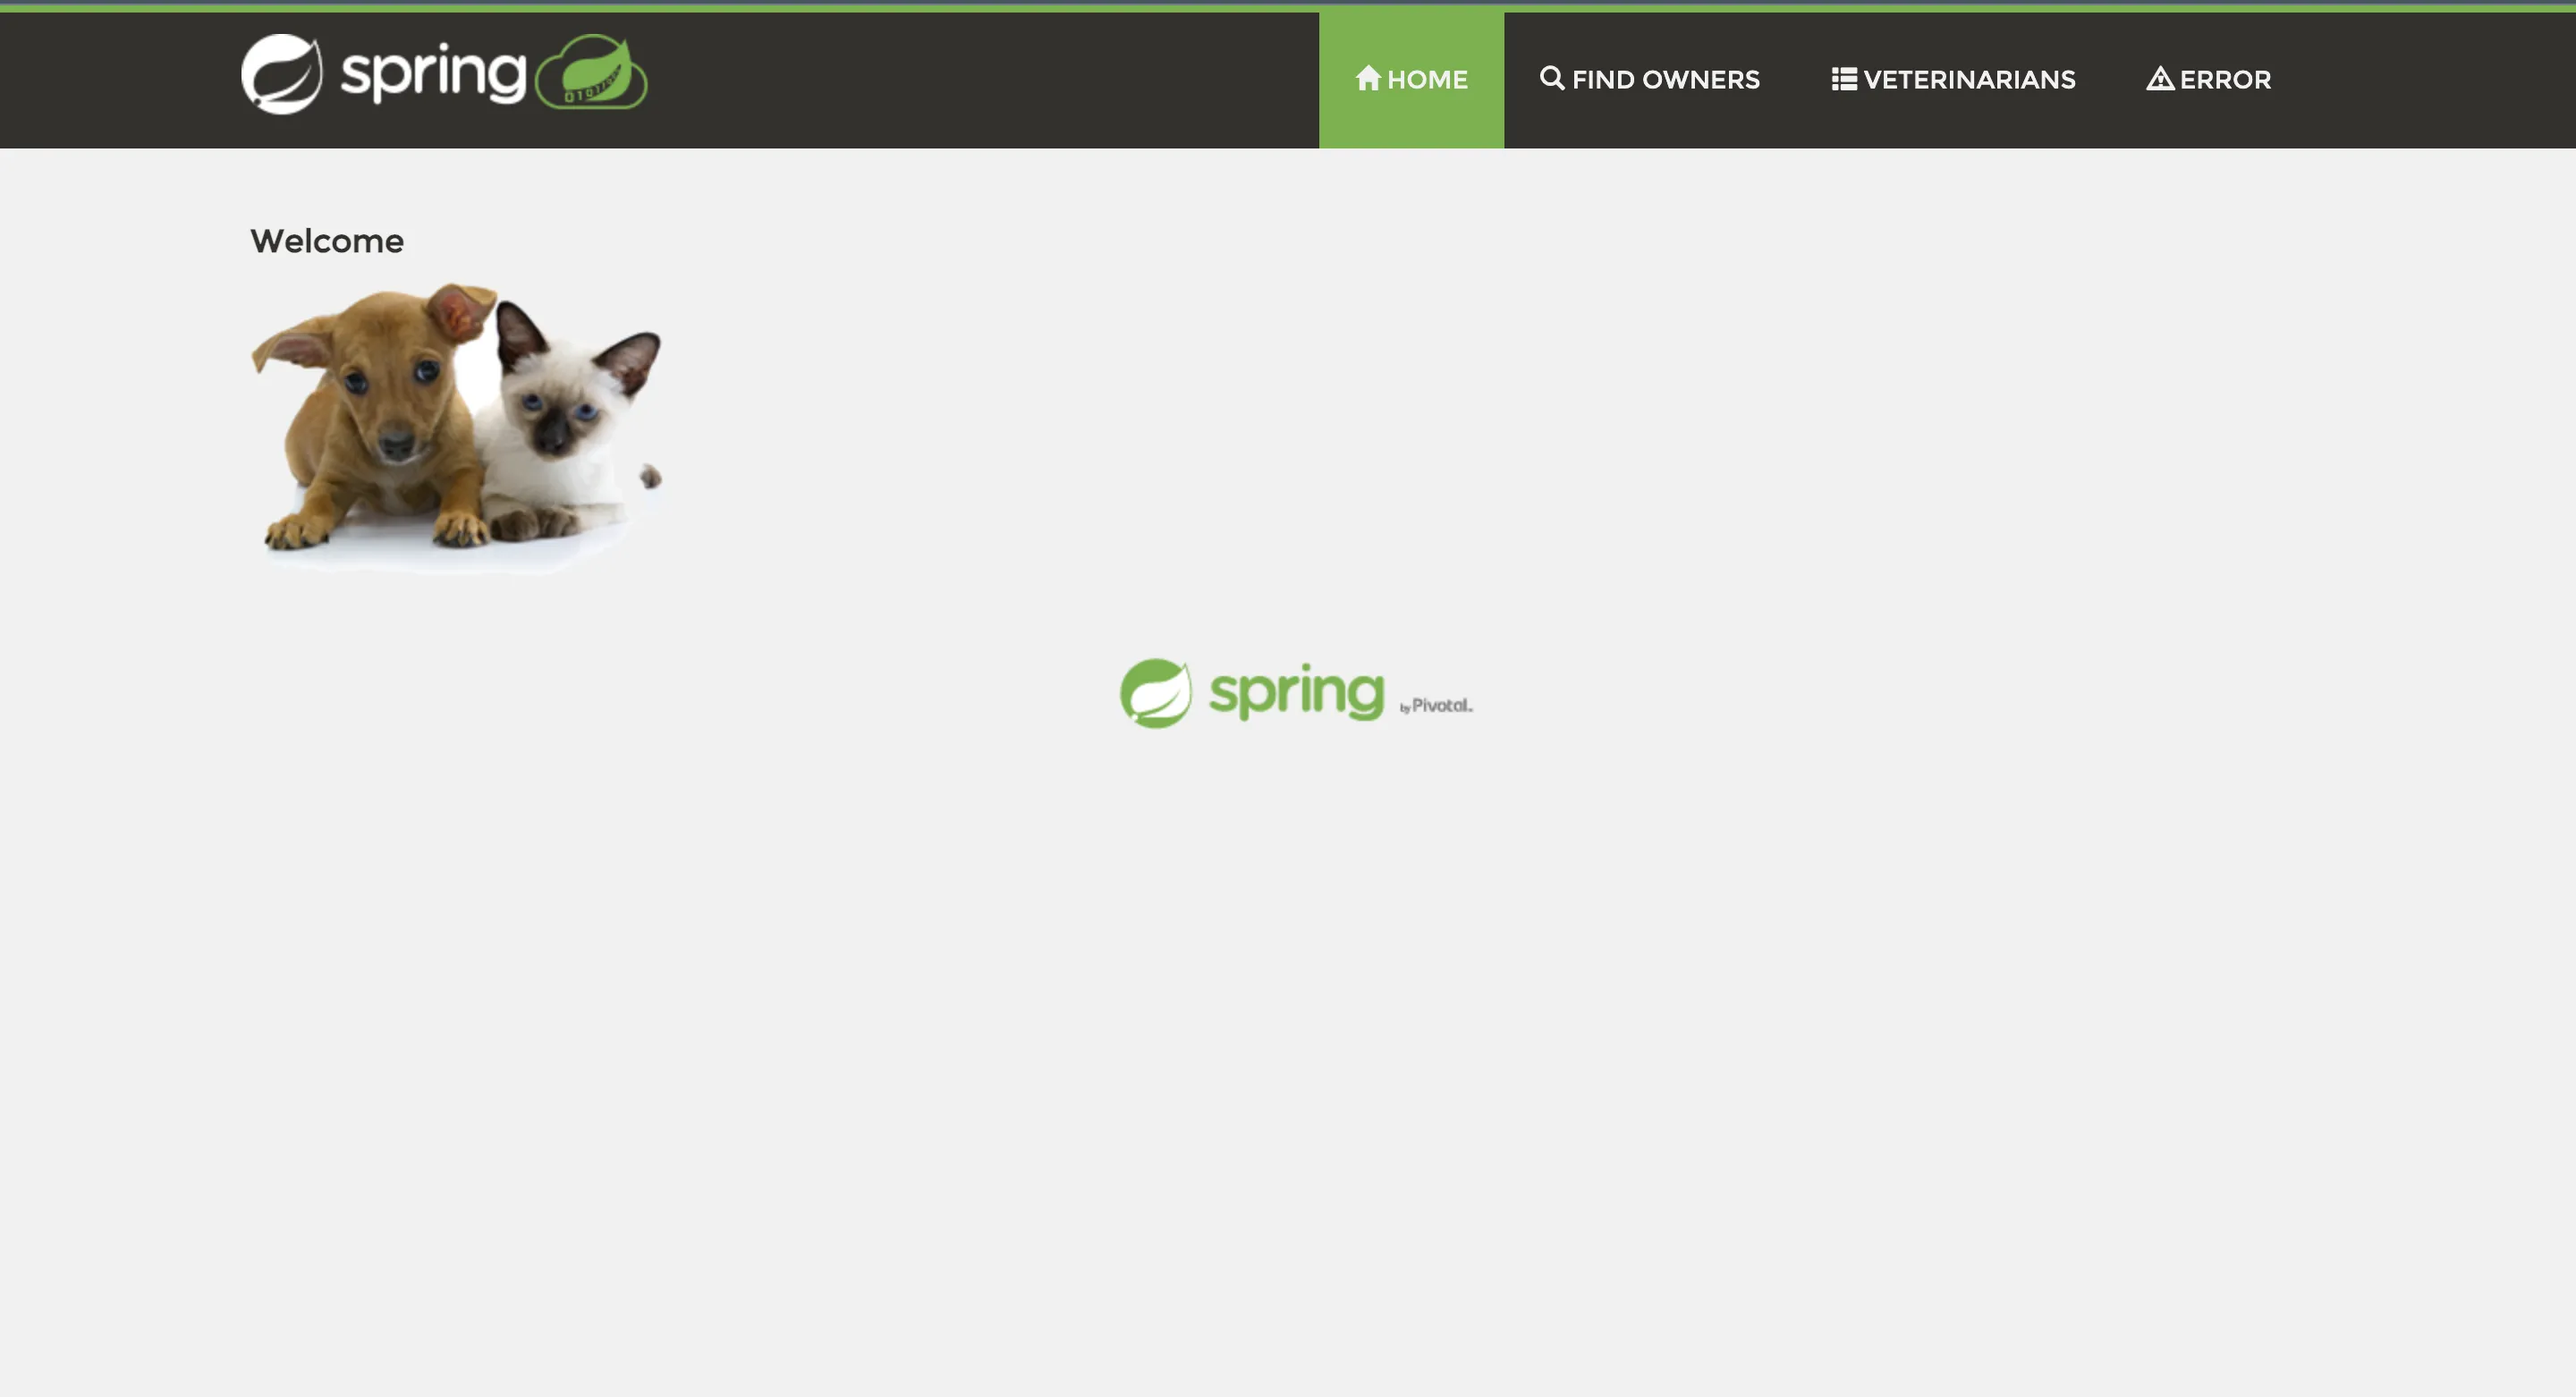
Once you ensure that your application runs fine, stop it with ctrl + c on mac, as we will be launching the application with the Java agent downloaded from OpenTelemetry.
Step 3: Downloading OpenTelemetry Java Agent JAR
Download the latest Java agent JAR. You will need the path of this file, so note it down somewhere. You can also use the terminal to get this file using the following command:
wget https://github.com/open-telemetry/opentelemetry-java-instrumentation/releases/latest/download/opentelemetry-javaagent.jar
Note: You will need the path to this file while running your application. A good practice is to create a folder named 'java-agent' inside your project and save the agent there.
OpenTelemetry Java agent JAR can be attached to any Java 8+ application. The agent JAR can detect a number of popular libraries and frameworks and instrument it right out of the box. You don't need to add any code for that.
The auto-instrumentation takes care of generating traces and logs from the application. SigNoz uses the trace data to report key application metrics like p99 latency, request rates, and error rates with out-of-box charts and visualization.
You will also be able to capture logs with it and send it to SigNoz.
Step 4: Running the application with relevant environment variables
You need to run your Spring Boot application along with the instrumentation agent. The below command will auto-instrument your application for traces and logs.
OTEL_RESOURCE_ATTRIBUTES=service.name=<app_name> \
OTEL_EXPORTER_OTLP_HEADERS="signoz-ingestion-key=SIGNOZ_INGESTION_KEY" \
OTEL_EXPORTER_OTLP_ENDPOINT=https://ingest.{region}.signoz.cloud:443 \
OTEL_LOGS_EXPORTER=otlp \
java -javaagent:/path/opentelemetry-javaagent.jar -jar target/*.jar
You can get SigNoz ingestion key and region from your SigNoz cloud account in Settings --> Ingestion Settings.
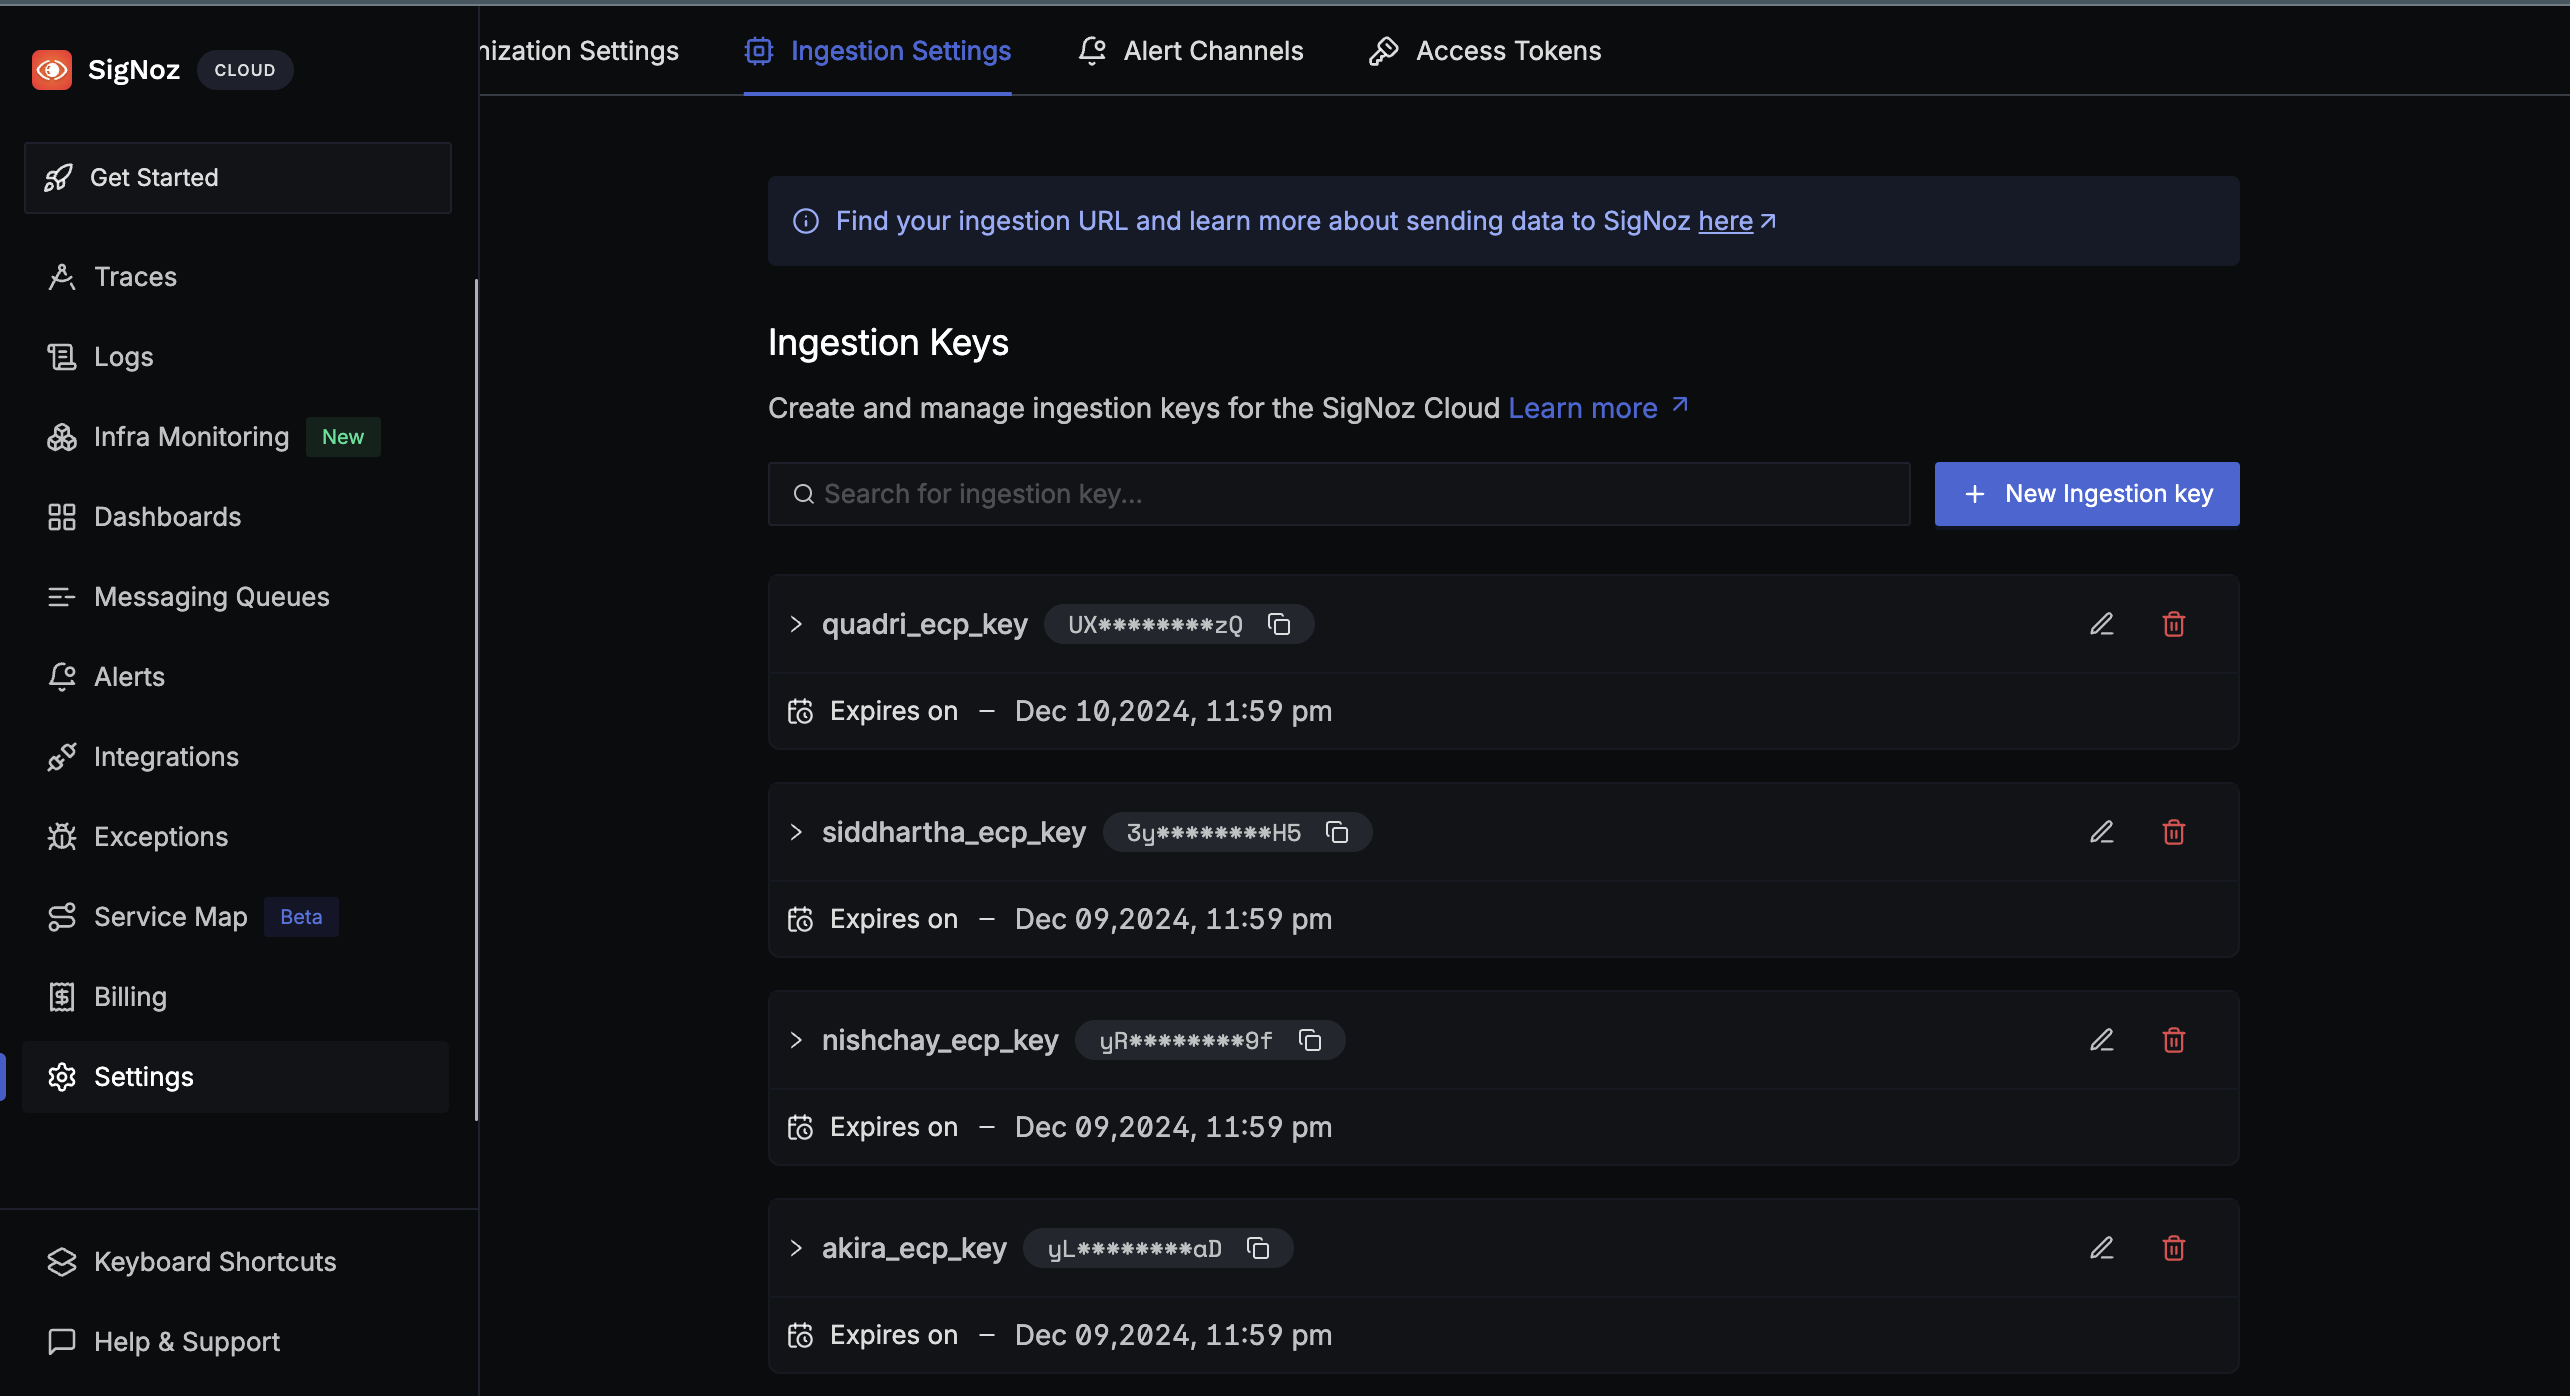
Your final command might look like this:
OTEL_LOGS_EXPORTER=otlp \
OTEL_EXPORTER_OTLP_ENDPOINT=https://ingest.in.signoz.cloud:443 \
OTEL_EXPORTER_OTLP_HEADERS="signoz-ingestion-key=7XXXXX7-6XXxX-45ff-9XX1-3bXxXXf9cdc3" \
OTEL_RESOURCE_ATTRIBUTES=service.name=sample_java_app \
java -javaagent:/java-agent/opentelemetry-javaagent.jar -jar  target/*.jar
You would need to use the environment variables from your SigNoz cloud account.
Step 5: Monitoring your Spring Boot Application in SigNoz
Check out the Spring Pet Clinic app at: http://localhost:8090/ and play around with it to generate some load. You can try refreshing the endpoint multiple times to generate load. Now you open the Services tab of SigNoz dashboard to see your Spring Boot Application being monitored.
When you sign up, you will get an onboarding flow for Java application. You can follow it to instrument your own Spring Boot application too.
Below you can find your Spring Boot application in the list of applications being monitored.

Spring Boot application monitoring in SigNoz with p99 latency, error rate, and ops per second
Application Metrics and Traces of the Spring Boot application
SigNoz makes it easy to visualize metrics and traces captured through OpenTelemetry instrumentation.
SigNoz comes with out of box RED metrics charts and visualization based on your trace data. You get following out-of-box charts for your Spring Boot application:
- Rate of requests
- Error rate of requests
- Duration taken by requests
- Apdex
- Top endpoints in your application
And you can monitor all of this without any code change, just by integrating your Spring Boot application with OpenTelemetry Java agent JAR.
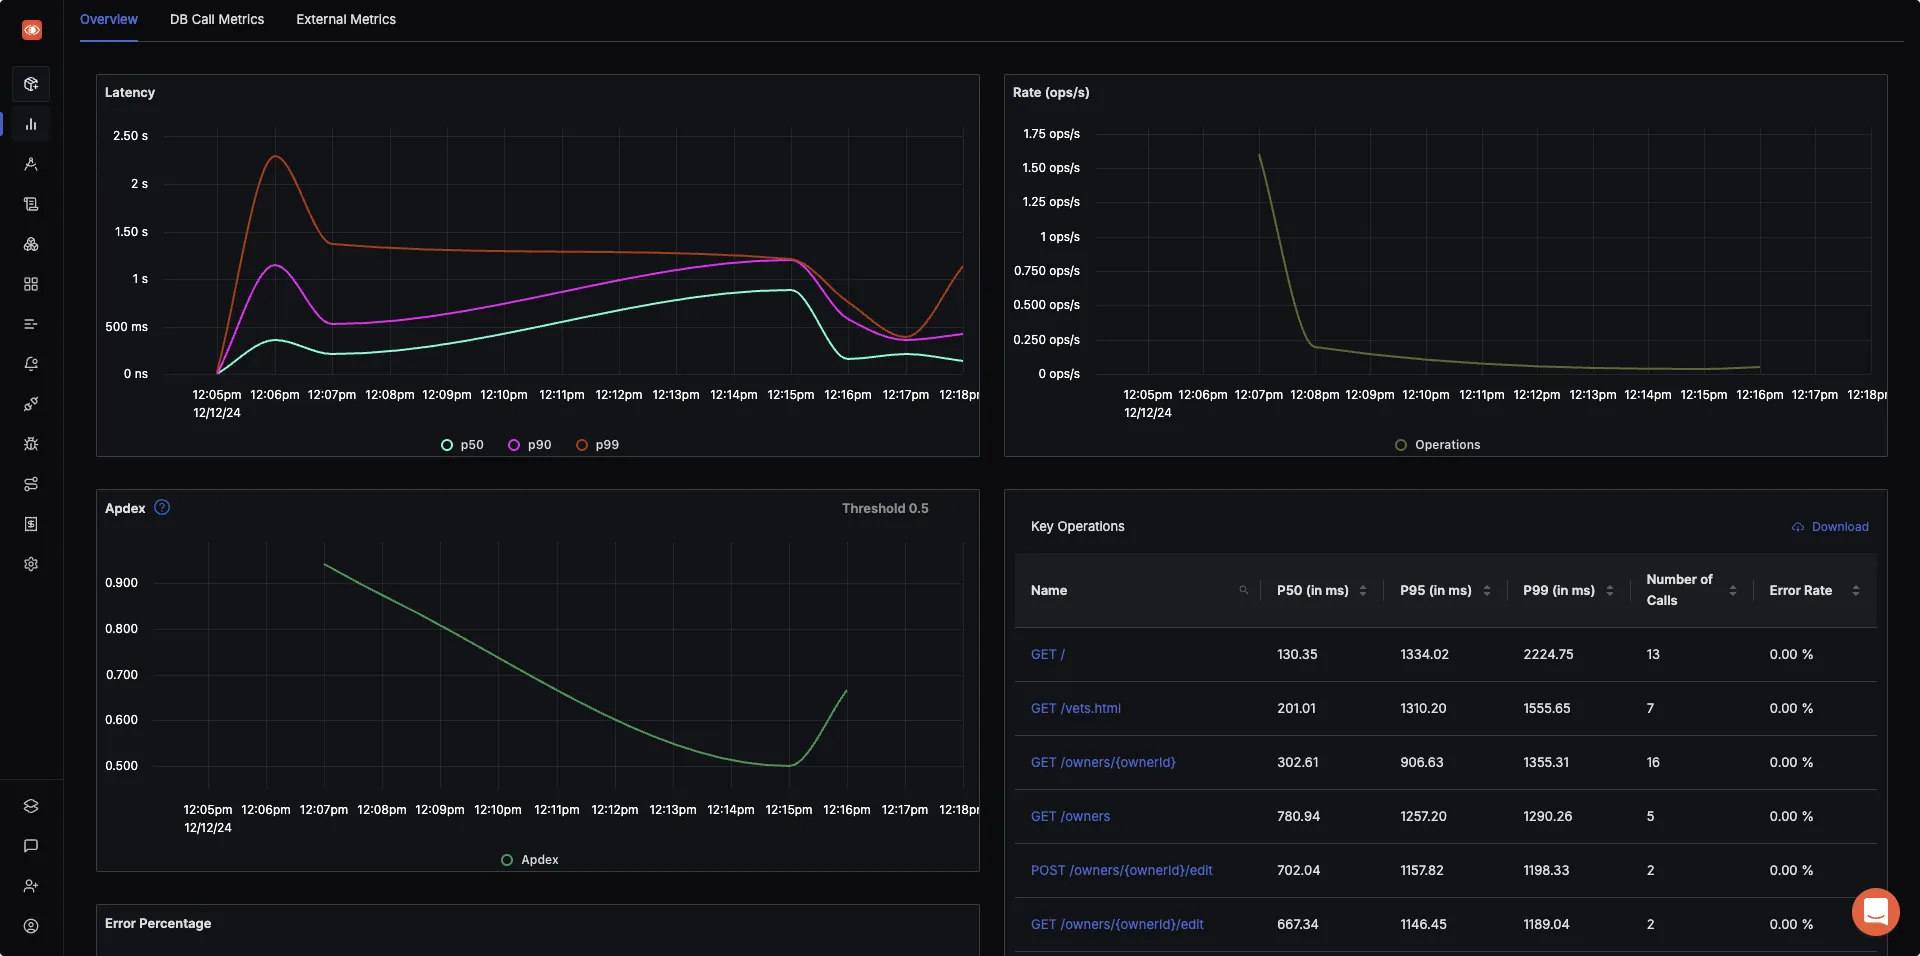
Measure things like application latency, requests per sec, error percentage, apdex and see your top endpoints with SigNoz.
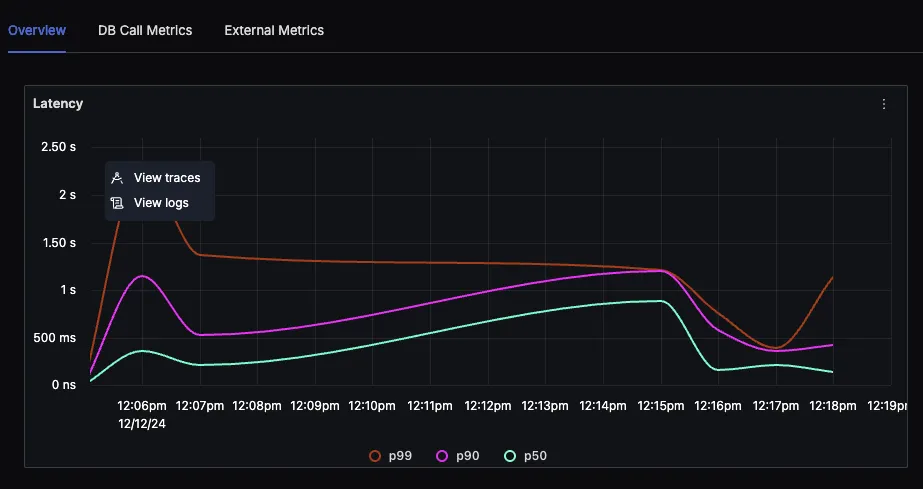
The best thing about OpenTelemetry is correlated signals for getting better context while troubleshooting. From application metrics, you can jump directly to logs and traces for troubleshooting.
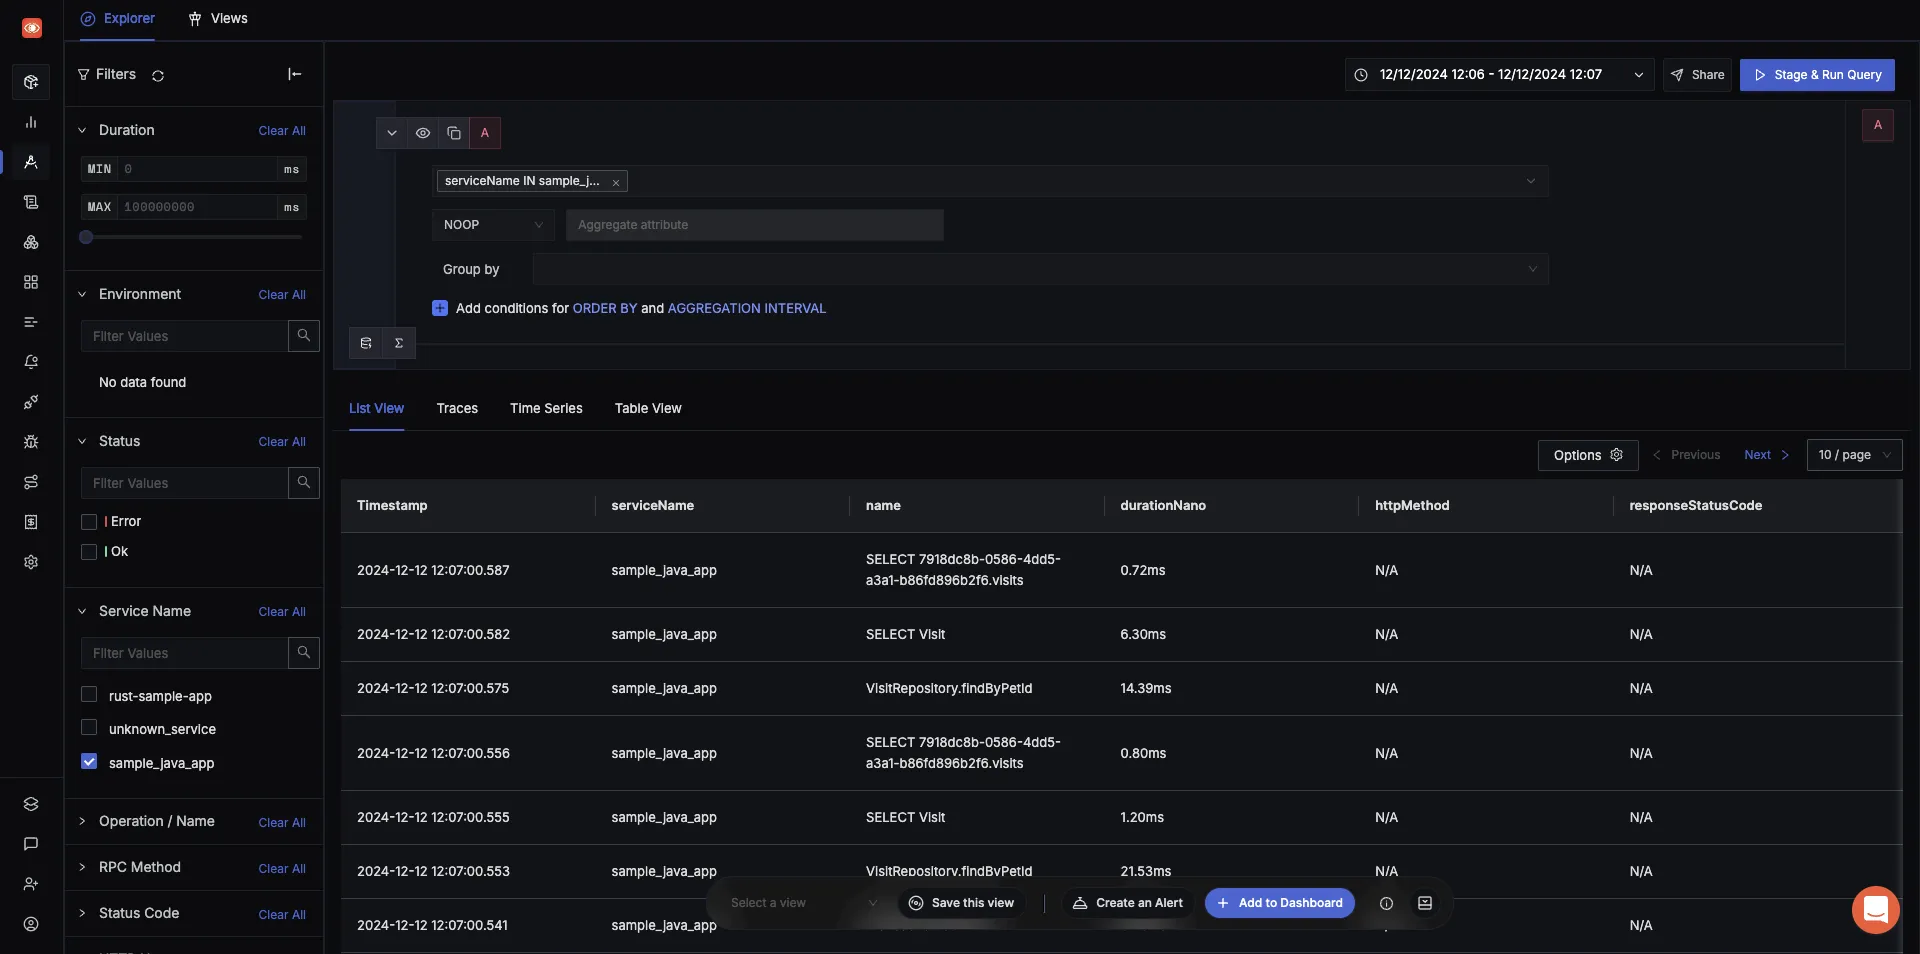
SigNoz provides a trace explorer where you can analyze spans in great detail with the help of quick filters and an advanced query builder.
You can also visualize your trace data with flamegraphs and Gantt charts to see the flow of requests. This comes in very handy while debugging performance related issues.
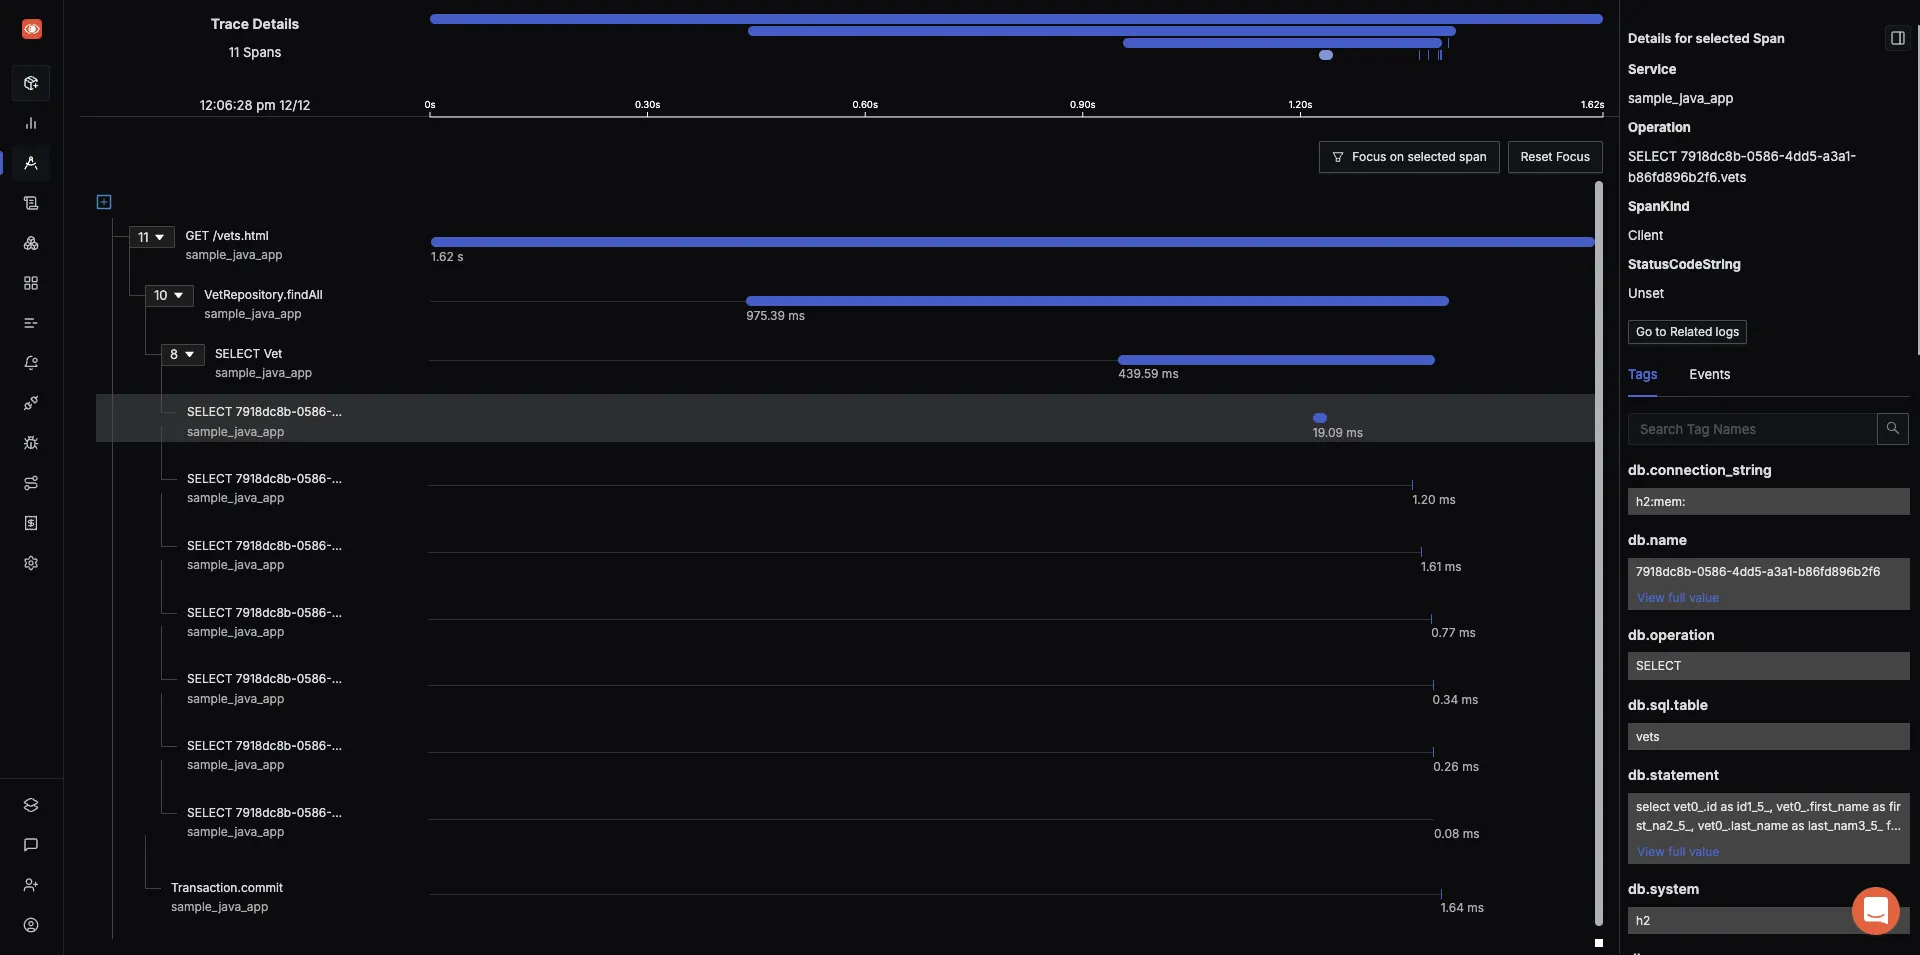
See how requests flow through your Spring Boot application with flamegraphs and Gantt charts in SigNoz dashboard
Spring Boot application logs with OpenTelemetry Java agent JAR
The OpenTelemetry Java agent JAR also captures logs from Java applications. You can also configure popular Java logging libraries like Log4j2 and logback to work with OpenTelemetry Java agent JAR.
For getting logs, you need an environment variable OTEL_LOGS_EXPORTER to your run command.
OTEL_LOGS_EXPORTER=otlp \
OTEL_EXPORTER_OTLP_ENDPOINT=https://ingest.in.signoz.cloud:443 \
OTEL_EXPORTER_OTLP_HEADERS="signoz-ingestion-key=7XXXXX7-6XXxX-45ff-9XX1-3bXxXXf9cdc3" \
OTEL_RESOURCE_ATTRIBUTES=service.name=sample_java_app \
java -javaagent:/java-agent/opentelemetry-javaagent.jar -jar  target/*.jar
Since we already added this to our run command, you can see logs from your Spring Boot application in the Logs explorer by using a filter for service.name.
You can go to the logs tab of SigNoz and apply filter for your service.name to see logs from your Spring Boot application.
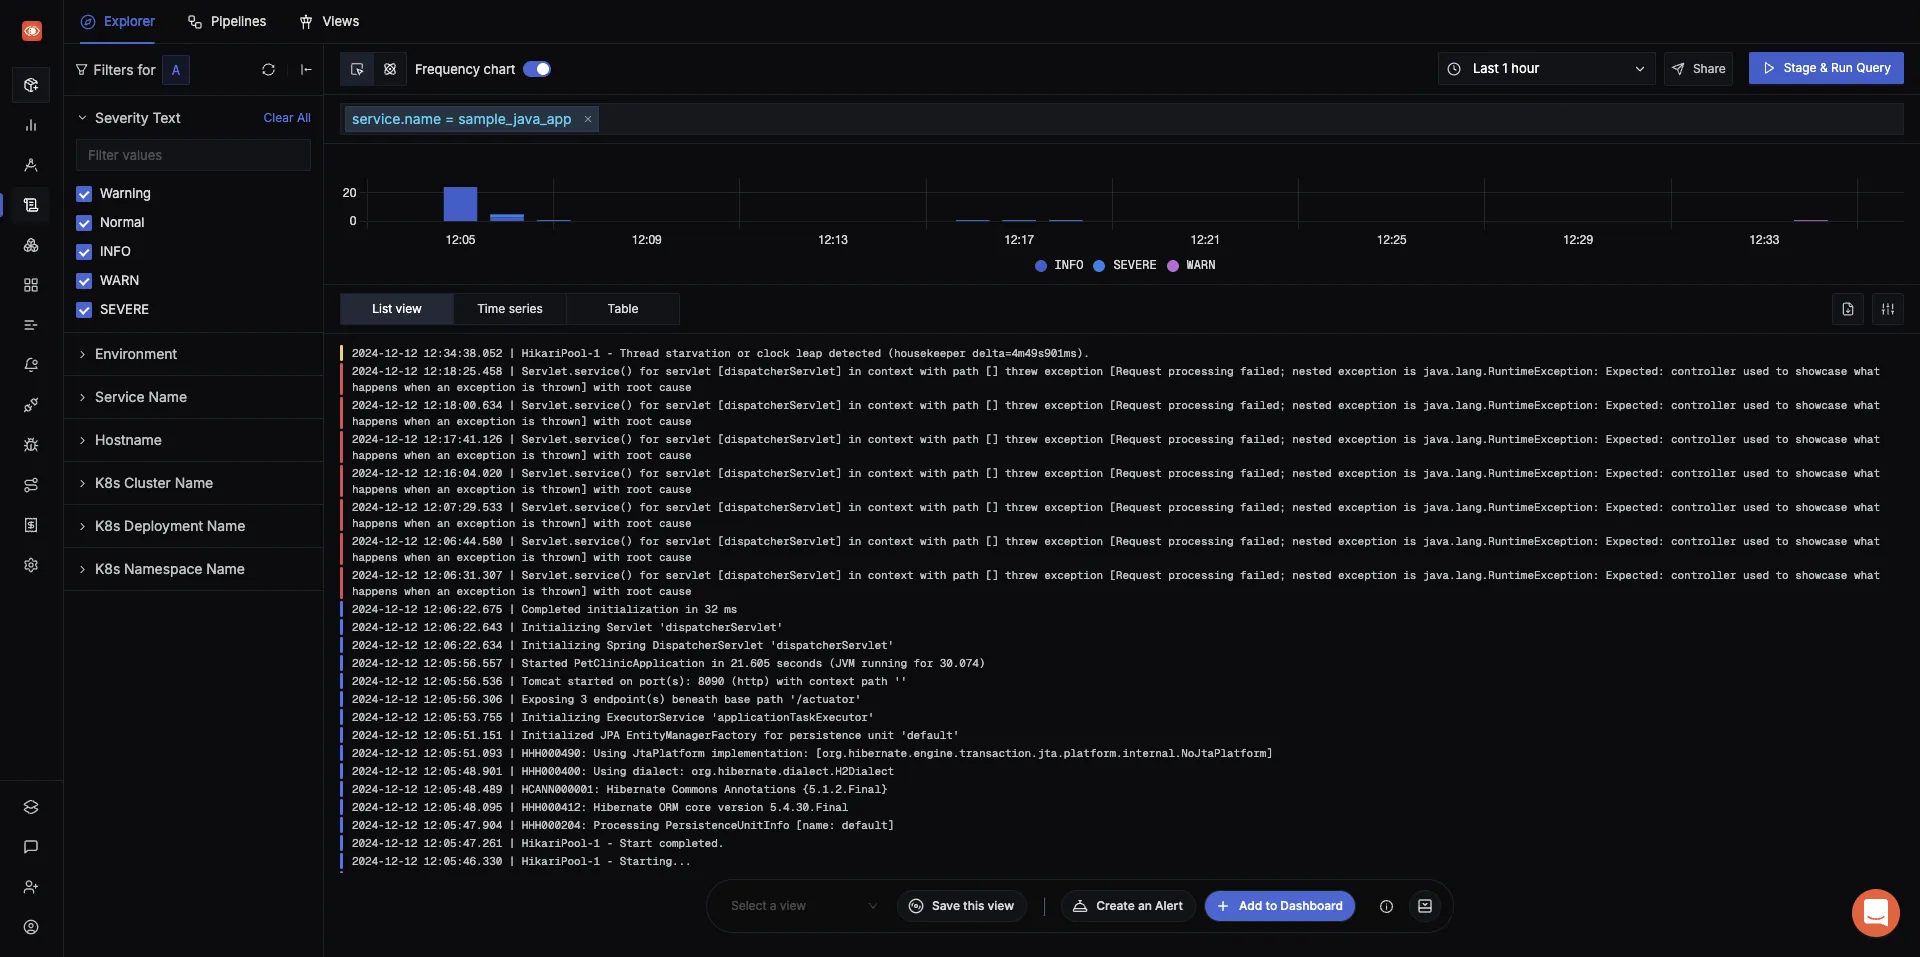
The logs explorer of SigNoz provides a lot of features like quick filters, query builder, and different visualizations.
Choosing Between Agent and Starter
When implementing OpenTelemetry in Spring Boot, you have two main options: using the OpenTelemetry Java agent or the OpenTelemetry Spring Boot starter.
The OpenTelemetry Java agent is the default choice for instrumenting Spring Boot applications:
- Provides more out-of-the-box instrumentation compared to the OpenTelemetry starter
- Uses bytecode instrumentation for automatic monitoring
The OpenTelemetry Spring Boot starter is recommended when:
- Building Spring Boot Native image applications where the OpenTelemetry Java agent doesn't work.
- The startup overhead of the OpenTelemetry Java agent exceeds your requirements.
- You're already using another Java monitoring agent that may conflict with the OpenTelemetry Java agent.
- You need to configure OpenTelemetry using Spring Boot configuration files which doesn't work with the Java agent.
While the default choice of instrumentation is the OpenTelemetry Java agent, you can use the starter in case it fits your requirement. You can read more about it here
Advanced OpenTelemetry Techniques for Spring Boot
For more advanced use cases, consider these techniques:
- Implement custom instrumentations for Spring Boot components:
@Aspect
@Component
public class CustomInstrumentation {

    private final Tracer tracer;

    public CustomInstrumentation(OpenTelemetry openTelemetry) {
        this.tracer = openTelemetry.getTracer("com.example.CustomInstrumentation");
    }

    @Around("execution(* com.example.service.*.*(..))")
    public Object traceMethod(ProceedingJoinPoint joinPoint) throws Throwable {
        Span span = tracer.spanBuilder(joinPoint.getSignature().getName()).startSpan();
        try (Scope scope = span.makeCurrent()) {
            return joinPoint.proceed();
        } catch (Throwable t) {
            span.recordException(t);
            throw t;
        } finally {
            span.end();
        }
    }
}
- Use OpenTelemetry SDK for fine-grained control:
@Configuration
public class OpenTelemetryConfig {

    @Bean
    public OpenTelemetry openTelemetry() {
        Resource resource = Resource.getDefault()
            .merge(Resource.create(Attributes.of(ResourceAttributes.SERVICE_NAME, "your-service-name")));

        SdkTracerProvider sdkTracerProvider = SdkTracerProvider.builder()
            .setResource(resource)
            .addSpanProcessor(BatchSpanProcessor.builder(OtlpGrpcSpanExporter.builder().build()).build())
            .setSampler(Sampler.parentBased(Sampler.traceIdRatioBased(0.1)))
            .build();

        SdkMeterProvider sdkMeterProvider = SdkMeterProvider.builder()
            .setResource(resource)
            .registerMetricReader(PeriodicMetricReader.builder(OtlpGrpcMetricExporter.builder().build()).build())
            .build();

        return OpenTelemetrySdk.builder()
            .setTracerProvider(sdkTracerProvider)
            .setMeterProvider(sdkMeterProvider)
            .buildAndRegisterGlobal();
    }
}
- Handle OpenTelemetry in Spring Boot native images:
- Ensure all OpenTelemetry classes are included in the native image
- Use reflection configuration to allow access to OpenTelemetry classes
- Test thoroughly to ensure all instrumentations work correctly in the native image
- Performance tuning and optimization strategies:
- Use sampling to reduce the volume of traces in high-traffic systems
- Implement batching for trace and metric exports to reduce network overhead
- Monitor the impact of OpenTelemetry on your application's performance and adjust accordingly
Troubleshooting Common Issues
When implementing OpenTelemetry in Spring Boot, you may encounter some challenges. Here are solutions to common issues:
- Instrumentation conflicts:
- Ensure you're using compatible versions of OpenTelemetry and Spring Boot
- Check for conflicting instrumentations and disable them if necessary
- Data export problems:
- Verify network connectivity to your backend (e.g., SigNoz, Jaeger)
- Check exporter configuration, including endpoints and authentication
- OpenTelemetry version incompatibilities:
- Keep all OpenTelemetry dependencies on the same version
- Follow the OpenTelemetry versioning guidelines when upgrading
- Trace context propagation issues:
- Ensure proper configuration of context propagation between services
- Use OpenTelemetry's built-in propagators (e.g., W3CTraceContextPropagator)
Conclusion
OpenTelemetry makes it very convenient to instrument your Spring Boot application and collect telemetry data like logs, metrics, and traces. You can then use an open-source APM tool like SigNoz to analyze the performance of your app. With OpenTelemetry and SigNoz, you can implement full-stack observability for your Spring Boot applications.
If your Spring Boot application is based on microservices architecture, check out this tutorial 👇
Implementing Distributed Tracing in a Java application
FAQs
How does OpenTelemetry differ from Spring Boot Actuator?
OpenTelemetry offers a more comprehensive observability solution, including distributed tracing and standardized telemetry data collection. Spring Boot Actuator focuses primarily on application health monitoring and basic metrics. OpenTelemetry provides greater flexibility and interoperability across different observability backends.
Can I use OpenTelemetry with older versions of Spring Boot?
Yes, OpenTelemetry can be used with older versions of Spring Boot. However, you may need to adjust your configuration and dependencies based on the specific Spring Boot version. It's recommended to use the latest compatible versions of both OpenTelemetry and Spring Boot for the best experience.
What's the performance impact of using OpenTelemetry in Spring Boot?
The performance impact of OpenTelemetry is generally minimal, especially when using sampling strategies. However, the exact impact depends on your application's complexity and the volume of telemetry data collected. Monitor your application's performance after implementing OpenTelemetry and adjust configurations if needed.
How do I migrate from Micrometer to OpenTelemetry in my Spring Boot app?
To migrate from Micrometer to OpenTelemetry:
- Add OpenTelemetry dependencies to your project
- Replace Micrometer configurations with OpenTelemetry equivalents
- Update custom metrics to use OpenTelemetry's API
- Configure OpenTelemetry exporters for your preferred backend
- Gradually phase out Micrometer dependencies and configurations
What is OpenTelemetry and why is it important for Spring Boot applications?
OpenTelemetry is a set of APIs, SDKs, and tools for generating, collecting, and managing telemetry data (logs, metrics, and traces). It's important for Spring Boot applications because it provides standardized observability, comprehensive visibility across distributed systems, easy integration, and extensibility for custom metrics and traces.
How does OpenTelemetry differ from other observability solutions like Micrometer?
OpenTelemetry offers broader language support and a more comprehensive approach to telemetry data collection. While Micrometer focuses primarily on metrics, OpenTelemetry provides a unified solution for traces, metrics, and logs. It also allows for easier switching between different observability backends.
What are the steps to integrate OpenTelemetry with a Spring Boot application?
The main steps are:
- Set up a compatible backend like SigNoz
- Download the OpenTelemetry Java Agent JAR
- Run the Spring Boot application with the Java Agent and necessary environment variables
- Configure any additional settings for logs or custom instrumentation
- Monitor the application using the chosen backend (e.g., SigNoz dashboard)
Can OpenTelemetry collect logs from Spring Boot applications?
Yes, OpenTelemetry can collect logs from Spring Boot applications. The OpenTelemetry Java agent JAR captures logs automatically, and you can configure popular Java logging libraries like Log4j2 and logback to work with it. You need to add the OTEL_LOGS_EXPORTER=otlp environment variable when running your application.
What's the difference between using the OpenTelemetry Java agent and the OpenTelemetry Spring Boot starter?
The OpenTelemetry Java agent provides easy setup with minimal code changes and automatic instrumentation for many libraries. However, it offers less flexibility for custom instrumentation. The OpenTelemetry Spring Boot starter requires more configuration but allows for more control over instrumentation and easier custom implementations.
How can I implement custom instrumentations in my Spring Boot application with OpenTelemetry?
You can implement custom instrumentations using aspect-oriented programming (AOP) in Spring Boot. Create an aspect that uses the OpenTelemetry API to create and manage spans for specific method executions. This allows you to add custom metrics and traces to your application's telemetry data.
What are some advanced techniques for using OpenTelemetry in Spring Boot?
Advanced techniques include:
- Implementing custom instrumentations for specific Spring Boot components
- Using the OpenTelemetry SDK for fine-grained control over tracers, meters, and exporters
- Handling OpenTelemetry in Spring Boot native images
- Implementing performance tuning and optimization strategies like sampling and batching
How do I troubleshoot common issues when implementing OpenTelemetry in Spring Boot?
Common troubleshooting steps include:
- Ensuring compatibility between OpenTelemetry and Spring Boot versions
- Checking for and resolving instrumentation conflicts
- Verifying network connectivity and exporter configurations
- Keeping all OpenTelemetry dependencies on the same version
- Properly configuring context propagation between services
Can OpenTelemetry be used with older versions of Spring Boot?
Yes, OpenTelemetry can be used with older versions of Spring Boot, but you may need to adjust configurations and dependencies. It's recommended to use the latest compatible versions of both OpenTelemetry and Spring Boot for the best experience and support.
What's the performance impact of using OpenTelemetry in a Spring Boot application?
The performance impact of OpenTelemetry is generally minimal, especially when using sampling strategies. However, the exact impact depends on your application's complexity and the volume of telemetry data collected. It's important to monitor your application's performance after implementing OpenTelemetry and adjust configurations if needed.
Further Reading
OpenTelemetry Collector Complete Guide


