Apache logs are crucial for understanding and managing the behavior of your web server. They provide detailed records of server activity, capturing essential data such as client IP addresses, request methods, requested URLs, response status codes, user agents, and timestamps. This information is invaluable for troubleshooting issues, performing security analysis, and optimizing performance, making Apache logs an essential component of server management.
This guide aims to provide a thorough understanding of Apache logs, covering everything from their basic structure to advanced analysis and automation techniques using tools like SigNoz.
Understanding Apache Logs
Understanding Apache logs is essential for effectively managing and maintaining an Apache web server. These logs provide valuable insights into server operations, performance, and security. In this section, you will dive into the world of Apache logs.
What are Apache logs?
Apache logs are records of various events and activities that occur on an Apache web server. They capture information about requests made to the server, errors encountered, and other server operations. These logs are invaluable for system administrators and developers for monitoring server health, troubleshooting problems, and ensuring optimal performance and security.
Types of Apache Logs
Apache logs come in different types, each serving a specific purpose. The two primary types of logs are access logs and error logs.
- Access Logs
Access logs record all requests made to the server. They typically include information such as the IP address of the client, request time, requested URL, HTTP status code, and user agent.
Example:
127.0.0.1 - frank [18/Jul/2024:13:55:36 -0700] "GET /apache_pb.gif HTTP/1.0" 200 2326Explanation of Components:
- 127.0.0.1: The IP address of the client making the request.
- frank: The user identifier for the client, typically provided by HTTP authentication.
- [18/Jul/2024:13:55:36 -0700]: The date and time when the request was made, followed by the time zone offset.
- "GET /apache_pb.gif HTTP/1.0": The request line from the client. This includes:
- GET: The HTTP method used.
- /apache_pb.gif: The requested URL.
- HTTP/1.0: The HTTP protocol version used.
- 200: The HTTP status code returned by the server, indicating the result of the request (200 means OK).
- 2326: The size of the response in bytes, excluding headers.
- Error Logs
Error logs capture issues that the server encounters while processing requests. This includes errors such as file not found, server misconfigurations, and more.
Example:
[Fri Jul 14 14:32:14.873076 2024] [core:notice] [pid 1234] AH00094: Command line: '/usr/sbin/httpd -D FOREGROUND'Explanation of Components:
- [Fri Jul 14 14:32:14.873076 2024]: The date and time when the error occurred, down to microseconds.
- [core]: The module and the severity level of the message.
- core: The module where the error or notice originated.
- notice: The severity level of the message, indicating its importance.
- [pid 1234]: The process ID of the server process that encountered the issue.
- AH00094: The unique identifier for the specific error or notice.
- Command line: '/usr/sbin/httpd -D FOREGROUND': The command line that was used to start the server.
Common Use Cases for Log Analysis
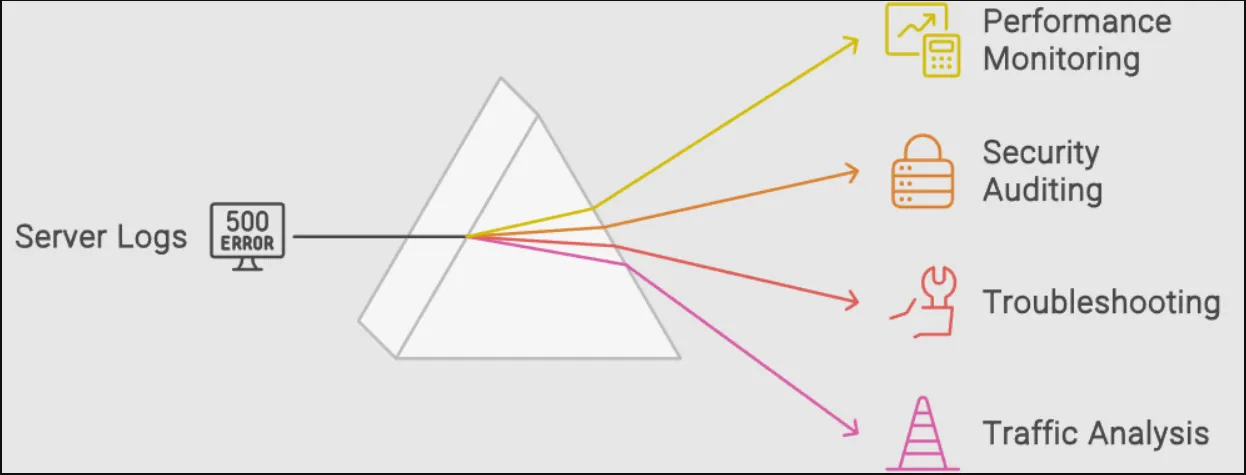
Analyzing Apache logs is essential for various aspects of web server management. Here are some common use cases for log analysis:
- Performance Monitoring: Analyze access logs to monitor server load, response times, and traffic patterns. This helps identify performance bottlenecks and optimize server configurations.
- Security Auditing: Review logs to detect unauthorized access attempts, suspicious activities, and potential security breaches. Error logs, in particular, can highlight attempts to exploit server vulnerabilities.
- Troubleshooting: Use error logs to diagnose and resolve issues such as server misconfigurations, missing files, or application errors. This aids in maintaining server reliability and uptime.
- Traffic Analysis: Analyze access logs by analyzing user behaviour, popular pages, and traffic sources. This information can be used to improve user experience and strategic planning.
Configuring Apache Logging
Configuring Apache logging is crucial for ensuring that log data is properly captured and stored for analysis. This section covers default log locations on different operating systems, changing the default log location, and configuring log file paths and names in the httpd.conf or apache2.conf file.
Default Log Locations
Knowing the default log locations helps in quickly accessing the logs for initial setup and troubleshooting. The default log locations vary between operating systems.
- Linux
- Access Logs:
/var/log/apache2/access.logor/var/log/httpd/access_log - Error Logs:
/var/log/apache2/error.logor/var/log/httpd/error_log
- Access Logs:
- Windows
- Access Logs:
C:\Program Files\Apache Group\Apache2\logs\access.log - Error Logs:
C:\Program Files\Apache Group\Apache2\logs\error.log
- Access Logs:
Changing the Default Apache Log Location
Changing the default log location can help organize logs better or direct them to a centralized logging system.
- Open the Apache configuration file (typically
httpd.conforapache2.conf). - Locate the
CustomLogdirective for access logs and theErrorLogdirective for error logs. - Modify the file paths as needed.
Example:
ErrorLog "/path/to/new/error.log"
CustomLog "/path/to/new/access.log" common
- ErrorLog: This directive specifies the file path where the error logs will be written. Changing it to
"/path/to/new/error.log"directs Apache to store error logs in the specified location. - CustomLog: This directive specifies the file path for access logs and the log format. The
"common"keyword indicates that the access log entries will be in the Common Log Format (CLF), a standardized format used for web server log files.
Configuring Log File Paths and Names in httpd.conf
Customizing log file paths and names in the httpd.conf file allows for better log management and clarity.
- Open the
httpd.conffile in a text editor. - Define the log file paths and names using the
ErrorLogandCustomLogdirectives.
Example configuration:
# Define the error log file
ErrorLog "/var/log/apache2/custom_error.log"

# Define the access log file with a custom log format
LogFormat "%h %l %u %t \"%r\" %>s %b" custom
CustomLog "/var/log/apache2/custom_access.log" custom
ErrorLog "/var/log/apache2/custom_error.log"
- ErrorLog: This directive specifies where the server should write error logs.
- "/var/log/apache2/custom_error.log": This path sets a custom location and name for the error log file. By specifying this path, the error logs will be written to
/var/log/apache2/custom_error.log.
LogFormat "%h %l %u %t "%r" %>s %b" custom
- LogFormat: This directive defines the format of log entries.
- "%h %l %u %t "%r" %>s %b": This format string specifies what data to include in the log entries.
- %h: Remote host (IP address)
- %l: Remote logname (usually)``
- %u: Remote user (if authenticated)
- %t: Time the request was received
- "%r": The request line from the client (e.g.,
GET / HTTP/1.0) - %>s: Status code sent to the client
- %b: Size of the response in bytes, excluding HTTP headers
- custom: This keyword assigns a name to this custom log format, which can be referenced later.
CustomLog "/var/log/apache2/custom_access.log" custom
- CustomLog: This directive specifies where the server should write access logs and what format to use.
- "/var/log/apache2/custom_access.log": This path sets a custom location and name for the access log file. By specifying this path, the access logs will be written to
/var/log/apache2/custom_access.log. - custom: This references the custom log format defined earlier.
Using Piped Logs
Piped logs provide a powerful way to manage log data by directing log entries through an external program, allowing for real-time processing and more flexible handling of log files.
Piped logs use an external program to handle log entries. This is useful for advanced logging requirements, such as real-time log analysis or integration with centralized logging systems.
To configure piped logs, use the pipe symbol (|) followed by the path to the external program in the ErrorLog and CustomLog directives.
Example configuration:
# Define piped error log
ErrorLog "|/usr/bin/rotatelogs /var/log/apache2/error_log.%Y-%m-%d 86400"

# Define piped access log with a custom log format
CustomLog "|/usr/bin/rotatelogs /var/log/apache2/access_log.%Y-%m-%d 86400" custom
- ErrorLog "|/usr/bin/rotatelogs /var/log/apache2/error_log.%Y-%m-%d 86400"
- This configuration uses
rotatelogs, a utility that manages log file rotation. - "|/usr/bin/rotatelogs": The pipe symbol (
|) directs the log output to therotatelogsprogram. - "/var/log/apache2/error_log.%Y-%m-%d": The log file name pattern includes the date, creating a new log file daily.
- 86400: The time in seconds (86400 seconds = 24 hours) to rotate the log file.
- This configuration uses
- CustomLog "|/usr/bin/rotatelogs /var/log/apache2/access_log.%Y-%m-%d 86400" custom
- This configuration similarly uses
rotatelogsfor the access log. - "|/usr/bin/rotatelogs": The pipe symbol (
|) directs the log output to therotatelogsprogram. - "/var/log/apache2/access_log.%Y-%m-%d": The log file name pattern includes the date, creating a new log file daily.
- custom: This references the previously defined custom log format.
- This configuration similarly uses
Log rotation and management with logrotate
To ensure Apache logs do not consume excessive disk space, integrating logrotate is essential. This utility automates the rotation, compression, and removal of old log files. Proper configuration of logrotate helps maintain manageable log file sizes while preserving necessary data for analysis and troubleshooting.
Configuring logrotate for Apache Logs:
Install
logrotate: Ensurelogrotateis installed on your system. It is typically pre-installed on most Linux distributions. If not, you can install it using the package manager:sudo yum install logrotateCreate a Logrotate Configuration File: Create a configuration file
/etc/logrotate/httpdfor Apache logs. This file will define how and when logs are rotated.Example Configuration:
/var/log/httpd/*.log { daily rotate 7 compress delaycompress missingok notifempty create 0640 root adm sharedscripts postrotate /etc/init.d/httpd reload > /dev/null endscript }- Explanation of Configuration Options:
- /var/log/httpd/*.log: Specifies the log files to be rotated.
- daily: Rotates the logs daily.
- rotate 7: Keeps seven days’ worth of old log files before deleting them.
- compress: Compresses the rotated log files to save space.
- delaycompress: Delays compression of the log file until the next rotation cycle.
- missingok: Ignores the error if the log file is missing.
- notifempty: Does not rotate the log file if it is empty.
- create 0640 root adm: Sets permissions for the new log file and specifies the owner and group.
- sharedscripts: Ensures that the postrotate script is run only once, even if multiple log files are rotated.
- postrotate/endscript: Defines a script to be run after log rotation. In this case, it reloads the Apache server to ensure it starts writing to the new log file.
- Explanation of Configuration Options:
Test the Configuration: You can manually test your
logrotateconfiguration to ensure it works as expected.sudo logrotate -d /etc/logrotate.d/httpd
Note: You will have to replace the occurrences of httpd with apache2based on your system.
By implementing logrotate with the appropriate configuration, you can ensure efficient log management in Apache environments, preventing log files from consuming excessive disk space and maintaining the server’s performance and stability.
Apache Log Formats
Understanding Apache log formats is essential for effective log analysis and monitoring. Different formats capture various levels of detail about web server activity. Below are the main log formats used by Apache.
Common Log Format (CLF)
The Common Log Format is a standardized format that provides essential information about each request. It includes:
Format:
%h %l %u %t \"%r\" %>s %b%h: Remote host (IP address)%l: Remote logname (usually)``%u: Remote user (authenticated user)%t: Time the request was received%r: Request line from the client (method, resource, protocol)%>s: Status code sent to the client%b: Size of the object sent to the client (excluding headers)
Example:
127.0.0.1 - - [14/Jul/2024:12:34:56 +0000] "GET /index.html HTTP/1.1" 200 1043
.webp)
Combined Log Format
The Combined Log Format (CLF) builds on the Common Log Format to give you a richer view of your web traffic. It includes not only the basic details of each request but also the referrer and user agent, providing a more comprehensive understanding of your users and their behaviors.
Understanding the Combined Log Format:
Imagine you run a popular online store. You want to know not just how many people visit your site, but also where they come from and what devices they use. The Combined Log Format can help you answer these questions.
Referrer Insight: The referrer field tells you which page a visitor was on before they arrived at your site. This can help you identify which external links or marketing campaigns are driving traffic to your store.
User Agent Details: The user agent string reveals information about the visitor's browser and operating system. Knowing this helps you optimize your site for the most popular devices and troubleshoot compatibility issues
Format:
%h %l %u %t \"%r\" %>s %b \"%{Referer}i\" \"%{User-Agent}i\"%h,%l,%u,%t,%r,%>s,%b: Same as in CLF%{Referer}i: Referrer URL%{User-Agent}i: User agent string
Example:
127.0.0.1 - - [14/Jul/2024:12:34:56 +0000] "GET /index.html HTTP/1.1" 200 1043 "http://example.com" "Mozilla/5.0"
Real-Life Example:
Let’s say you see the following log entry:
127.0.0.1 - frank [18/Jul/2024:13:55:36 -0700] "GET /product/123 HTTP/1.1" 200 2326 "http://example.com/promo" "Mozilla/5.0 (Windows NT 10.0; Win64; x64) AppleWebKit/537.36 (KHTML, like Gecko) Chrome/91.0.4472.124 Safari/537.36"
From this single line, you can glean a wealth of information:
- Visitor Identity: The request came from a user identified as 'frank' at IP address
127.0.0.1. - Timing: The request was made on July 18, 2024, at 1:55 PM.
- Action: Frank requested the product page for item 123.
- Outcome: The server successfully delivered the page (status code 200) with a size of 2326 bytes.
- Origin: Frank arrived from a promotional page (
http://example.com/promo). - Device: He used a Chrome browser on a Windows 10 machine.
With this information, you can:
- Track the effectiveness of your promotions.
- See which products are getting the most views.
- Ensure your site performs well on popular browsers and devices.
Custom Log Formats
Custom log formats allow you to tailor the information logged to meet your specific needs. This flexibility is invaluable for fine-tuning your analysis and gaining insights that matter most to your business.
Tailored Logging:
Imagine you're running a tech blog and want to track not just the traffic but also the search terms visitors use to find your articles. By customizing your log format, you can capture this specific data.
Example: You might define a custom log format that includes the search term as a custom field. This could look like:
"%h %t \"%r\" %>s %b \"%{User-Agent}i\" \"%{Search-Term}i\""Real-Life Scenario:
192.168.1.1 [18/Jul/2024:14:00:00 -0700] "GET /article/seo-tips HTTP/1.1" 200 5120 "Mozilla/5.0
By leveraging custom log formats, you can transform raw server data into actionable insights, making your web analytics as detailed and relevant as you need them to be.
Analyzing Apache Access Logs
Analyzing Apache access logs is essential for understanding web server activity and user interactions. This section outlines the structure of access logs and key fields that provide valuable insights.
Structure of Access Logs
Apache access logs are structured as a series of plain text entries, with each line representing an individual request to the server. The logs follow a predefined format (e.g., Common or Combined Log Format) that makes it easy to parse and analyze.
Sample Log Entry:
127.0.0.1 - - [14/Jul/2024:12:34:56 +0000] "GET /index.html HTTP/1.1" 200 1043 "http://example.com" "Mozilla/5.0"
Key Fields and Their Meanings
| Field | Example | Meaning |
|---|---|---|
| IP Address | 127.0.0.1 | Identifies the client making the request. |
| Request Method | GET | Type of HTTP request (e.g., GET, POST). |
| Requested URL | /index.html | Resource being requested from the server. |
| HTTP Version | HTTP/1.1 | Version of the HTTP protocol used. |
| Status Code | 200 | Response status indicating success (200 OK). |
| Response Size | 1043 | Size of the response in bytes (excluding headers). |
| User-Agent | "Mozilla/5.0" | Information about the client's browser/application. |
| Referrer | "http://example.com" | Previous page that linked to the requested resource. |
Analyzing Apache Error Logs
Analyzing Apache error logs is vital for diagnosing server issues and ensuring smooth operation. This section outlines the structure of error logs and common error messages.
Structure of Error Logs
Apache error logs contain entries that record server errors and issues encountered during request processing. Each entry typically includes a timestamp, log level, message, and the file or resource associated with the error.
Sample Log Entry:
[Wed Jul 14 12:34:56.123456 2024] [error] [client 127.0.0.1] File does not exist: /var/www/html/missing.html
Common Error Messages and Their Interpretations
| Error Message | Example | Interpretation |
|---|---|---|
| File Does Not Exist | File does not exist: /var/www/html/missing.html | The requested file was not found on the server. |
| Permission Denied | Permission denied: /var/www/html/protected.html | The server does not have permission to access the file. |
| Internal Server Error | Internal Server Error: /index.php | A general error occurred; check the application for issues. |
| Script Not Found | script not found or unable to stat: /cgi-bin/script.cgi | The specified CGI script is missing or not executable. |
| Maximum File Size Exceeded | client exceeded max request body size: /upload | The client uploaded a file that exceeds the server's maximum allowed size. |
| Connection Timeout | Connection timed out: /path/to/resource | The server took too long to respond to the request. |
By understanding these error messages, administrators can quickly diagnose issues and take appropriate actions to resolve them, ensuring the server operates efficiently.
Tip
CGI stands for Common Gateway Interface. It is a standard protocol used to interface external applications with web servers. CGI scripts are programs that run on a web server and generate web content dynamically. When a web server receives a request for a CGI script, it executes the script and sends the output back to the client.
Practical Applications
Analyzing Apache logs provides valuable insights that can significantly enhance server management and website performance. Here are some key practical applications:
- Monitoring Web Traffic and User Behavior: By analyzing access logs, administrators can track user interactions, popular pages, and traffic patterns. This information helps in understanding user behavior, optimizing content delivery, and making informed decisions about website changes.
- Identifying and Mitigating Security Threats: Error logs and access logs are crucial for identifying potential security threats. By monitoring for unusual patterns, such as repeated failed login attempts or access to non-existent pages, administrators can detect and respond to attacks like brute force or SQL injection attempts.
- Performance Optimization Through Log Analysis: Log analysis allows for performance monitoring by identifying slow requests, high error rates, or resource-intensive pages. This information can guide optimization efforts, such as caching strategies, code improvements, or server configuration adjustments, leading to a more efficient and responsive web application.
.webp)
Practical applications of Analyzing Apache logs
Monitoring Apache Logs with SigNoz
Monitoring Apache logs is vital for ensuring the optimal performance and security of your web server. Apache logs provide insights into server activities, access requests, and potential issues that could affect user experience or indicate security threats.
SigNoz enhances Apache log monitoring by offering real-time visibility, advanced querying, and alerting capabilities. This integration allows administrators to quickly identify and respond to anomalies, track performance metrics, and maintain comprehensive observability over their web server operations. SigNoz's centralized logging system simplifies the monitoring process, making it easier to correlate logs from Apache with other system logs for a holistic view of your infrastructure.
Compared to other tools, SigNoz stands out as an open-source platform, offering flexibility, comprehensive observability with metrics and tracing, and an intuitive interface that facilitates ease of use. It is cost-effective and supported by an active community, making it a reliable choice for effective log management and system monitoring.
To set up monitoring for Apache logs in SigNoz, follow these steps:
Prerequisites
- Ensure you have a SigNoz account. Sign up here.
- Root or sudo access to the server.
To send Apache logs to SigNoz, you'll need to follow these steps. The process involves setting up Apache to generate logs, installing and configuring the OpenTelemetry Collector to send logs to SigNoz, and ensuring that everything is working correctly.
Step 1: Set Up Apache to Generate Logs
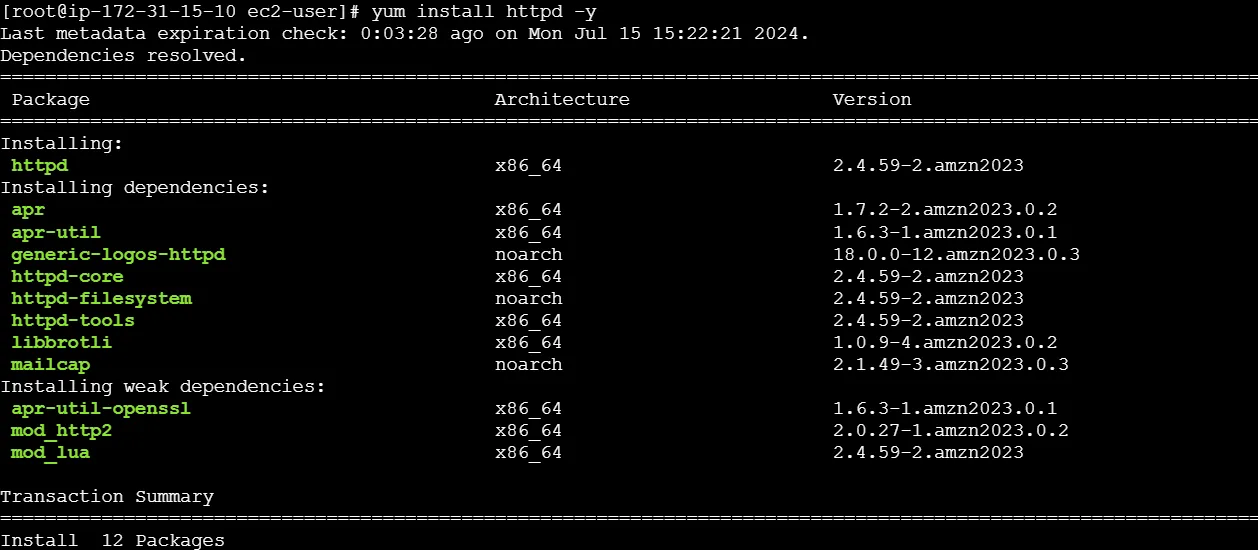
- First, install the Apache server if it is not already installed using the command:
yum install httpd -y
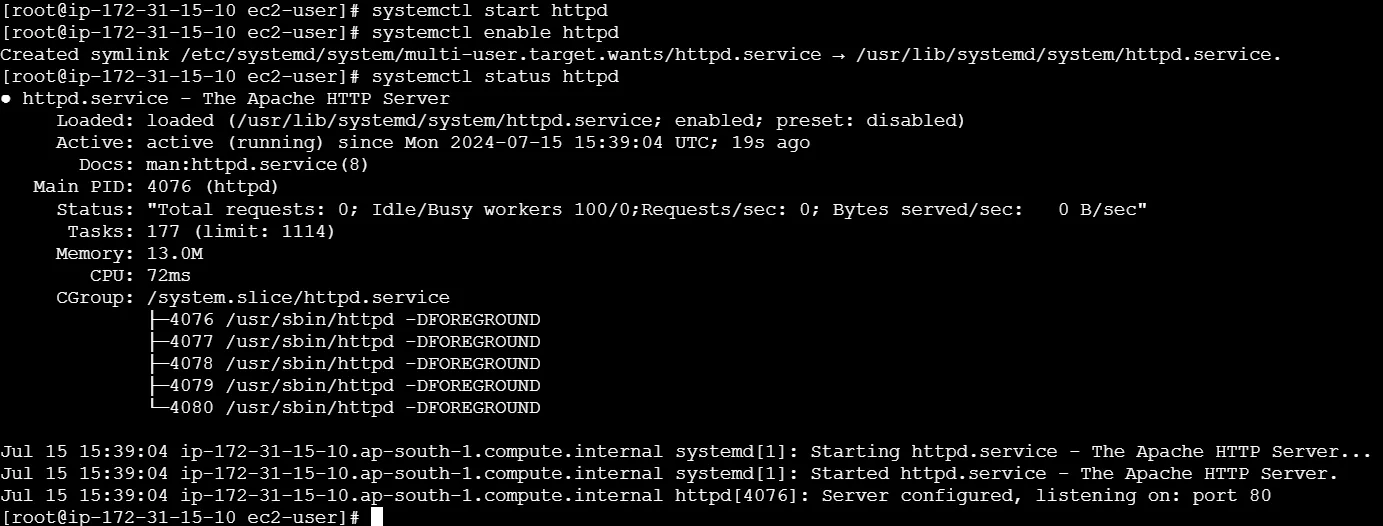
- Start and enable the Apache service by running the command:
systemctl start httpd
systemctl enable httpd
systemctl status httpd
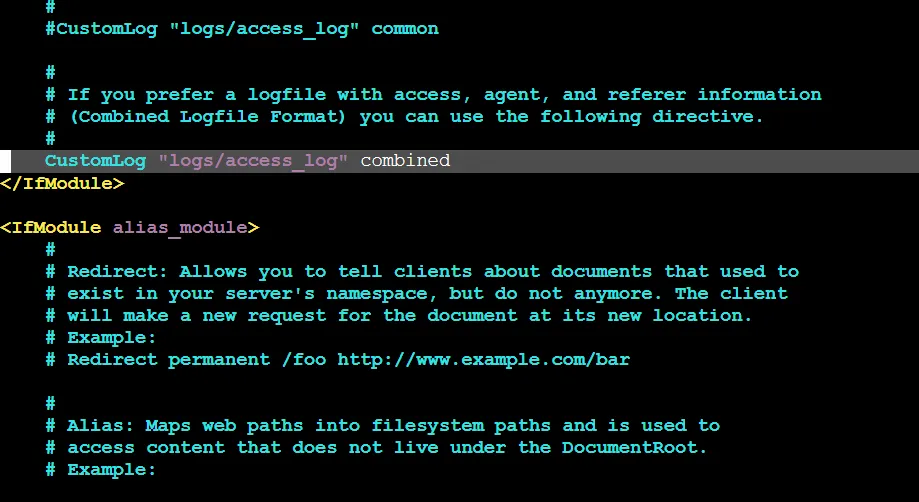
- Access Log Configuration:
By default, Apache logs access information to
/var/log/httpd/access_log.Ensure that the
CustomLogdirective is enabled in your Apache configuration file (usually found at/etc/httpd/conf/httpd.conf):CustomLog logs/access_log combined
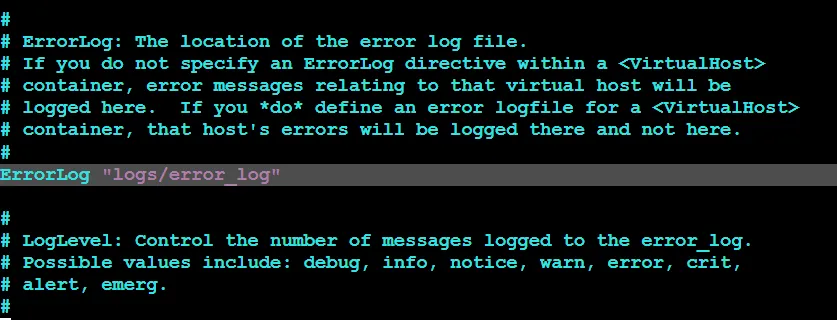
- Error Log Configuration:
Apache logs error information to
/var/log/httpd/error_log.Ensure that the
ErrorLogdirective is enabled in your Apache configuration file (found at/etc/httpd/conf/httpd.conf)ErrorLog logs/error_log
Step 2: Install and Configure OpenTelemetry Collector
Install the OpenTelemetry Collector on your EC2 instance.
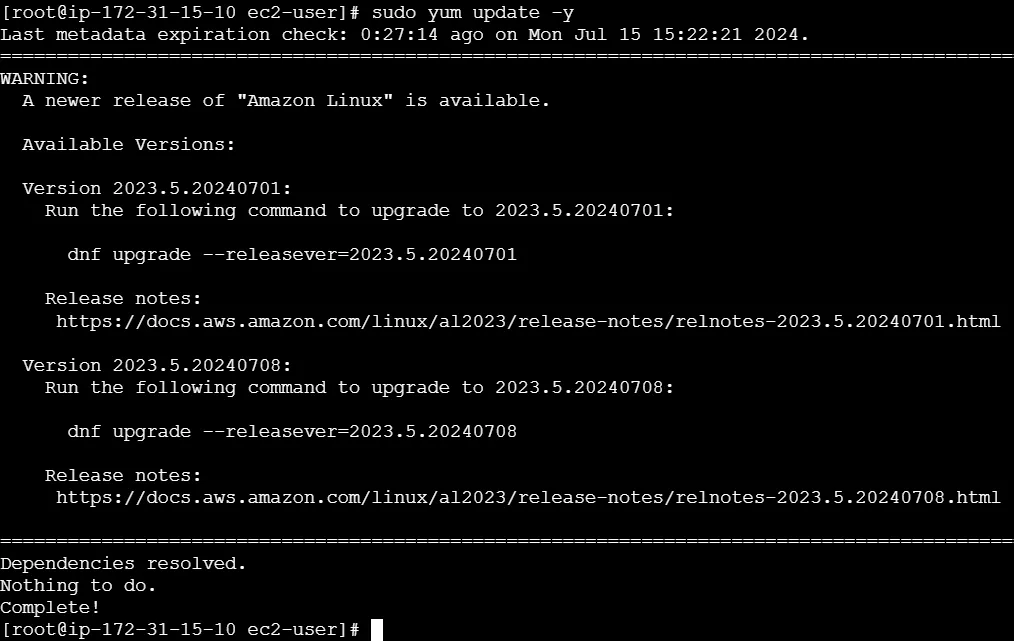
Update Packages:
sudo yum update -y
Download and Install OpenTelemetry Collector:
Ensure you have the OpenTelemetry Collector installed on your system. If not, install it using the following commands:
wget https://github.com/open-telemetry/opentelemetry-collector-releases/releases/download/v0.88.0/otelcol-contrib_0.88.0_linux_amd64.tar.gz
mkdir otelcol-contrib && tar xvzf otelcol-contrib_0.88.0_linux_amd64.tar.gz -C otelcol-contrib

Installing OpenTelemetry collector Installing OpenTelemetry collector
Note: Ensure you have the latest version of the OpenTelemetry Collector. The commands above use version 0.88.0, which is the latest at the time of writing. To verify and download the most current version, visit the OpenTelemetry Collector Releases page.
Create Configuration File:
- Create the OpenTelemetry configuration file,
config.yamlin the folder otelcol-contrib with the below content in it.
- Create the OpenTelemetry configuration file,
receivers:
  otlp:
    protocols:
      grpc:
        endpoint: 0.0.0.0:4317
      http:
        endpoint: 0.0.0.0:4318
  hostmetrics:
    collection_interval: 60s
    scrapers:
      cpu: {}
      disk: {}
      load: {}
      filesystem: {}
      memory: {}
      network: {}
      paging: {}
      process:
        mute_process_name_error: true
        mute_process_exe_error: true
        mute_process_io_error: true
      processes: {}
  prometheus:
    config:
      global:
        scrape_interval: 60s
      scrape_configs:
        - job_name: otel-collector-binary
          static_configs:
            - targets:
              # - localhost:8888
  filelog:
    include:
	    - /var/log/httpd/access_log
	    - /var/log/httpd/error_log
    start_at: end

processors:
  batch:
    send_batch_size: 1000
    timeout: 10s
  resourcedetection:
    detectors: [env, system]
    timeout: 2s
    system:
      hostname_sources: [os]

extensions:
  health_check:
    endpoint: "0.0.0.0:13134"
  zpages:
    endpoint: "127.0.0.1:55680"

exporters:
  otlp:
    endpoint: <cloud endpoint goes here>
    tls:
      insecure: false
    headers:
      "signoz-ingestion-key": <access token goes here>

service:
  telemetry:
    metrics:
      address: 0.0.0.0:8888  # Metrics telemetry address
  extensions: [health_check, zpages]
  pipelines:
    metrics:
      receivers: [otlp]
      processors: [batch]
      exporters: [otlp]
    metrics/internal:
      receivers: [prometheus, hostmetrics]  # Ensure receivers are defined
      processors: [resourcedetection, batch]
      exporters: [otlp]
    traces:
      receivers: [otlp]
      processors: [batch]
      exporters: [otlp]
    logs:
      receivers: [otlp, filelog]  # Include filelog receiver here
      processors: [batch]
      exporters: [otlp]
Replace the endpoint and access token value with the actual OTLP endpoint and token provided by SigNoz.
To run otel-collector, run the following command inside the
otelcol-contribdirectory:./otelcol-contrib --config ./config.yaml &> otelcol-output.log & echo "$!" > otel-pid

Step 3: Testing Apache Logs on SigNoz
- Generate Traffic to Apache Server
- Use the
curlcommand to generate multiple requests to your Apache server.
for i in {1..10}; do curl http://localhost/; done

- Replace
localhostwith your server's IP address or domain name if you are testing from a different machine. - Generate different types of HTTP requests to test various logging scenarios.
curl -X GET http://localhost/
curl -X POST http://localhost/
curl -X PUT http://localhost/
curl -X DELETE http://localhost/


- Verify Logs in Apache
- Verify that the requests are being logged in the
access_logfile.
sudo tail -f /var/log/httpd/access_log

You should see entries corresponding to the requests you generated.
- Similarly, verify that any errors (if any) are being logged in the
error_logfile.
sudo tail -f /var/log/httpd/error_log

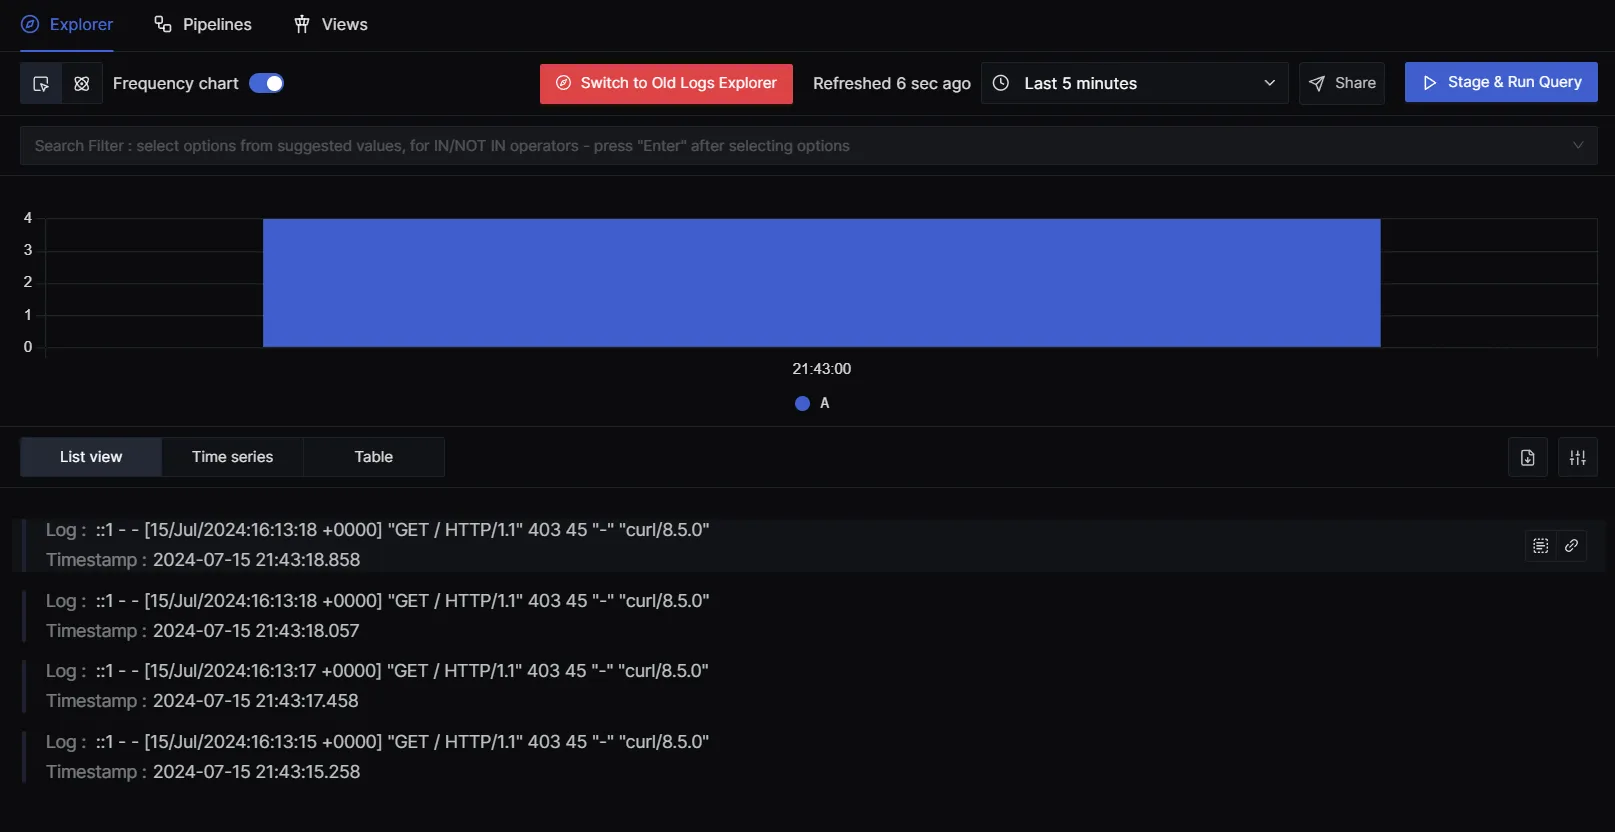
- Verify Logs in SigNoz
- Log in to your SigNoz cloud and navigate to the logs section.
- Verify that you can see the Apache access and error logs in the SigNoz dashboard.
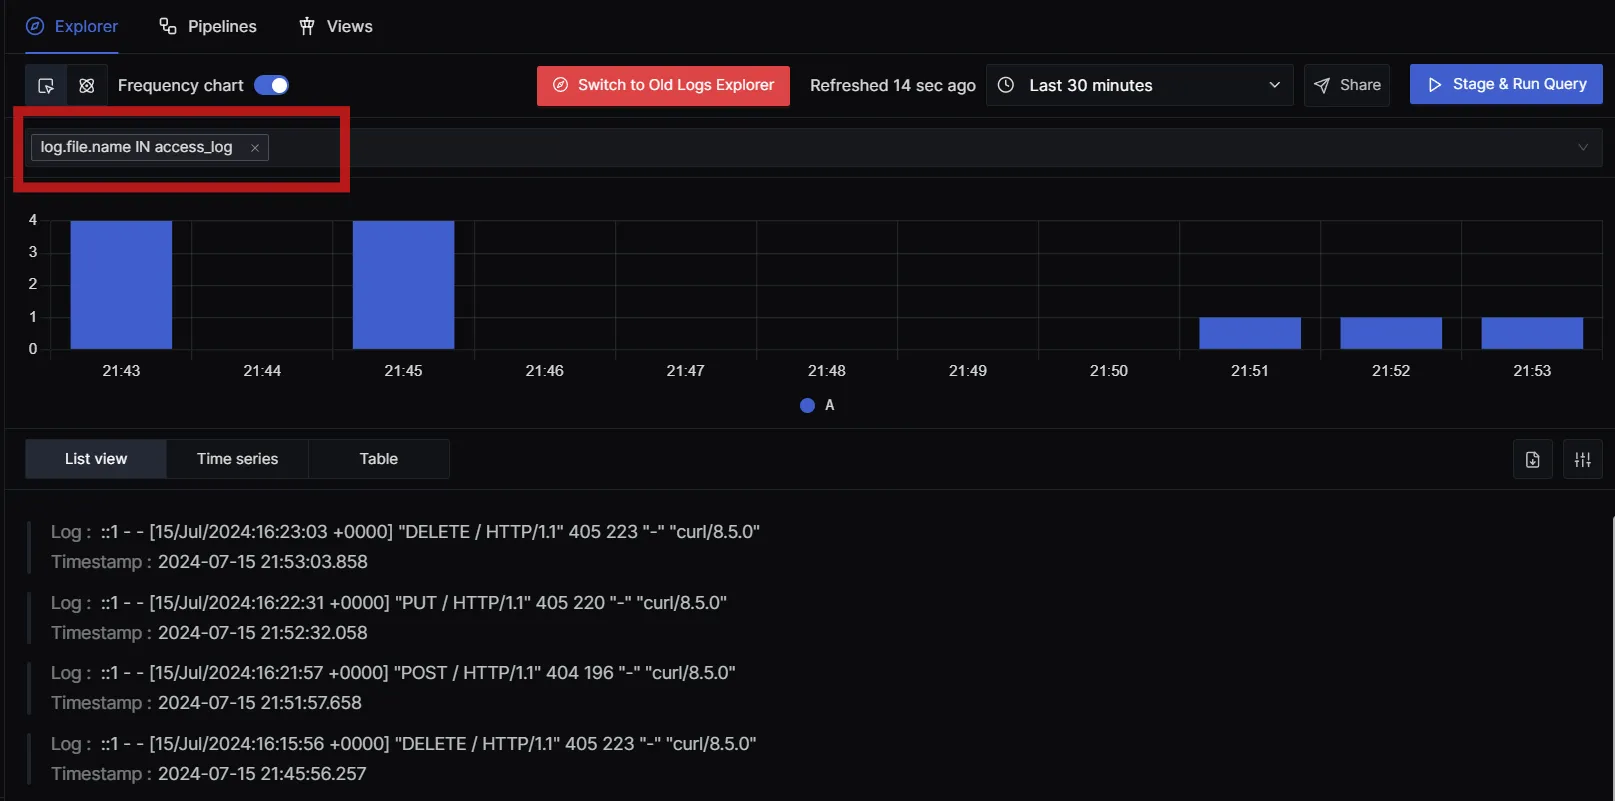
- Use the search and filter options to find specific log entries related to the requests you generated.
Conclusion
This guide outlines the significance of monitoring Apache logs to maintain optimal server performance and security.
Some key takeaways include:
- Apache logs are vital in tracking server activity, with access logs detailing client requests and error logs capturing server issues.
- The two primary types of Apache logs are access logs, which record client requests and server responses, and error logs, which capture server issues and errors encountered during processing.
- Proper configuration of log paths and formats in the
httpd.conffile is essential for effective log management and analysis. - Analyzing Apache logs aids in performance monitoring, security auditing, troubleshooting, and understanding user behavior through traffic insights.
- Integrating Apache logs with SigNoz provides real-time visibility, advanced querying, and alerting capabilities, making log management more efficient.
FAQs
What are Apache logs?
Apache logs are text files generated by the Apache HTTP Server that record various events, requests, and errors occurring on the server. They provide valuable insights into server performance and user activity.
What is Apache log viewer analysis?
Apache log viewer analysis involves examining the entries in Apache log files to understand server performance, troubleshoot issues, and monitor user behavior. This can be done using various tools or scripts that parse and visualize log data.
How to check access logs?
You can check access logs by using command-line tools such as cat, tail, or less on the log file, typically located at /var/log/apache2/access.log or /var/log/httpd/access_log. For example, use tail -f /var/log/apache2/access.log to view logs in real-time.
What is the referrer Apache log?
The referrer Apache log refers to the URL of the webpage that directed a user to the requested resource. It is logged in the access log and helps track user navigation and traffic sources.
Where are Apache logs kept?
Apache logs are usually stored in the /var/log/apache2/ directory on Debian-based systems or /var/log/httpd/ on Red Hat-based systems. The specific log file names typically include access.log and error.log.
What is Apache and why is it used?
Apache is an open-source web server software that serves web content over the internet. It is widely used for hosting websites and applications due to its flexibility, reliability, and robust community support.
How do I open Apache logs?
You can open Apache logs using text editors or command-line tools. For example, use nano /var/log/apache2/access.log to edit with Nano, or tail -f /var/log/apache2/error.log to view logs in real-time.
What are the two types of log files Apache keeps?
Apache primarily keeps two types of log files: access logs, which record all requests received by the server, and error logs, which capture issues and errors encountered during processing requests.
What are the Apache LogLevel values?
Apache LogLevel values determine the verbosity of logged messages. Common LogLevel values include emerg, alert, crit, error, warn, notice, info, and debug.
Where is Apache_Log_Dir?
The Apache_Log_Dir is usually set in the Apache configuration file (httpd.conf or apache2.conf) and typically points to the directory where log files are stored, commonly /var/log/apache2/ or /var/log/httpd/.
What are user logs?
User logs refer to entries in the access log that detail individual user requests to the server, including the requested URL, timestamp, response status, and user agent information.
What is a server log?
A server log is a record of events and transactions processed by a server. It provides insights into server operations, user activity, and system performance.
What is the purpose of server logs?
The purpose of server logs is to monitor server activity, diagnose issues, analyze traffic patterns, enhance security, and provide a historical record of server operations.
What are the Apache logging levels?
Apache logging levels indicate the severity of events logged. They range from high-severity levels like emerg and alert to lower-severity levels like info and debug.
Are Apache logs owned by root?
Yes, Apache logs are typically owned by the root user or the Apache user (such as www-data or apache), depending on the server configuration. This ensures proper permissions and security for log file access.

