Prometheus, a powerful open-source monitoring and alerting toolkit, plays a crucial role in modern DevOps practices. By default, Prometheus operates on port 9090, but there are compelling reasons to change this setting. Whether you're aiming to enhance security, comply with organizational policies, or resolve port conflicts, this guide will walk you through the process of configuring Prometheus to use a non-default port.
Understanding Prometheus and Default Ports
Prometheus serves as a robust monitoring solution, collecting and storing time series data as metrics. It scrapes metrics from configured targets at given intervals, evaluates rule expressions, displays results, and can trigger alerts when specified conditions are met.

By default, Prometheus listens on port 9090 for incoming connections. This port is where you access the web interface and where other services connect to scrape metrics. However, using the default port can pose security risks and may conflict with other applications in your infrastructure.
Why Change Prometheus Port?
Several reasons might prompt you to configure Prometheus to use a non-default port:
- Security enhancement: Using a non-standard port can reduce exposure to automated scans and potential attacks targeting known default ports.
- Compliance requirements: Your organization's security policies might mandate the use of specific port ranges for different services.
- Conflict resolution: Other applications or services in your environment might already use port 9090, necessitating a change for Prometheus.
- Network segmentation: Custom port configurations can help in logical separation of services within complex network architectures.
Step-by-Step Guide to Change Prometheus Port
Here’s how you can change the Prometheus port:
Setting the -web.listen-address Flag
Specify the desired port when starting Prometheus. For example, to run Prometheus on port 8080, use the following commands depending on your setup:
- Systemd Service
If you're using a systemd service, update the Prometheus service file. Locate it at /etc/systemd/system/prometheus.service or a similar path and modify the ExecStart line:
ExecStart=/usr/local/bin/prometheus \
  --config.file=/etc/prometheus/prometheus.yml \
  --storage.tsdb.path=/var/lib/prometheus/data \
  --web.listen-address=0.0.0.0:8080
Then reload and restart the service:
sudo systemctl daemon-reload
sudo systemctl restart prometheus
- Docker Container
If you're running Prometheus in Docker, pass the flag as an argument:
docker run -p 8080:8080 \
  -v /path/to/prometheus.yml:/etc/prometheus/prometheus.yml \
  prom/prometheus \
  --web.listen-address=0.0.0.0:8080
- Manual Start
If you're starting Prometheus manually, include the flag:
prometheus --config.file=prometheus.yml --web.listen-address=0.0.0.0:8080
Verifying the Port Change
To ensure the port change was successful:
Use
netstatorssto check the listening port:sudo netstat -tuln | grep prometheusAccess the Prometheus web interface using the new port:
<http://your-server-ip:8080>

If you encounter issues, check the Prometheus logs:
sudo journalctl -u prometheus -f
Configuring Prometheus Scrape Jobs for Non-Default Ports
When Prometheus or its monitored services operate on non-default ports, you need to adjust the scrape_configs section of the prometheus.yml file to ensure accurate
Open
prometheus.ymland locate thescrape_configssection.Update target ports as needed:
scrape_configs:
  - job_name: 'node_exporter'
    static_configs:
      - targets: ['localhost:9100']
  - job_name: 'custom_service'
    static_configs:
      - targets: ['service-host:8000']
For secured endpoints, add authentication:
scrape_configs:
  - job_name: 'secure_service'
    scheme: https
    basic_auth:
      username: 'user'
      password: 'password'
    static_configs:
      - targets: ['secure-service:8443']
Impact on Prometheus Ecosystem
Changing Prometheus's default port impacts its integration with other tools and workflows in your monitoring ecosystem. Here’s a breakdown of what needs to be updated to ensure continued functionality:
- Update Grafana: Grafana relies on Prometheus as a data source. After changing the Prometheus port, update the Grafana configuration to point to the new port:
- Adjust Alertmanager: If Alertmanager is configured to communicate with Prometheus, update its configuration.
- Review custom scripts: Custom scripts or tools that query Prometheus using its old port need to be updated. These may include:
- Automation scripts fetching metrics.
- Applications using Prometheus APIs.
- CI/CD pipelines with Prometheus integrations.
- Update documentation: A port change affects everyone using Prometheus. Clear communication and updated documentation are crucial.
Monitoring Prometheus with SigNoz
While Prometheus is a powerful tool for time-series data collection and monitoring, it doesn’t offer comprehensive observability features out of the box, such as log aggregation, trace visualization, or detailed anomaly detection.
SigNoz is an open-source observability platform that complements Prometheus by providing enhanced monitoring capabilities. You can configure SigNoz to monitor Prometheus, even after changing its port.
SigNoz cloud is the easiest way to run SigNoz. Sign up for a free account and get 30 days of unlimited access to all features.
You can also install and self-host SigNoz yourself since it is open-source. With 19,000+ GitHub stars, open-source SigNoz is loved by developers. Find the instructions to self-host SigNoz.
Key Benefits of Using SigNoz with Prometheus
Unified Observability: SigNoz provides a centralized platform for monitoring metrics, logs, and traces, giving you a holistic view of your systems alongside Prometheus data.
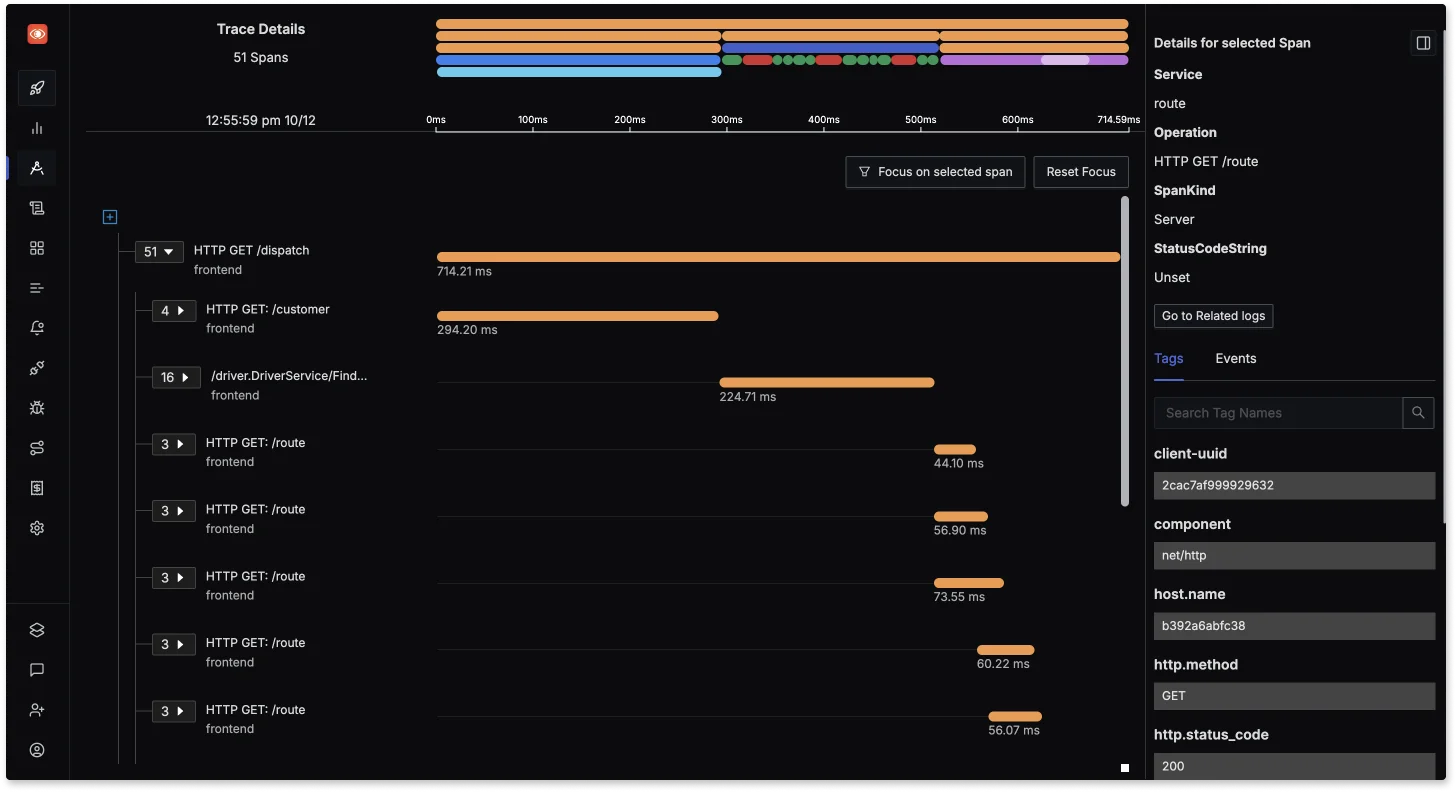
Enhanced Troubleshooting: With distributed tracing and log correlation, SigNoz helps to troubleshoot issues quickly by linking metrics with the corresponding logs and traces, making root cause analysis more efficient.

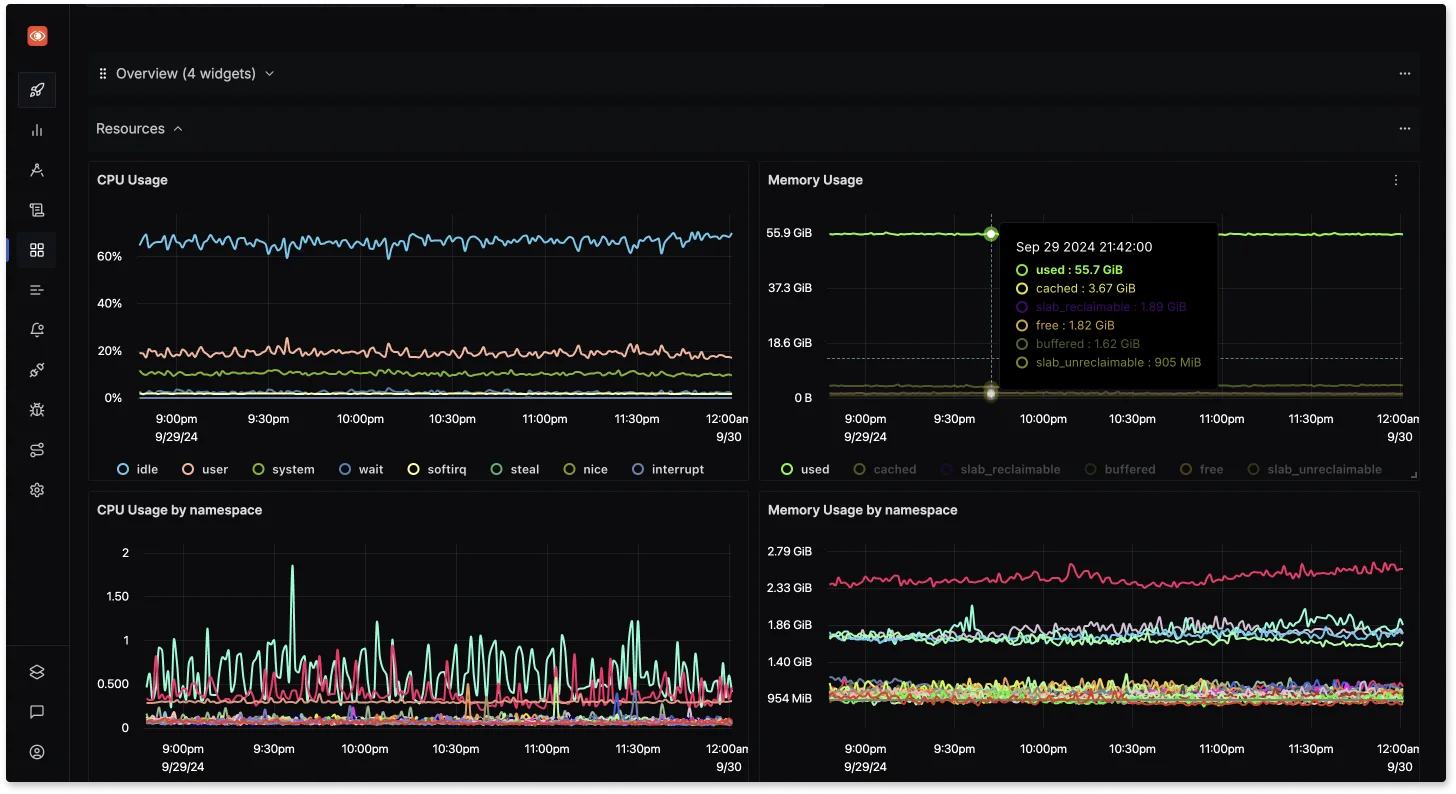
Enhanced Troubleshooting with distributed tracing and log correlation Real-Time Alerting and Dashboards: SigNoz offers powerful real-time alerting and custom dashboards, allowing you to set up complex alerting rules that notify you about system anomalies, complementing the capabilities of Prometheus.

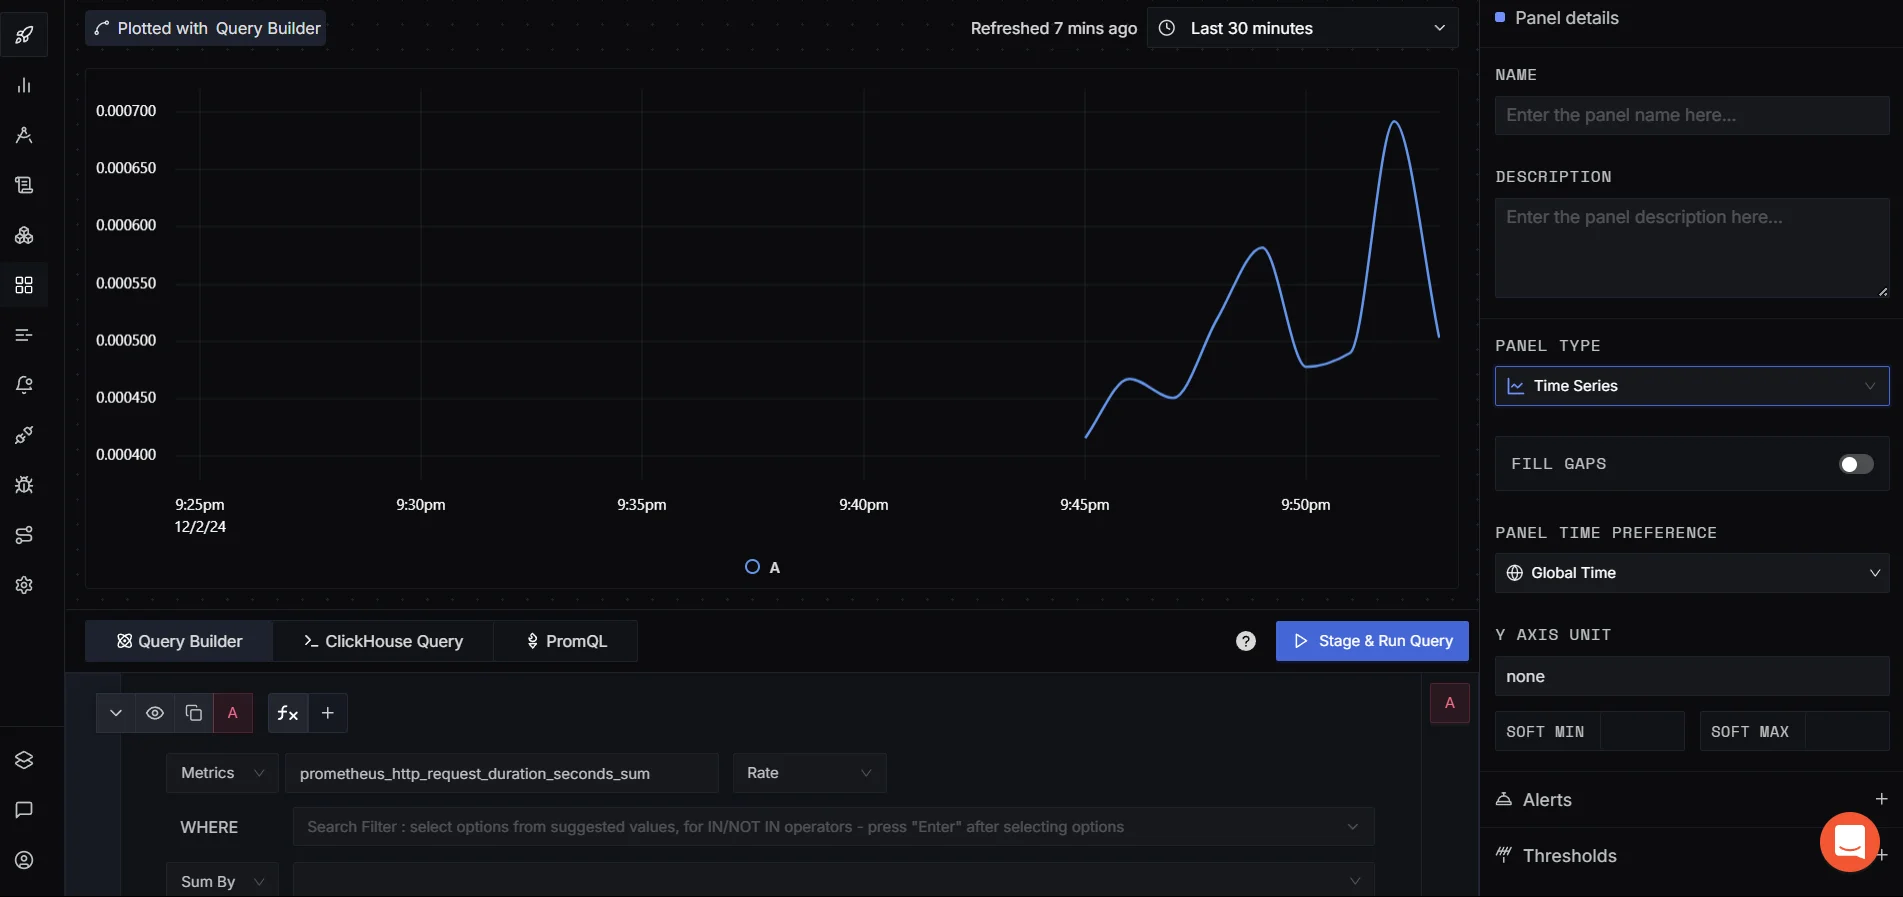
Custom Dashboards in SigNoz Open-Source and Extensible: SigNoz is fully open-source, providing flexibility to integrate it with other tools and customize it to fit your monitoring needs, all while avoiding the vendor lock-in.
Configuring SigNoz Cloud to Monitor Prometheus on a New Port
To monitor Prometheus in SigNoz Cloud, you need to install the OpenTelemetry Collector and configure it to scrape Prometheus metrics. Follow these steps:
Install the OpenTelemetry Collector
If you haven’t already set up the OpenTelemetry Collector, refer to the guide on installing the OpenTelemetry Collector. Ensure that it is installed and connected to your SigNoz Cloud instance.
Set Up the Prometheus Receiver
Once the OpenTelemetry Collector is installed, configure it to scrape Prometheus metrics. Edit your
otel-collector-config.yamlfile and add a Prometheus receiver configuration:New Job:
receivers:
  prometheus:
    config:
      scrape_configs:
        - job_name: 'prometheus'
          static_configs:
            - targets: ['localhost:8080'] #update your port here
Existing Job:
- job_name: "otel-collector"
  scrape_interval: 30s
  static_configs:
    - targets: ["otel-collector:8889", "localhost:31000"] #update the prometheus port
Connect to SigNoz Cloud
Update the exporter section of the configuration to send metrics to your SigNoz Cloud endpoint. Replace
<cloud-instance-url>and<SIGNOZ_INGESTION_KEY>with your SigNoz Cloud details:exporters: otlp: endpoint: <cloud-instance-url> tls: insecure: false headers: "signoz-ingestion-key": <SIGNOZ_INGESTION_KEY> service: pipelines: metrics: receivers: [prometheus] processors: [batch, resourcedetection] exporters: [otlp]Apply Changes
Restart the OpenTelemetry Collector to apply the new configuration
Verify Configuration in SigNoz Cloud
Log in to your SigNoz Cloud dashboard and check for Prometheus metrics to ensure the metrics are being scraped and sent successfully.

Verify Configuration in SigNoz Cloud
By combining Prometheus with SigNoz, you can elevate your monitoring and observability strategy, ensuring better performance, security, and reliability for your systems.
Best Practices for Prometheus Port Configuration
When configuring Prometheus to use a non-default port, several best practices should be followed to ensure security, scalability, and maintainability. Here are some guidelines to help you configure Prometheus ports effectively:
- Choose a port number above 1024 to avoid conflicts with well-known services.
- Implement strict firewall rules to control access to the Prometheus port.
- Conduct regular security audits of exposed ports and services.
- Maintain up-to-date system architecture diagrams that include port configurations.
Key Takeaways
- Changing the Prometheus port enhances security and resolves potential conflicts.
- Proper configuration file editing is crucial for a successful port change.
- Updating related services and configurations ensures system-wide consistency.
- Regular monitoring and documentation maintain system integrity.
FAQs
Why would I need to change the default Prometheus port?
Changing the default port enhances security by making it harder for potential attackers to locate your Prometheus instance. It also helps avoid conflicts with other services that might use port 9090 and allows for compliance with specific network policies.
How do I ensure all my services can still scrape metrics after changing the port?
After changing the Prometheus port, update all scrape job configurations in your prometheus.yml file. Also, modify any external services or exporters that push metrics to Prometheus to use the new port.
Can changing the Prometheus port affect my existing dashboards and alerts?
Yes, it can. Update your Grafana data source configurations and any alerting rules that directly reference Prometheus. Ensure all systems that query Prometheus for data are reconfigured to use the new port.
What security considerations should I keep in mind when exposing Prometheus on a different port?
When exposing Prometheus on a new port:
- Use firewall rules to restrict access to trusted IP addresses.
- Implement TLS encryption for data in transit.
- Set up authentication mechanisms like basic auth or more advanced solutions.
- Regularly audit access logs and monitor for unusual activity on the new port.

