In Unix-like operating systems, the cron daemon is crucial for automating repetitive tasks. Whether you are running system maintenance scripts, performing data backups, or executing custom scripts, cron jobs ensure that these tasks are performed on schedule without manual intervention. However, to ensure that these automated processes run smoothly and effectively, it is vital to monitor their execution. This is where Crontab logs come into play.
By reading and analyzing Crontab logs, system administrators can verify the successful execution of scheduled tasks, identify any errors or failures, and optimize the performance of their cron jobs. This article explores the importance of Crontab logs, how to access and interpret them, and best practices for monitoring your cron jobs to maintain system reliability and efficiency.
What are Crontab Logs?
Crontab logs are records generated by the cron daemon on Unix-like operating systems, capturing the execution details of scheduled tasks, known as cron jobs. These logs provide insights into when a cron job was executed, whether it ran successfully, and any errors or output generated during its execution. By examining Crontab logs, system administrators can track and verify the performance of automated tasks.
Why Monitor Crontab Logs?
Monitoring Crontab logs is crucial for maintaining the reliability and efficiency of automated tasks on Unix-like systems. For instance, consider a backup script scheduled to run nightly. If this script fails silently due to an error, critical data might not be backed up, leading to potential data loss. By regularly checking Crontab logs, system administrators can quickly detect and address such failures, ensuring that all scheduled tasks are executed successfully.
How to Access and Read Crontab Logs
Accessing and reading Crontab logs involves locating the log files where cron job execution details are stored and using command-line tools to view these logs.
The location of Crontab logs can vary based on the operating system:
- Linux (Ubuntu/Debian):
/var/log/syslogor/var/log/cron.log - Linux (Red Hat/CentOS):
/var/log/cron - macOS:
/var/log/system.log - FreeBSD:
/var/log/cron - Windows WSL (Windows Subsystem for Linux): Logs are typically found in the same locations as their Linux counterparts depending on the Linux distribution used in WSL. For instance:
- Ubuntu on WSL:
/var/log/syslogor/var/log/cron.log - Debian on WSL:
/var/log/syslogor/var/log/cron.log - CentOS on WSL:
/var/log/cron
- Ubuntu on WSL:
For WSL, you can access and read these logs using standard Linux commands. However, ensure you have permission to view these log files using sudo if required.
Viewing Crontab Logs via Command Line
You can use command-line tools like grep, tail, and less to view crontab logs.
Below are examples of accessing and reading Crontab logs on different systems.
On Ubuntu/Debian
View all cron job entries in syslog:
grep CRON /var/log/syslog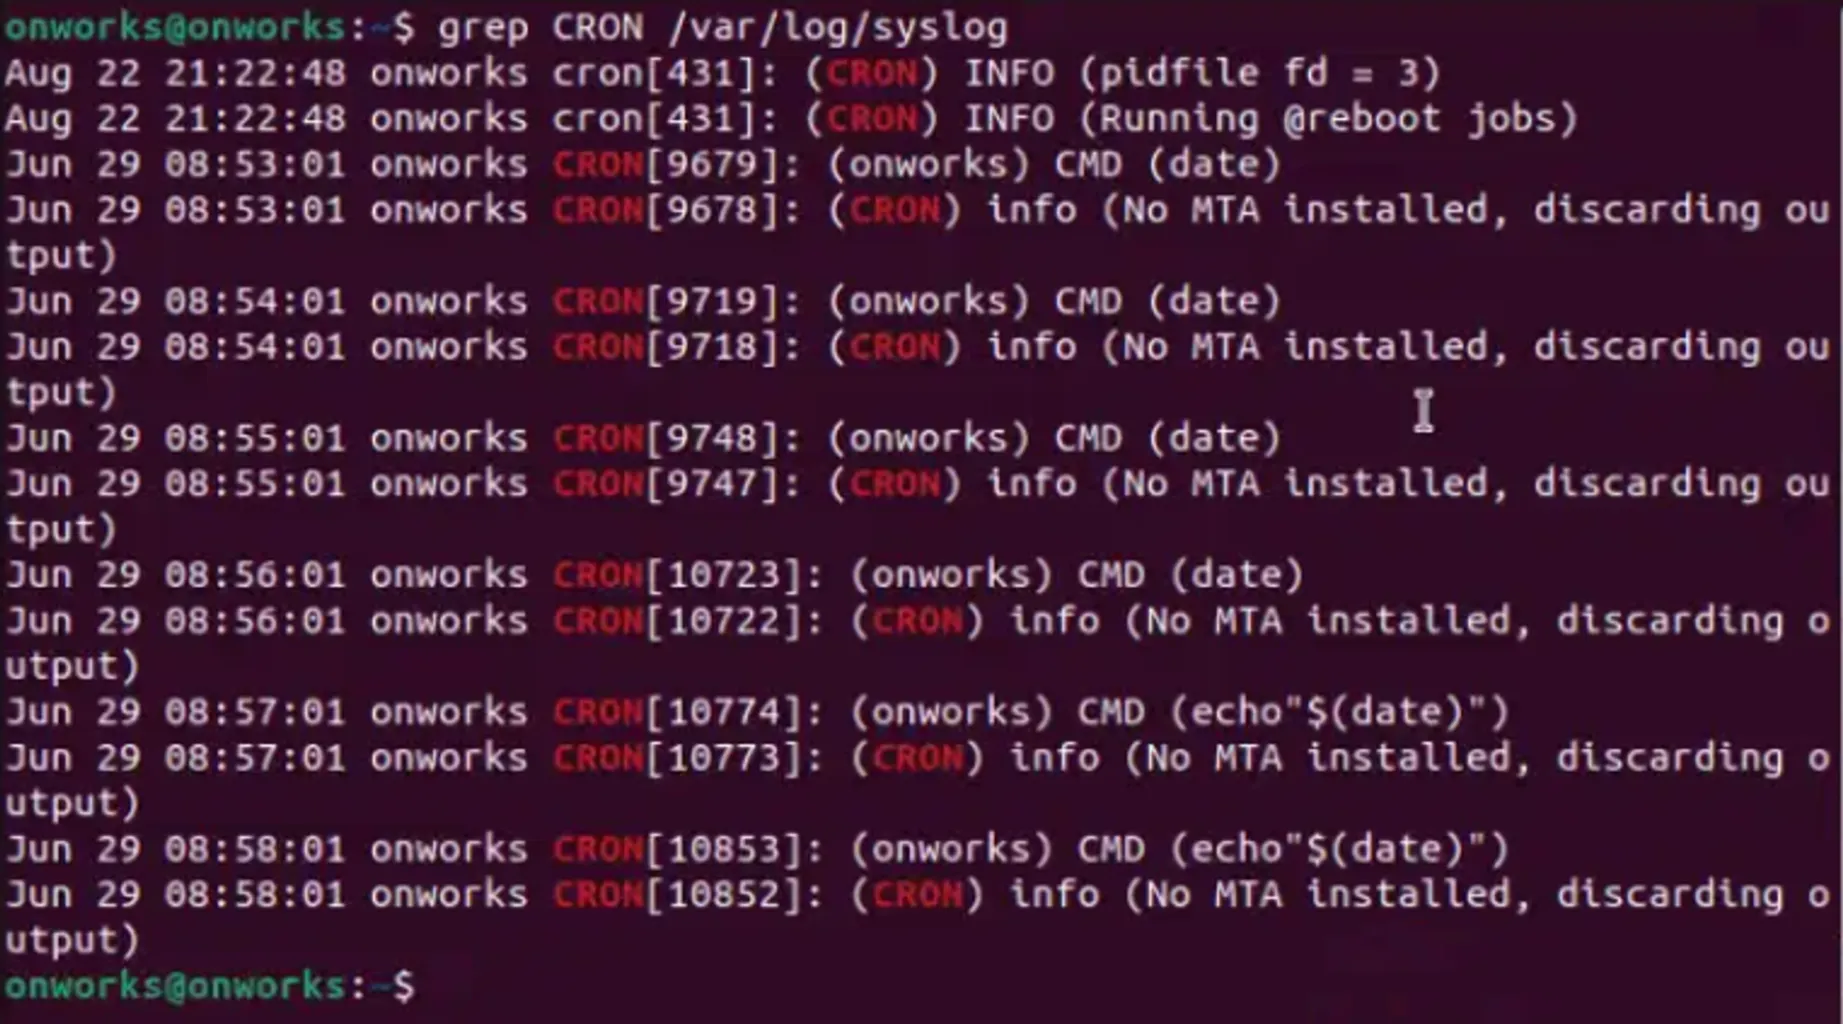
Syslog cronjob entries - Ubuntu
2. View the latest cron log entries usingtail:tail -f /var/log/syslog | grep CRON
Latest cronjob log entries - Ubuntu
3. Uselessfor detailed log examination:less /var/log/syslog | grep CRON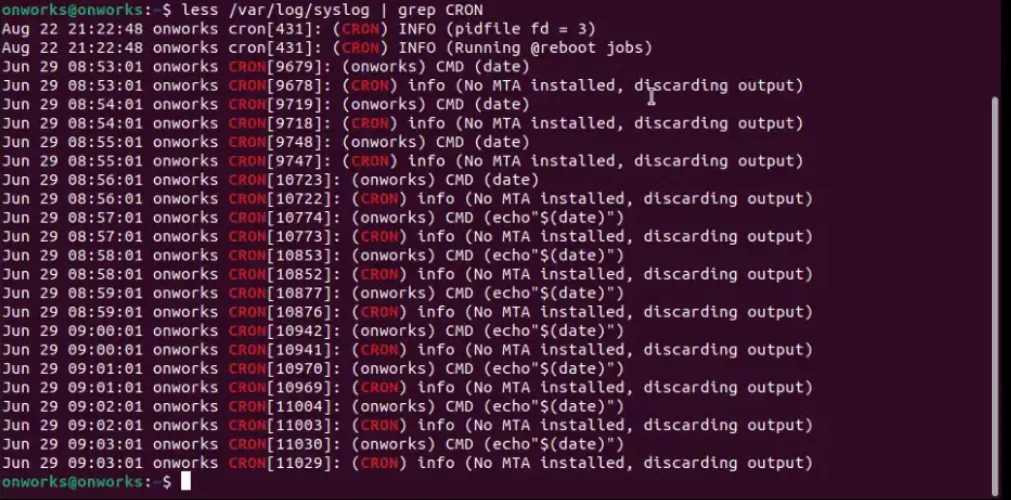
Detailed cronjob logs - Ubuntu
On Red Hat/CentOS
Similar commands can be followed for RedHat/CentOS operating systems by just changing the file location. Below are the commands:
View all cron job entries in the cron log:
grep CRON /var/log/cron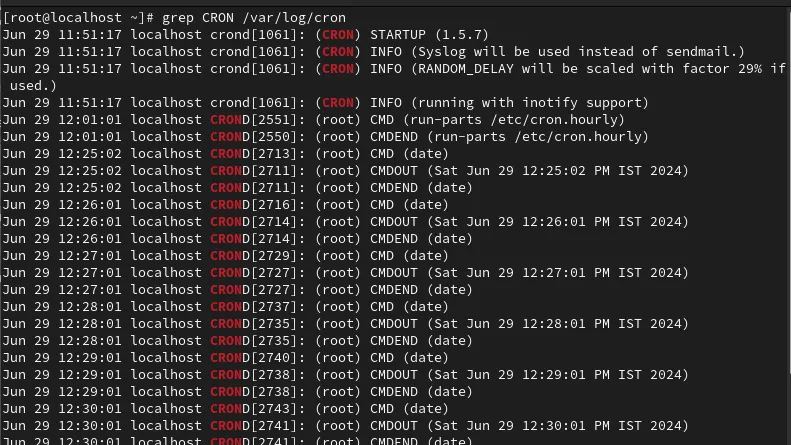
Syslog cronjob entries - RedHat
2. View the latest cron log entries usingtail:tail -f /var/log/cron
Latest cronjob log entries - RedHat
3. Uselessfor detailed log examination:less /var/log/cron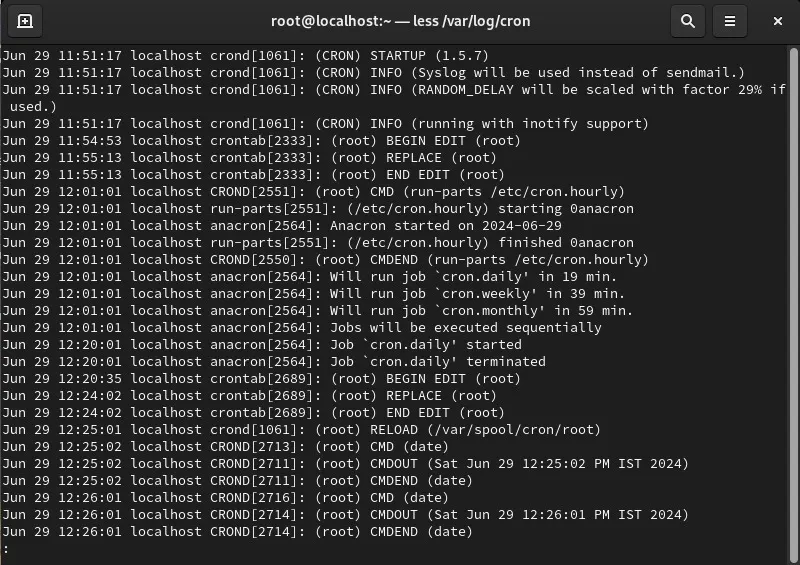
Detailed cronjob log entries - RedHat
Creating Custom Crontab Logs
Creating custom Crontab logs involves redirecting the output of your cron jobs to specific log files. This can help organize logs and make monitoring and troubleshooting cron jobs easier.
Create a
script.shfor the cron job using any editor.
Using `vi` editor for custom crontab log script bash #!/bin/bash echo "Custom Log - $(date): Current time"Make the
script.shfile executable.chmod +x script.sh
Making custom crontab logs creation script executable
2. Open your Crontab file for editing:crontab -e
Opening Crontab file
3. Add a cron job with custom logging:* * * * * /root/script.sh >> /var/log/custom_log.log 2>&1This line schedules
script.shto run at 2 AM daily, redirecting both standard output and error output tocustom_log.log.
How to Check If a Cron Job Ran Successfully
To check if a cron job ran successfully, you can examine the exit status and the log output. A successful cron job typically exits with a status code of 0.
Check the last 10 logs of the log file:
tail -n 10 /var/log/custom_log.log
Latest cronjob log entries
2. Add an exit status check in your script:
The script below logs a custom message with the current time, checks if the logging command succeeded, and then logs a success or failure message accordingly with the current date and time.
#!/bin/bash

echo "Custom Log - $(date): Current time"

if [ $? -eq 0 ]; then
    echo "$(date +"[%a %b %d %H:%M:%S %Y]") Script run successfully"
else
    echo "$(date +"[%a %b %d %H:%M:%S %Y]") Script failed"
fi
Checking Timestamps in Log Files
Timestamps in log files indicate when each cron job was executed. This helps verify the execution times and identify any delays or issues.
View the latest entries in the log file:
tail -n 10 /var/log/custom_log.log
Latest cronjob log entries with timestamp
Each log entry should include a timestamp indicating when the job was executed.Example log entry with timestamp:
[Wed Jun 23 02:00:01 2023] Script executed successfully
Using Cron Output and Error Logs
Cron jobs can generate both output and error logs. By default, these are emailed to the user running the cron job. You can redirect these outputs to specific files for easier monitoring.
Redirect standard output and error to separate files:
* * * * * /root/script.sh >> /var/log/custom_log.log 2>> /var/log/custom_error.logExample script with logging:
#!/bin/bash

echo "Custom Log - $(date): Current time"

cal
stamp
if [ $? -eq 0 ]; then
    echo "$(date +"[%a %b %d %H:%M:%S %Y]") Script run successfully"
else
    echo "$(date +"[%a %b %d %H:%M:%S %Y]") Script failed"
fi
Check the output and error logs.
tail -n 10 /var/log/custom_log.log
Latest entries of cronjob output logs tail -n 10 /var/log/custom_error.log
Latest entries of cronjob error logs
By following these practices, you can create custom Crontab logs, check the success of your cron jobs, verify timestamps, and effectively manage output and error logs. This helps you maintain and troubleshoot your automated tasks efficiently.
Monitoring Crontab Logs with SigNoz
Monitoring Crontab logs is essential for administrators and developers to ensure the reliable execution of scheduled tasks and to diagnose issues promptly when they arise. SigNoz offers distinct advantages over other monitoring solutions for this purpose.
As an open-source observability platform, SigNoz not only provides capabilities for monitoring logs, metrics, and traces but also offers centralized visibility and robust analysis tools specifically tailored for monitoring Crontab logs. Its integration allows users to efficiently track and manage scheduled task executions, proactively detect anomalies, and optimize performance. Additionally, SigNoz's extensible nature and community support make it a compelling choice for those looking to customize their monitoring solutions while keeping costs manageable.
How to Connect Crontab Logs to SigNoz
To connect your crontab logs to SigNoz, you will need a SigNoz cloud account. This account will provide you with access to the SigNoz platform, where you can configure and view your logs. You can create one here.
Once your account has been created, follow the next steps to send the crontab logs:
Specify the Data Source for Crontab Logs
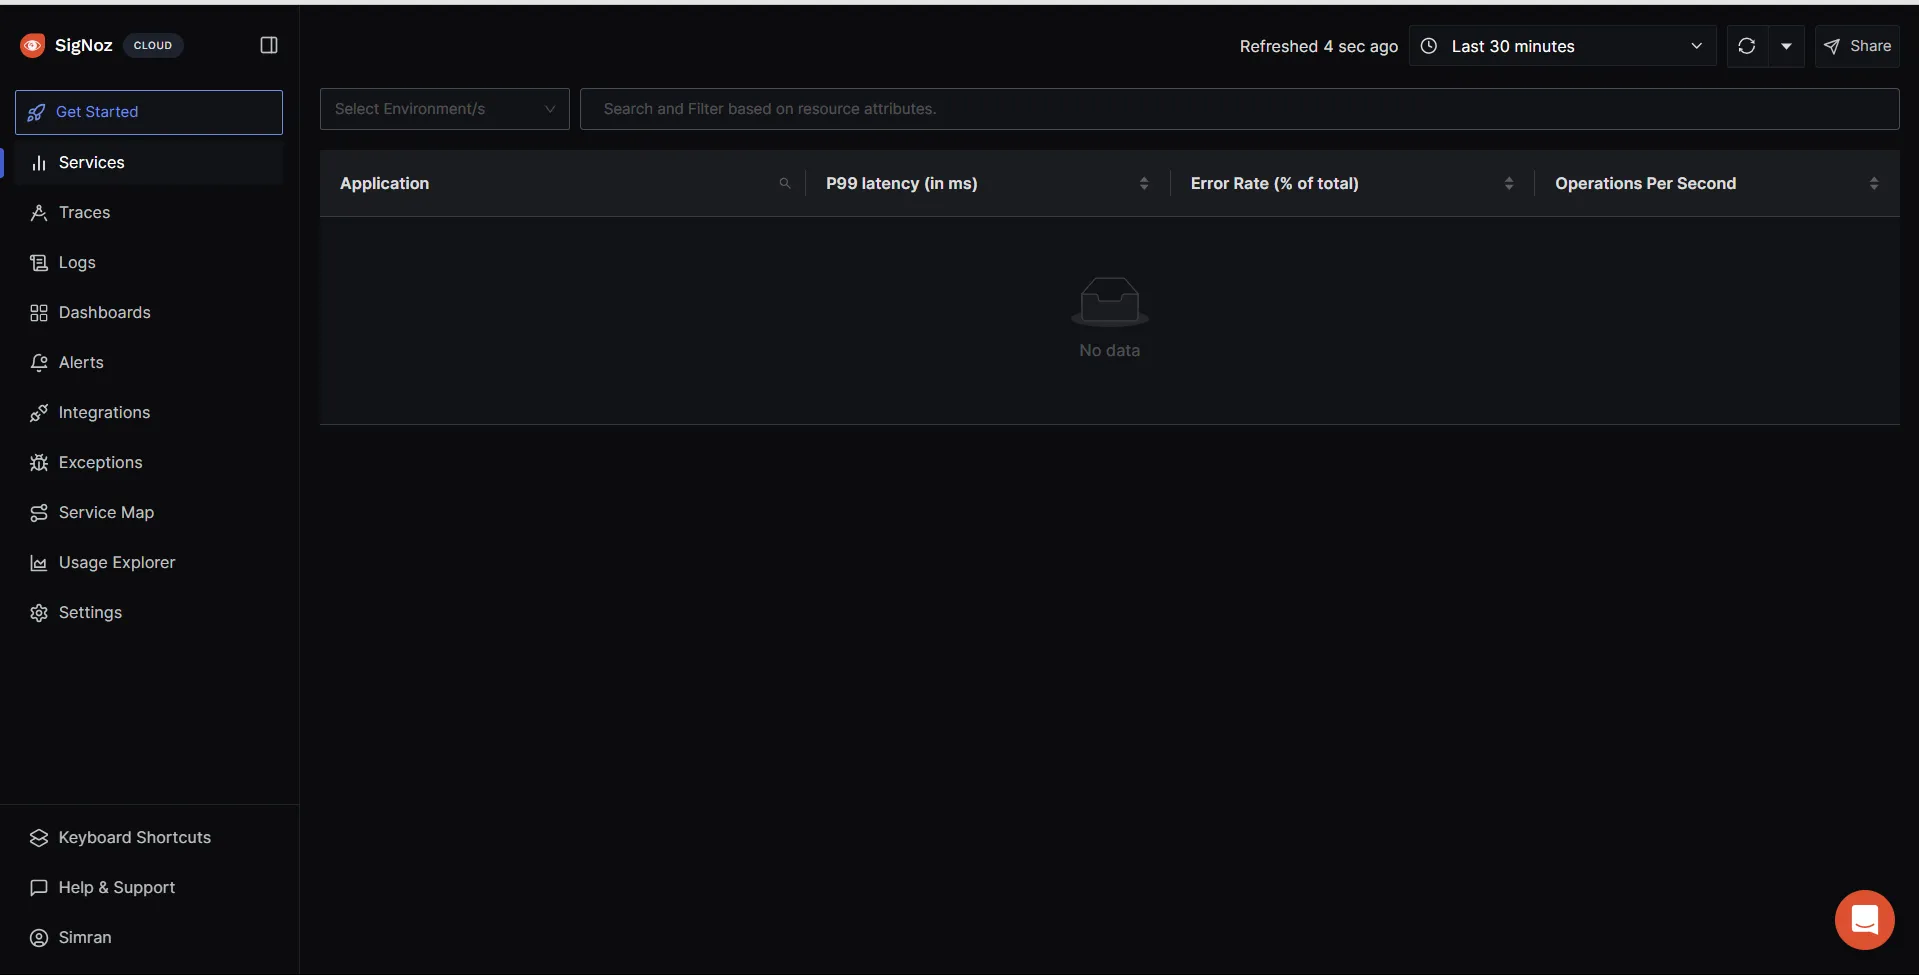
- To send your crontab logs to SigNoz, you need to specify the data source from which the logs originate. To do this, log into your SigNoz cloud account and navigate to the “Get Started” tab.
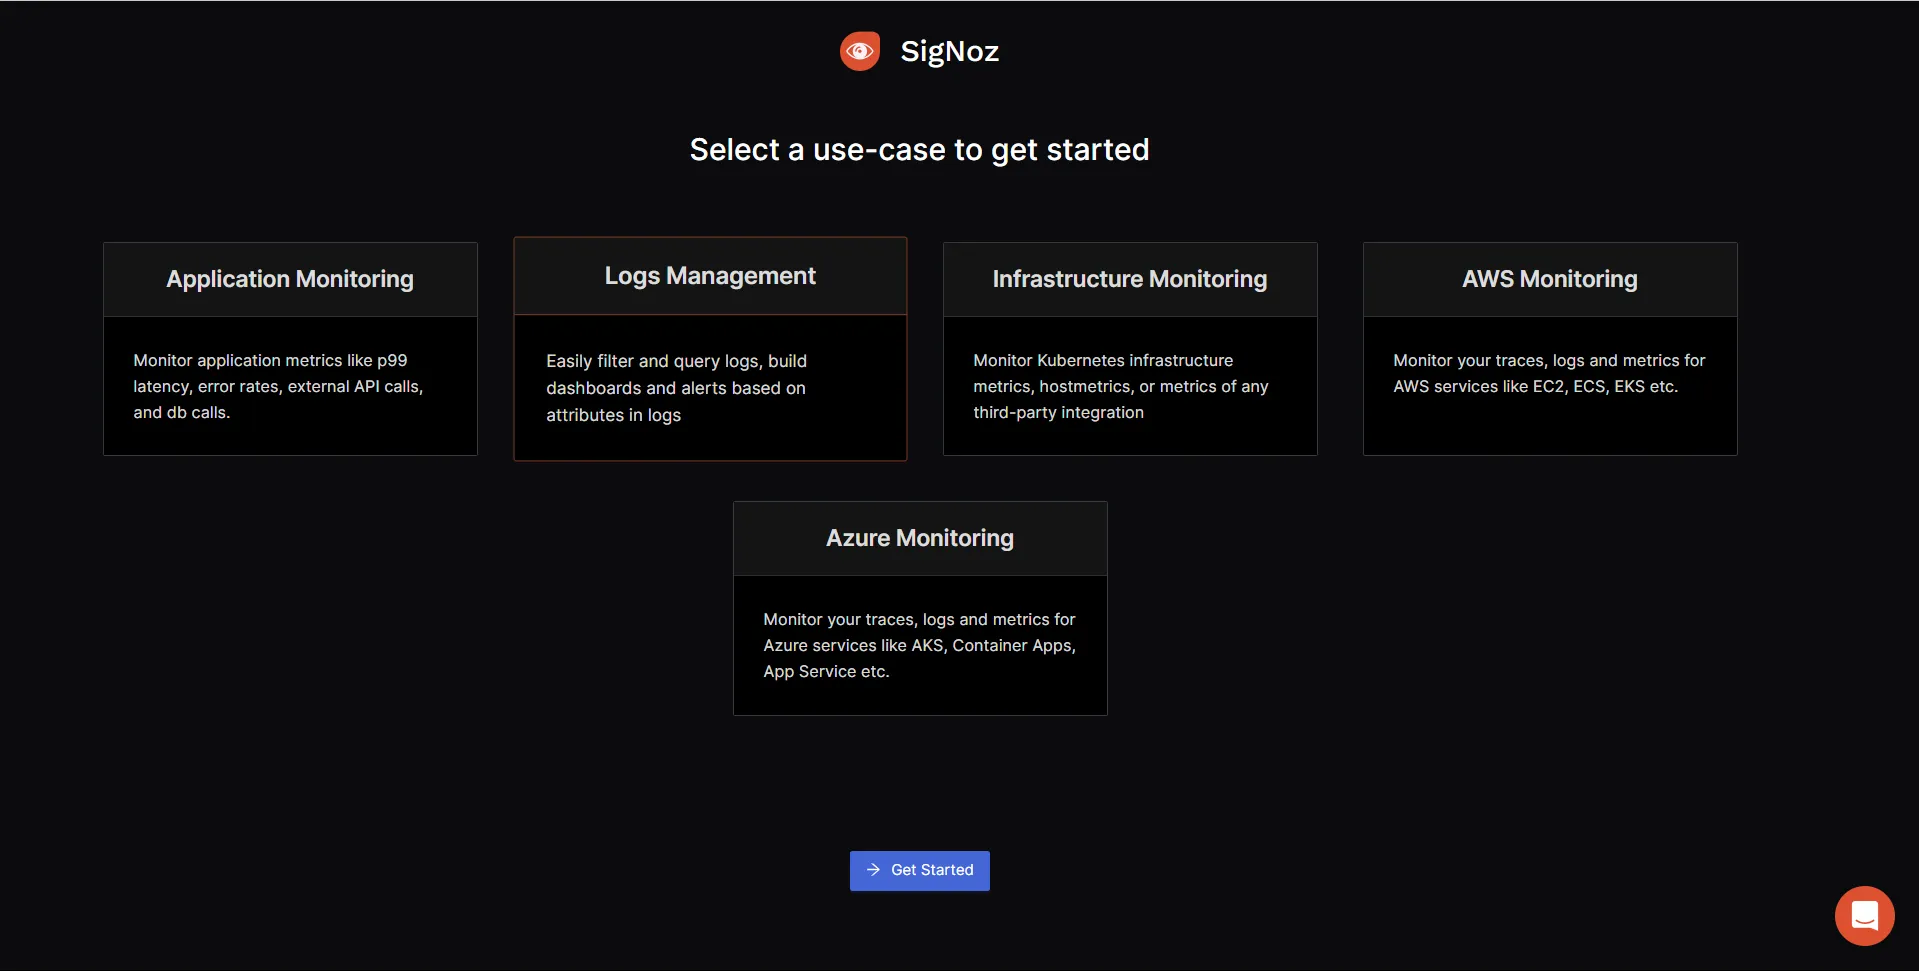
1. Next, you need to select your use case, here its Logs Management.
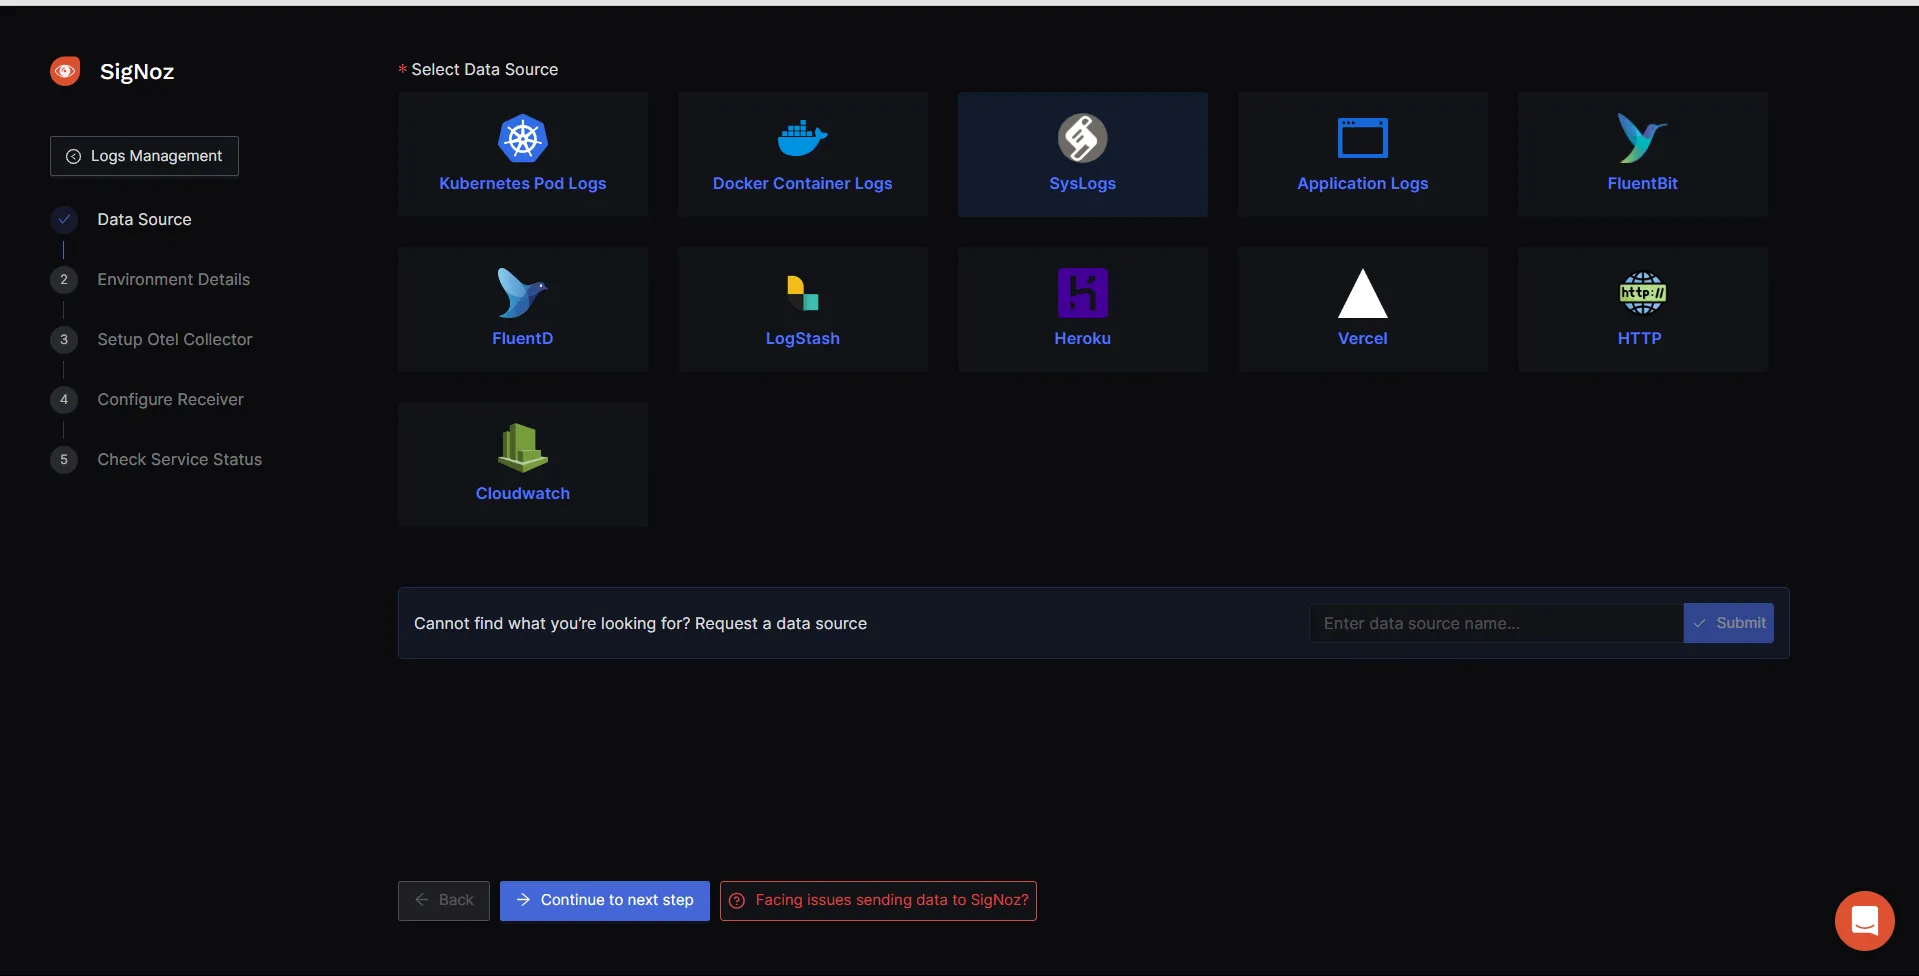
1. Under Logs Management, you need to select the source of our data, for crontab logs choose Syslogs.
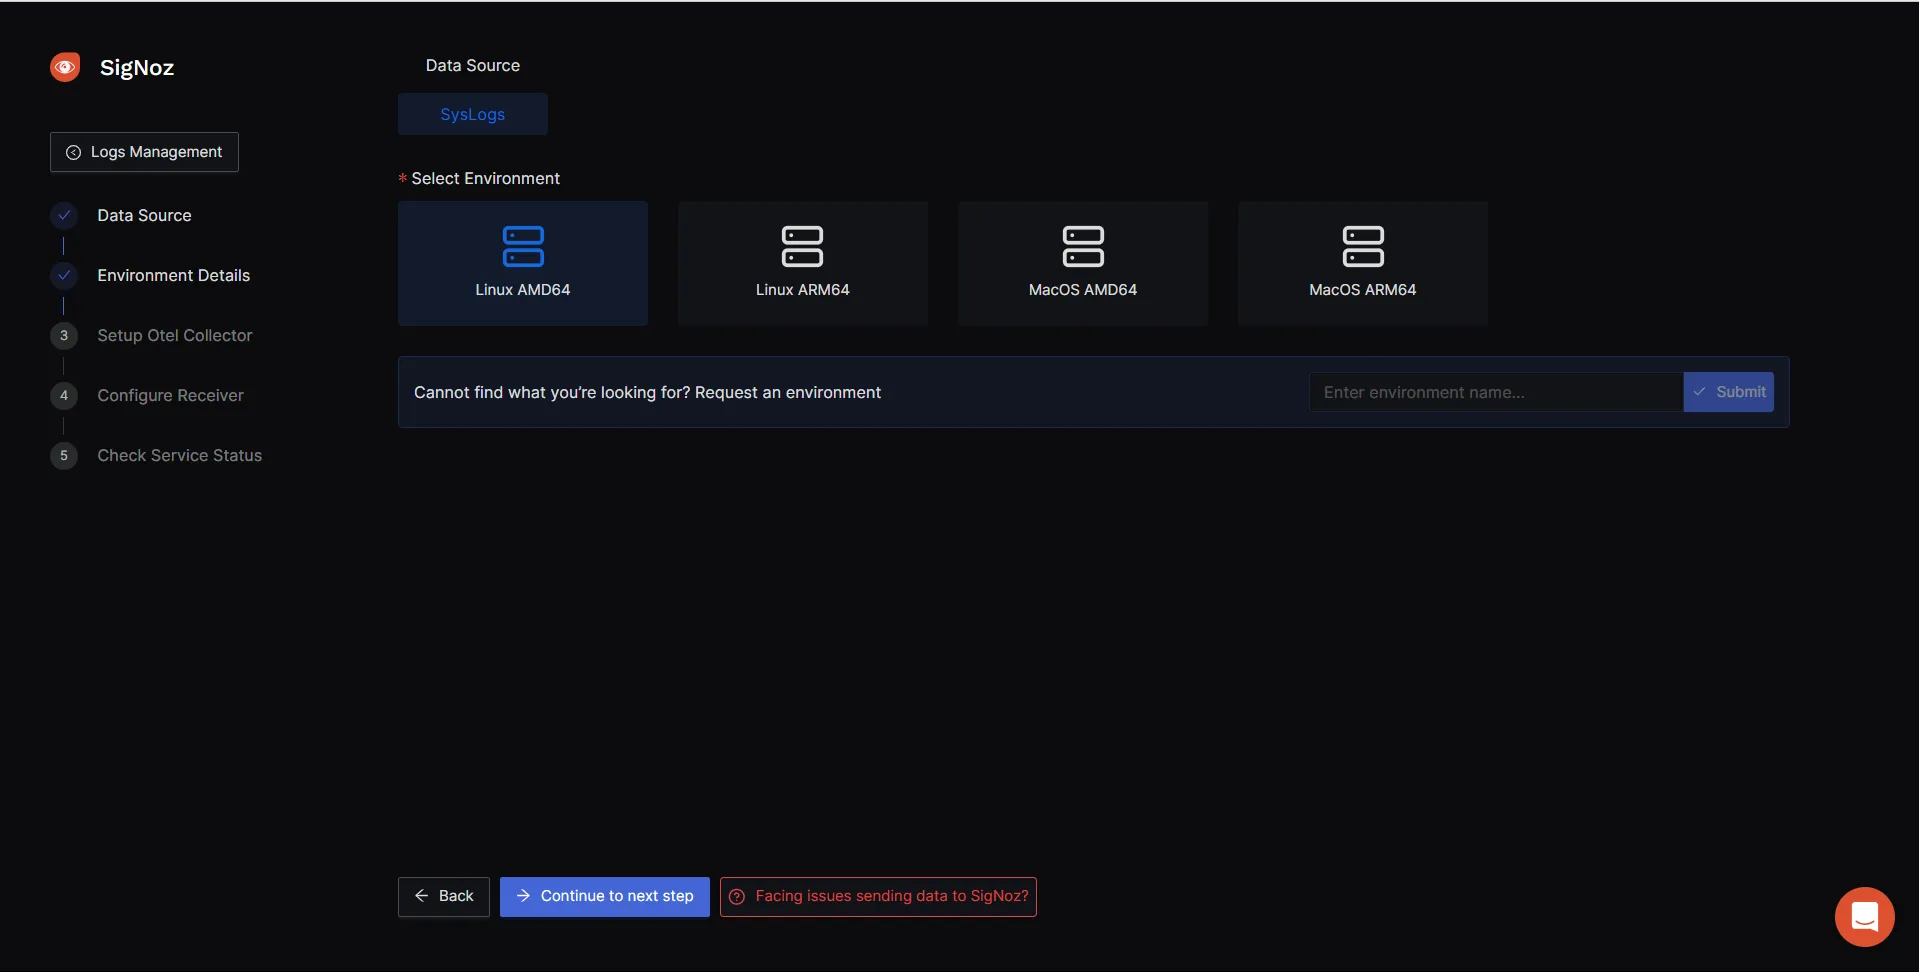
1. You also need to select the environment based on your system specifications and move to the next steps.
Setup OpenTelemetry Binary as an agent
On clicking the Continue to Next Step button you will see the next set of steps to follow.
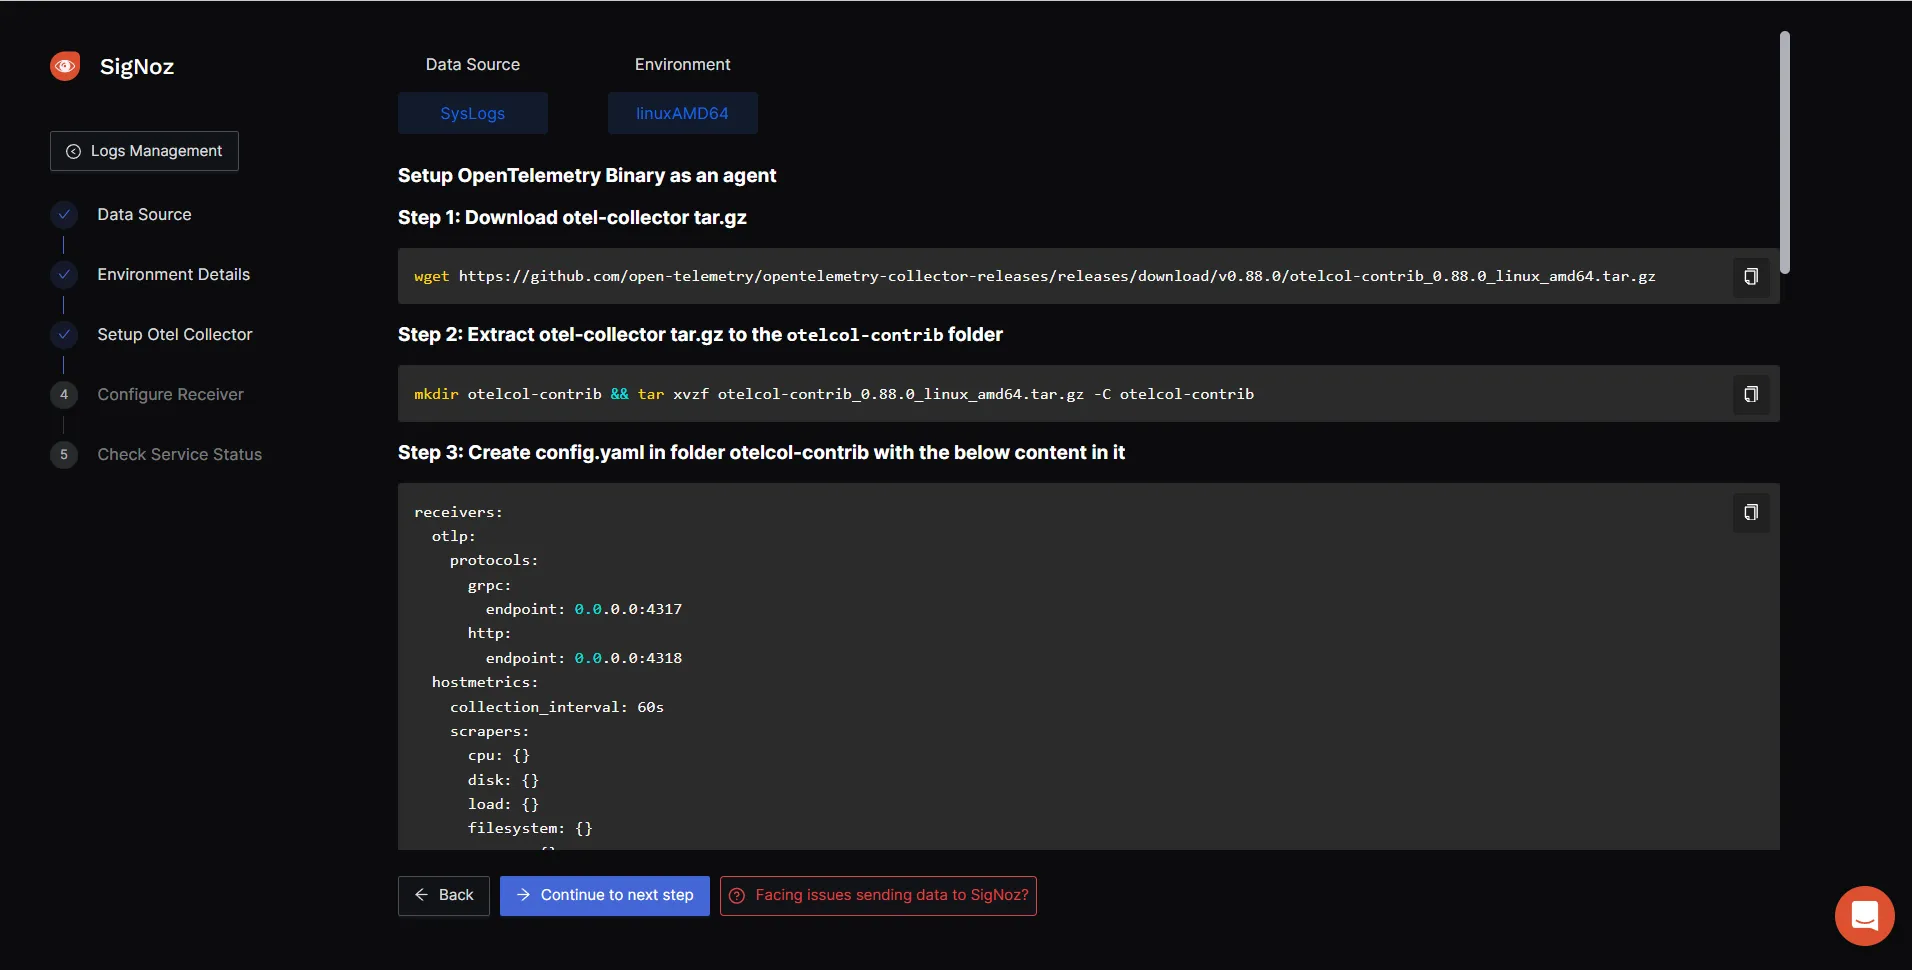
The same steps will be followed with some tweaks.
- Download otel-collector tar.gz using the following command:
wget https://github.com/open-telemetry/opentelemetry-collector-releases/releases/download/v0.88.0/otelcol-contrib_0.88.0_linux_amd64.tar.gz

1. Extract otel-collector tar.gz to the otelcol-contrib folder using the command specified below:
mkdir otelcol-contrib && tar xvzf otelcol-contrib_0.88.0_linux_amd64.tar.gz -C otelcol-contrib

1. Create config.yaml in folder otelcol-contrib with the below content in it.

hostmetrics: collection_interval: 60s scrapers: cpu: {}
disk: {}
load: {}
filesystem: {}
memory: {}
network: {}
paging: {}
process: mute_process_name_error: true mute_process_exe_error: true mute_process_io_error: true
processes: {}
prometheus: config: global: scrape_interval: 60s scrape_configs: - job_name: otel-collector-binary
static_configs: - targets: # - localhost:8888 syslog: tcp: listen_address: '0.0.0.0:54527' protocol:
rfc3164 location: UTC operators: - type: move from: attributes.message to: body filelog: include: [
/var/log/custom_log.log ] # Update with your actual log file path start_at: end

processors:
batch:
send_batch_size: 1000
timeout: 10s
resourcedetection:
detectors: [env, system]
timeout: 2s
system:
hostname_sources: [os]

extensions:
health_check:
endpoint: "0.0.0.0:13134"
zpages:
endpoint: "127.0.0.1:55680"

exporters:
otlp:
endpoint: "cloud endpoint goes here"
tls:
insecure: false
headers:
"signoz-ingestion-key": "access token goes here"

service:
telemetry:
metrics:
address: 0.0.0.0:8888 # Metrics telemetry address
extensions: [health_check, zpages]
pipelines:
metrics:
receivers: [otlp]
processors: [batch]
exporters: [otlp]
metrics/internal:
receivers: [prometheus, hostmetrics] # Ensure receivers are defined
processors: [resourcedetection, batch]
exporters: [otlp]
traces:
receivers: [otlp]
processors: [batch]
exporters: [otlp]
logs:
receivers: [otlp, syslog, filelog] # Include filelog receiver here
processors: [batch]
exporters: [otlp]
You can update the access token and endpoint with the values specified in the Otel-collector Setup step.
Note: Crontab logs are not added by default to the system logs, so you need to define the output file where your crontab logs are stored under the filelog section.
- To run otel-collector, run the following command inside the
otelcol-contribdirectory:
./otelcol-contrib --config ./config.yaml &> otelcol-output.log & echo "$!" > otel-pid

Modify the rsyslog.conf file
- Open your
rsyslog.conffile present inside/etc/by running the following command :
sudo vim /etc/rsyslog.conf
- Update your
rsyslog.conffile with the following content
template(
  name="UTCTraditionalForwardFormat"
  type="string"
  string="<%PRI%>%TIMESTAMP:::date-utc% %HOSTNAME% %syslogtag:1:32%%msg:::sp-if-no-1st-sp%%msg%"
)

*.* action(type="omfwd" target="0.0.0.0" port="54527" protocol="tcp" template="UTCTraditionalForwardFormat")
Note: Here, it is assumed that you are running the Otel binary on the same host. If not, the value of the target might change depending on your environment.
To learn more about collecting syslog logs in SigNoz, you can visit the documentation.
Check Service Status
- Restart your rsyslog service by running
sudo systemctl restart rsyslog.service

1. Check the status of your service. Make sure your service is in an active state.
sudo systemctl status rsyslog.service
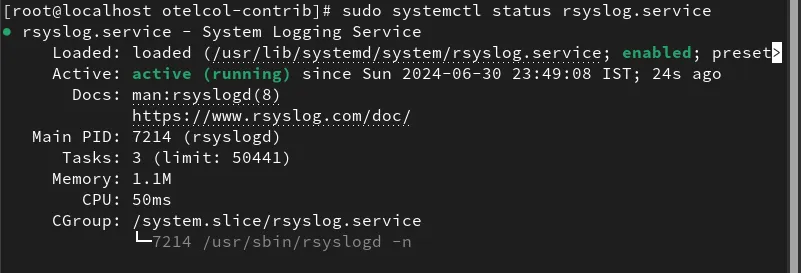
Once things are up and running, you can click on Done button of the SigNoz steps and you will be redirected to Logs Explorer where you will see your logs getting updated.
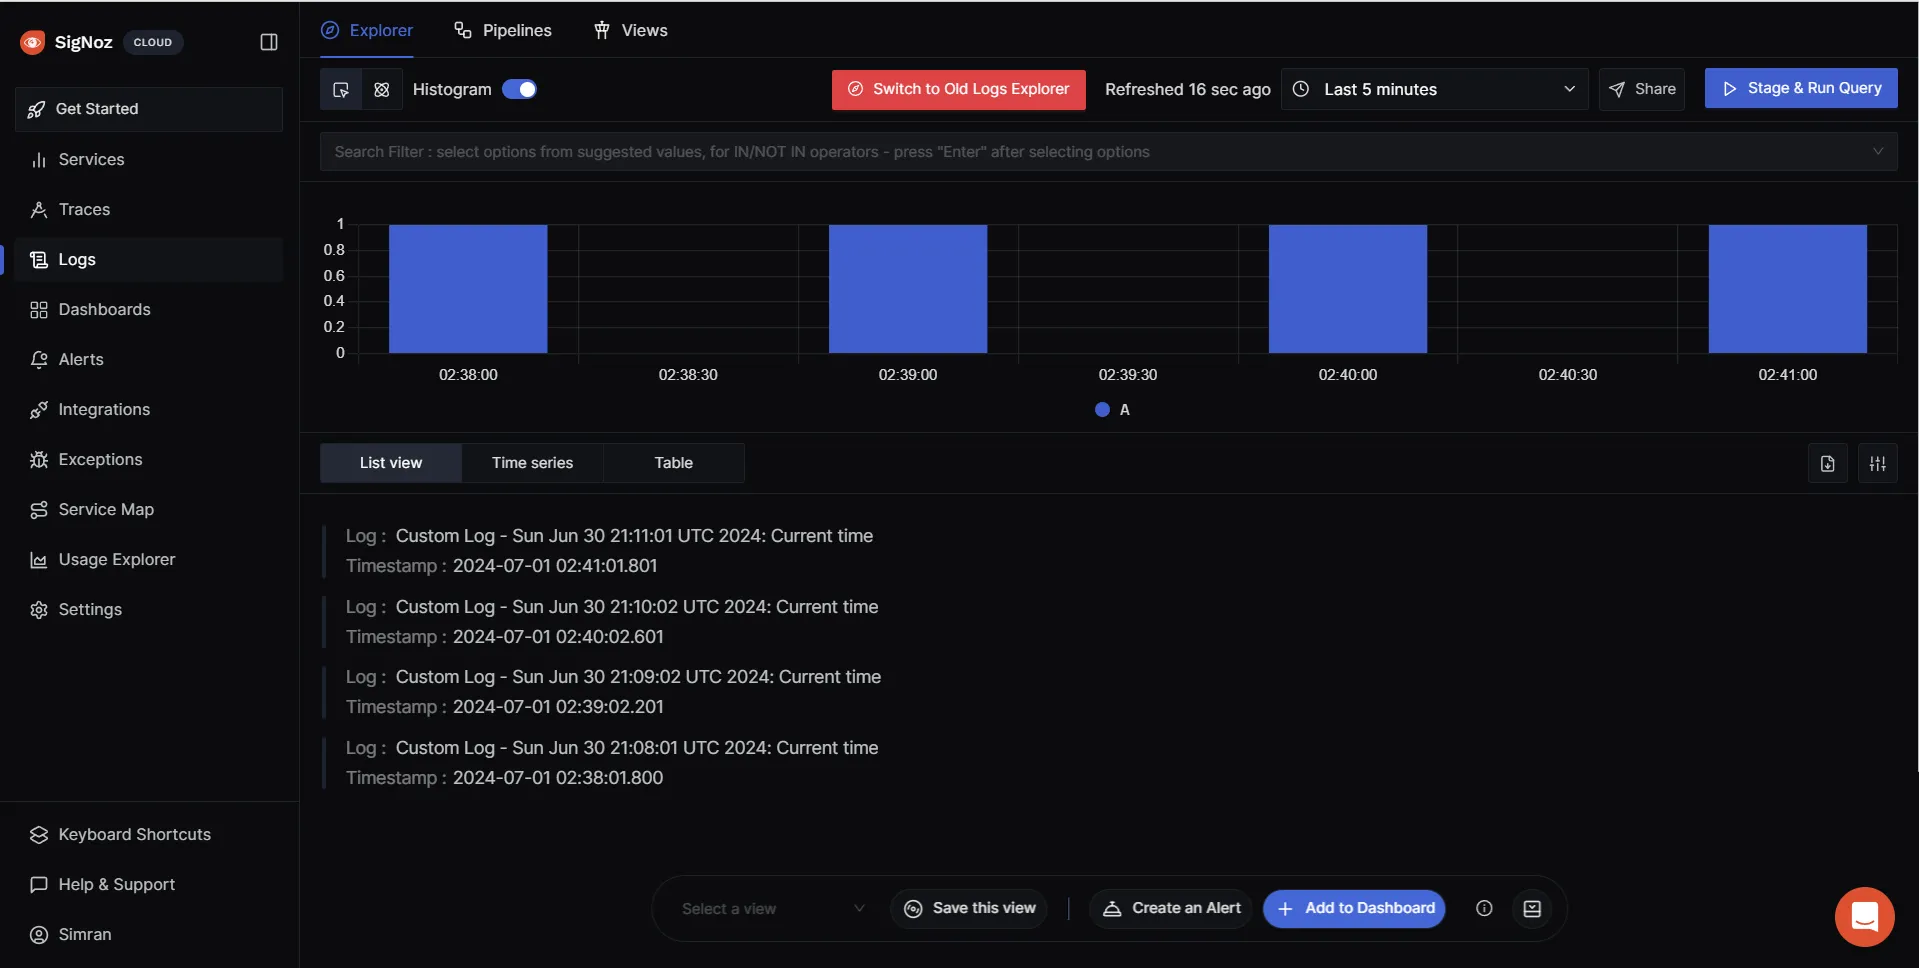
You can expand the logs and see the various attributes associated with them. You can also filter logs based on the attributes and their values.
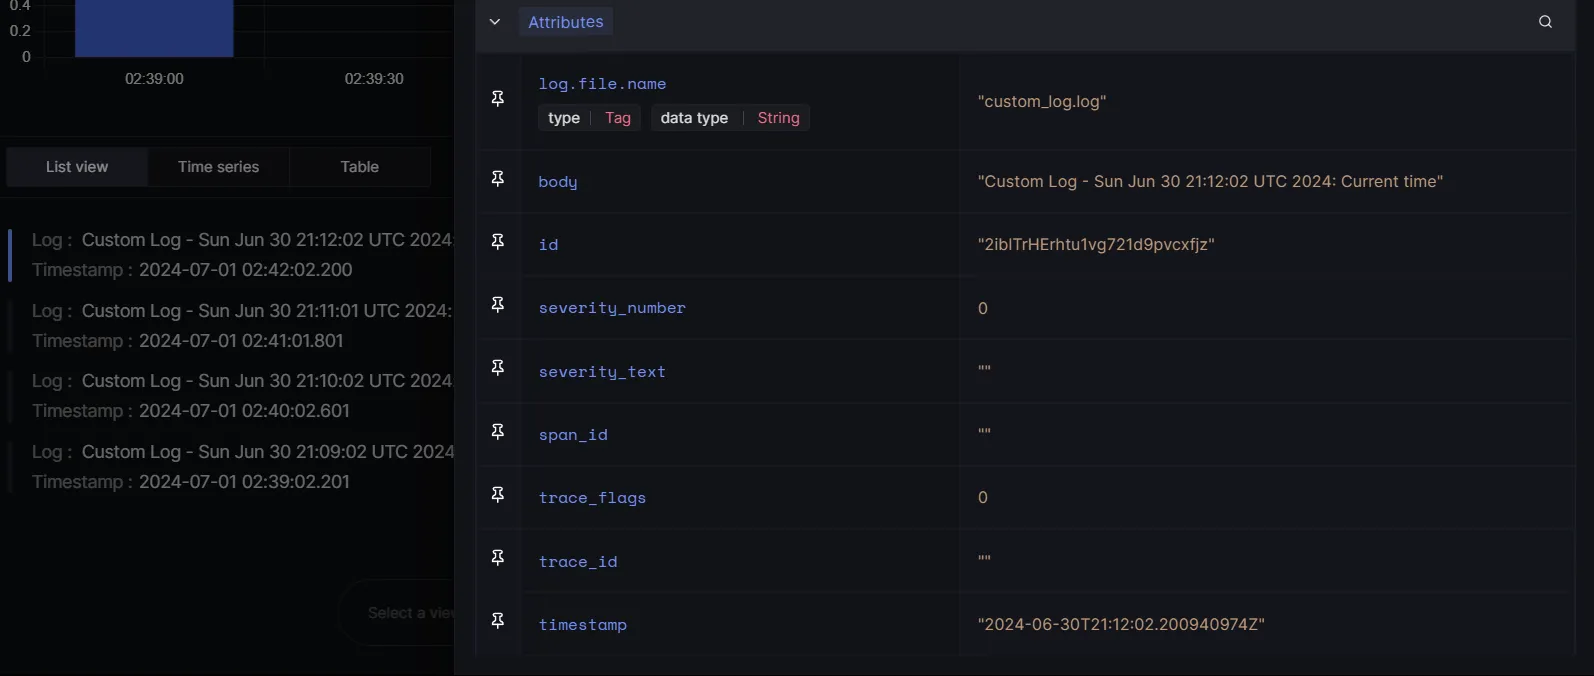
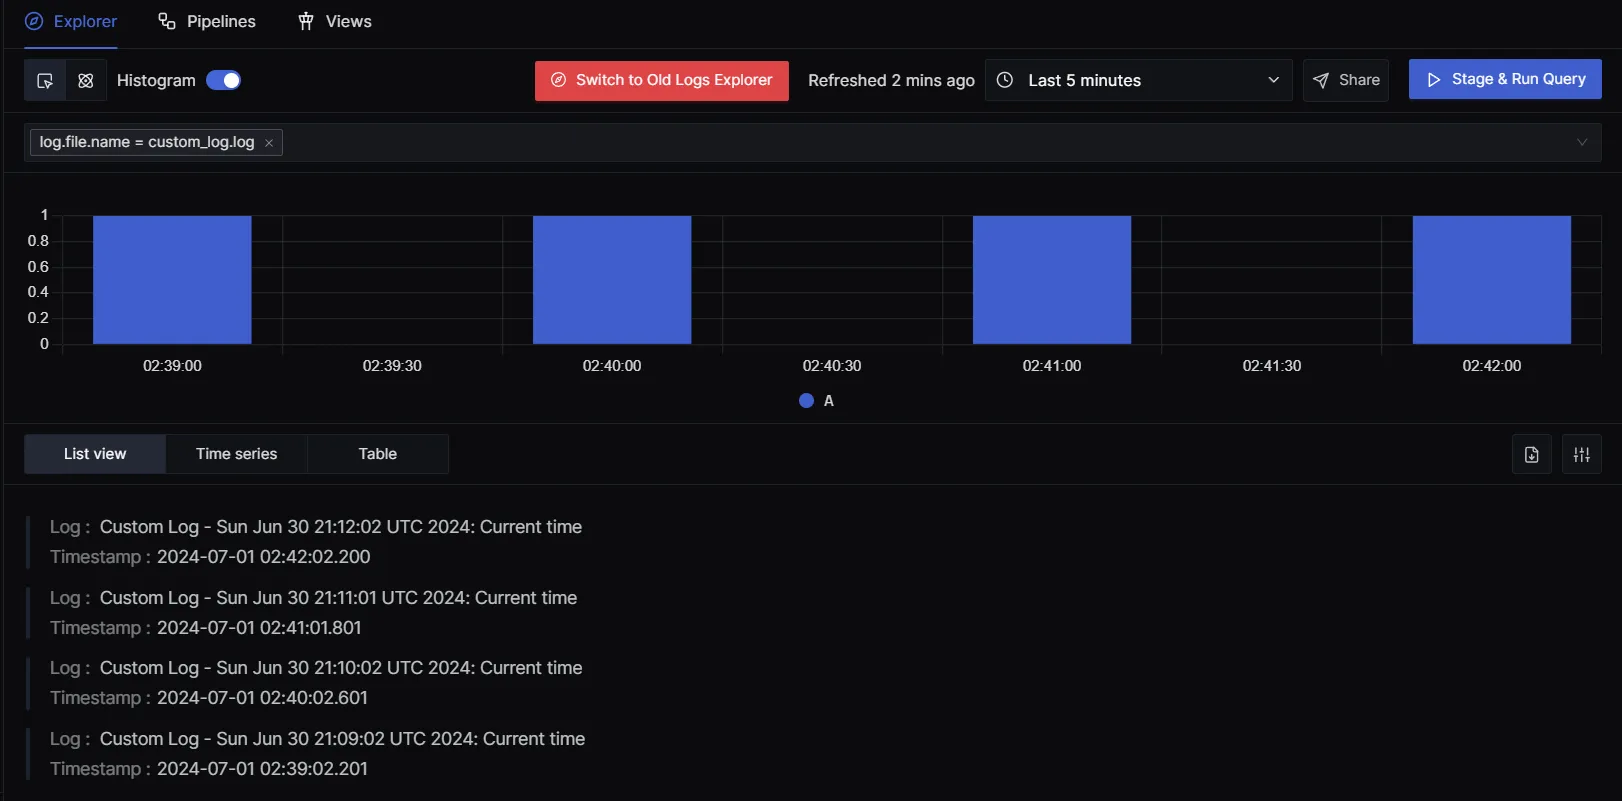
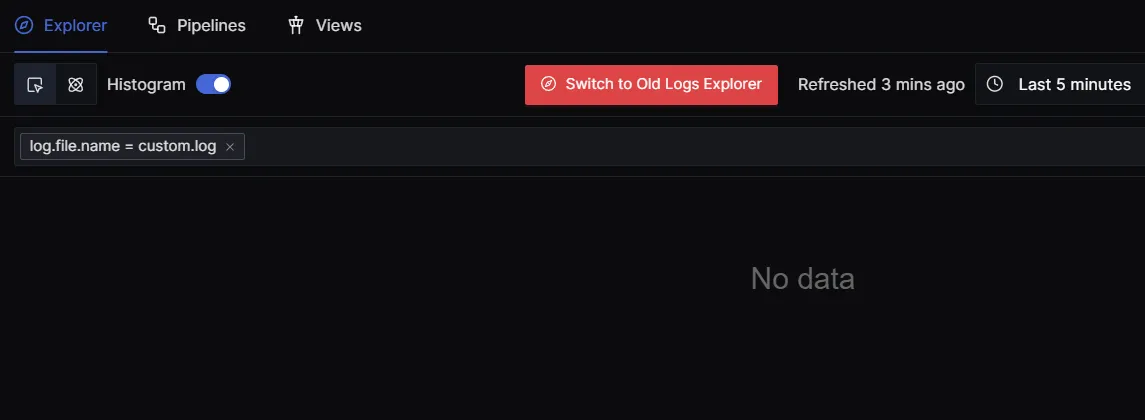
For example, say you redirect output from various files to SigNoz , and now you want to filter logs associated with a particular logfile, you can filter based on query log.file.name=custom_log.log or any other file name.
From the below image, you can see that no data is returned as there are no logs associated with the file name custom.log .
Benefits of Monitoring and Analyzing Crontab Logs with SigNoz
Using SigNoz for Monitoring and Analyzing Crontab Logs offers several benefits:
- Centralized Logging: SigNoz consolidates all your crontab logs in one place, making it easier to monitor and manage them.
- Real-Time Monitoring: Provides real-time insights into the status of your cron jobs, helping you quickly identify and resolve issues.
- Alerting: Configurable alerts notify you of failures or anomalies in your cron jobs, ensuring timely intervention.
- Visualization: Offers intuitive dashboards and visualizations that make it easier to analyze cron job performance and trends.
- Search and Filter: Advanced search and filtering capabilities allow you to quickly find specific logs or patterns.
Conclusion
This guide outlines the importance of crontab logs, their location, and how to effectively access and analyze them for monitoring and troubleshooting automated tasks in Unix-like operating systems.
Some key takeaways:
- Crontab logs are crucial for monitoring and troubleshooting automated tasks in Unix-like operating systems.
- Crontab logs can be found in system log files, often in
/var/log/syslogor/var/log/cron. - Use command-line tools like
grep,tail, andlessto access and analyze crontab logs. - Custom crontab logs can be created by redirecting the output of cron jobs to specific log files.
- To check the success of cron jobs, the exit statuses and timestamps in log files can be examined.
- Crontab logs can be integrated with monitoring tools like SigNoz for enhanced log management and analysis.
FAQs
Where can I see the logs of crontab?
Crontab logs can usually be found in the system log file, typically located at /var/log/cron or /var/log/syslog, depending on your Linux distribution.
How to make a crontab log?
To enable logging for a specific crontab job, you can redirect the output of your cron command to a log file. For example: * * * * * {srcipt path} >> {logfile path} 2>&1
This configuration logs both standard output and error output to the logfile specified in the logfile path.
How to check if a cron job ran successfully?
You can check the cron logs in /var/log/cron or /var/log/syslog to see if your job ran successfully. Look for entries corresponding to your cron job. Additionally, you can redirect the output of your cron job to a log file and check that file for success or error messages.
How to view crontab status?
To view the status of the cron service, you can use the command systemctl status cron .
How do I view cron entries?
To view the cron entries for the current user, use: crontab -l command.
How to check crontab edit history?
Crontab does not maintain an edit history by default. However, you can manually track changes by copying the crontab to a version-controlled file each time you edit it. For example: crontab -l > my_crontab_backup.txt .
Where is the crontab directory?
The crontab directory for user-specific cron jobs is typically located at /var/spool/cron/crontabs/ (on Debian-based systems) or /var/spool/cron/ (on Red Hat-based systems).
How do I view crontab files in Linux?
To display the crontab entries for the current user, use crontab -l .
How to test a crontab job?
To test a crontab job, you can manually run the command defined in the cron job from the terminal to ensure it executes correctly. Additionally, you can set a temporary cron job with a short interval and monitor its execution.
How do I see all cron jobs running?
To see all cron jobs for all users, you can check the contents of /etc/crontab, the /etc/cron.d/ directory, and the user-specific crontab files in /var/spool/cron/ or /var/spool/cron/crontabs/.
How do I check my cron results?
Check the log file you’ve specified in your cron job for output. If no specific log file is defined, check the system logs (/var/log/cron or /var/log/syslog). Look for entries related to your cron job.
Where are crontab files stored?
Crontab files for individual users are typically stored in /var/spool/cron/crontabs/ (Debian-based) or /var/spool/cron/ (Red Hat-based). System-wide crontab files are located at /etc/crontab and /etc/cron.d/.
How to check crontab logs in Oracle Linux?
In Oracle Linux, crontab logs can be found in /var/log/cron or /var/log/messages. Use commands like tail, less, or cat to view these logs.
How do I view cron job logs in cPanel?
In cPanel, you can view cron job logs by navigating to the "Cron Jobs" section and clicking on "View Cron Job Logs." This will show the output of your cron jobs if they have been configured to log their output.
Resources
- Log Management using SigNoz
- Collecting Syslogs using SigNoz
- Collecting Logs from Files and Monitoring using SigNoz

