Database performance can make or break your application. Slow queries, resource bottlenecks, and unexpected downtime can frustrate users and impact your bottom line. How do you ensure your databases run smoothly and efficiently? The answer lies in effective database monitoring.
What is Database Monitoring?
Database monitoring is the practice of tracking, measuring, and analyzing database performance metrics to ensure optimal operation. It involves observing key components such as query performance, resource utilization, and system availability. By implementing database monitoring, you gain insights into your system's health and can identify potential issues before they escalate.
Proactive monitoring allows you to anticipate and prevent problems, while reactive monitoring helps you respond quickly to issues as they arise. Continuous monitoring is crucial for maintaining peak database performance in today's fast-paced digital environment.
Why is Database Monitoring Critical for Businesses?
The impact of database performance on your business cannot be overstated. A well-monitored database system contributes to:
- Improved User Experience: Fast query responses and high availability translate to satisfied users.
- Cost Savings: Early detection of issues prevents expensive downtime and resource waste.
- Enhanced Security: Monitoring helps identify suspicious activities and maintain compliance.
- Informed Decision-Making: Performance data supports capacity planning and system optimization.
Common Database Performance Issues
Understanding common performance problems is key to effective monitoring. Here are some issues you might encounter:
- Slow Query Execution: Poorly optimized queries can bog down your entire system.
- Resource Contention: CPU, memory, or I/O bottlenecks can cause widespread slowdowns.
- Connection Pool Exhaustion: Too many simultaneous connections can lead to request timeouts.
- Data Growth Challenges: As your data expands, indexing and query performance may suffer.
Essential Database Monitoring Metrics
To maintain optimal performance and ensure your database operates efficiently, it's crucial to focus on these critical metrics:
Query Response Time:
The time it takes for a database to execute a query and return results.
- Importance: Directly impacts user experience and application performance.
- Measurement: Usually in milliseconds (ms) or seconds (s).
- Example: If a query typically takes 100ms but suddenly spikes to 500ms, it could indicate an issue.
- Action items: Optimize slow queries, index frequently accessed data, or upgrade hardware if necessary.
Throughput:
The number of queries or transactions the database can process in a given time period.
- Importance: Indicates the database's capacity to handle workload.
- Measurement: Often expressed as queries per second (QPS) or transactions per second (TPS).
- Example: A system handling 1000 QPS during peak hours but struggling at 1200 QPS might need optimization.
- Action items: Load balancing, query optimization, or scaling resources to handle increased demand.
Resource Usage:
The utilization of system resources like CPU, memory, and disk I/O.
- Importance: Helps identify bottlenecks and capacity issues.
- Measurement:
- CPU: Percentage of utilization
- Memory: Amount used vs. total available
- Disk I/O: Read/write operations per second
- Example: Consistently high CPU usage (e.g., >80%) might indicate the need for query optimization or hardware upgrades.
- Action items: Optimize resource-intensive queries, add more RAM, or upgrade to faster storage solutions.
Cache Performance:
Efficiency of the database's caching mechanisms.
- Importance: Good caching reduces disk I/O and improves query performance.
- Measurement:
- Cache hit ratio: Percentage of requests served from cache
- Buffer pool efficiency: How effectively memory is used for caching
- Example: A cache hit ratio of 95% is generally good; if it drops to 70%, investigate the cause.
- Action items: Adjust cache size, optimize query patterns to improve cache utilization.
Transaction Logs:
Records of database transactions and changes.
- Importance: Critical for data integrity, recovery, and replication.
- Measurement:
- Log growth rate: How quickly transaction logs are filling up
- Replication lag: Delay between primary and secondary servers in replicated setups
- Example: If log growth suddenly increases from 1GB/hour to 5GB/hour, it could indicate unusual activity or issues.
- Action items: Monitor log space, optimize log backup frequency, investigate causes of increased log activity.
By consistently monitoring these metrics, you can:
- Proactively identify performance issues before they impact users
- Make informed decisions about scaling and optimization
- Ensure your database remains reliable and responsive under varying workloads
Remember, the specific thresholds and importance of each metric may vary depending on your particular database system, application requirements, and business needs. Regular analysis and adjustment of your monitoring strategy is key to maintaining a healthy database environment.
How to Implement Effective Database Monitoring
Implementing a robust monitoring strategy involves several key steps:
- Establish Baselines: Baseline performance metrics serve as a benchmark for normal database behavior, making them the foundation of effective monitoring. Key metrics to establish include resource utilization, database activity, and storage performance.
- Configure Alerts: Define thresholds for critical metrics to enable proactive issue detection.
- Automate Monitoring: Use tools to continuously track performance without manual intervention.
- Adapt to Your Environment: Tailor your monitoring approach for on-premises, cloud, or hybrid setups.
Database Monitoring Tools and Techniques
A variety of tools can help you monitor your databases effectively:
- Built-in Database Tools: Many database systems offer native monitoring capabilities. Examples include MySQL Workbench, pgAdmin, and Oracle Enterprise Manager.
- Third-Party Solutions: Comprehensive monitoring platforms provide advanced features and cross-database support. Examples include Datadog, New Relic, and App Dynamics.
- Open-Source Options: Tools like SigNoz, Prometheus, and Grafana offer powerful monitoring capabilities at no cost.
When selecting a monitoring solution, look for features such as real-time alerting, customizable dashboards, and integration with your existing IT infrastructure.
Advanced Database Monitoring Strategies
To take your monitoring to the next level, consider these advanced techniques:
Query Plan Analysis
It involves examining the execution plans of database queries to identify inefficiencies and optimize performance. Execution plans provide a detailed roadmap of how the database processes a query, including the order of operations, the use of indexes, and the estimated cost of each step.
- Identifying Inefficient Queries: By analyzing execution plans, you can pinpoint queries that are consuming excessive resources or taking longer than expected to execute.
- Index Optimization: Execution plans can reveal whether indexes are being used effectively. Optimizing indexes can significantly improve query performance.
- Execution Path Optimization: Understanding the sequence of operations and their costs allows you to restructure queries for more efficient execution paths.
Trend Analysis and Predictive Monitoring Techniques
Trend analysis involves examining historical performance data to identify patterns and predict future behavior.
- Historical Data Analysis: By reviewing past performance metrics, you can identify trends that indicate normal operation and deviations that may signal emerging problems.
- Forecasting Future Performance: Predictive models can project future performance based on historical data, helping you anticipate and mitigate issues before they impact users.
- Anomaly Detection: Trend analysis can highlight anomalies, enabling early detection of abnormal performance that may indicate underlying issues.
Machine Learning Integration
Machine learning (ML) techniques can enhance database monitoring by providing more accurate and sophisticated performance forecasting.
- Pattern Recognition: ML algorithms can recognize complex patterns in performance data that may be missed by traditional monitoring techniques.
- Predictive Analytics: Machine learning models can predict future performance issues based on historical data, allowing for proactive management.
- Anomaly Detection: Advanced ML algorithms can detect subtle anomalies in real time, providing early warnings of potential problems.
Holistic Monitoring
A holistic approach to monitoring involves correlating database metrics with application and infrastructure data for a complete picture.
- End-to-End Visibility: By integrating database monitoring with application performance management (APM) and infrastructure monitoring, you can achieve a complete view of the entire technology stack.
- Root Cause Analysis: Correlating metrics across different layers helps identify the root cause of performance issues, whether they originate in the database, the application, or the underlying infrastructure.
- Performance Optimization: Understanding the interplay between database performance and other system components allows for more effective optimization and troubleshooting.
Database Monitoring Using SigNoz
Keeping your databases performing well is crucial for any data-driven business. SigNoz, an open-source tool built on OpenTelemetry, helps you monitor, analyze, and visualize your database performance. This section will guide you through setting up and using SigNoz for effective monitoring of a PostgreSQL database.
Setting up SigNoz
SigNoz cloud is the easiest way to run SigNoz. Sign up for a free account and get 30 days of unlimited access to all features.
You can also install and self-host SigNoz yourself since it is open-source. With 19,000+ GitHub stars, open-source SigNoz is loved by developers. Find the instructions to self-host SigNoz.
Prerequisites
To configure metrics and logs collection for a Postgres server, you need the following:
Ensure that the Postgres server is running a supported version
Postgres versions 9.6+ are supported.
You can use the following SQL statement to determine the server version
SELECT version();If collecting metrics, ensure that there is a Postgres user with the required permissions
To create a monitoring user for Postgres versions 10+, run:
create user monitoring with password '<PASSWORD>';
grant pg_monitor to monitoring;
grant SELECT ON pg_stat_database to monitoring;
To create a monitoring user for Postgres versions >= 9.6 and <10, run:
create user monitoring with password '<PASSWORD>';
grant SELECT ON pg_stat_database to monitoring;
Ensure that an OTEL collector is running in your deployment environment
If needed, please install an OTEL Collector, if already installed, ensure that the collector version is v0.88.0 or newer.
Collect Postgres Metrics
You can configure Postgres metrics collection by providing the required collector config to your collector.
Step 1: Create the Collector Config File
Save the following config for collecting Postgres metrics in a file named postgres-metrics-collection-config.yaml
receivers:
  postgresql:
    # The endpoint of the postgresql server. Whether using TCP or Unix sockets, this value should be host:port. If transport is set to unix, the endpoint will internally be translated from host:port to /host.s.PGSQL.port
    endpoint: ${env:POSTGRESQL_ENDPOINT}
    # The frequency at which to collect metrics from the Postgres instance.
    collection_interval: 60s
    # The username used to access the postgres instance
    username: ${env:POSTGRESQL_USERNAME}
    # The password used to access the postgres instance
    password: ${env:POSTGRESQL_PASSWORD}
    # The list of databases for which the receiver will attempt to collect statistics. If an empty list is provided, the receiver will attempt to collect statistics for all non-template databases
    databases:
      - <YOUR DATABASE 1>
      - <YOUR DATABASE 2>
    # # Defines the network to use for connecting to the server. Valid Values are `tcp` or `unix`
    # transport: tcp
    tls:
      # set to false if SSL is enabled on the server
      insecure: true
    #   ca_file: /etc/ssl/certs/ca-certificates.crt
    #   cert_file: /etc/ssl/certs/postgres.crt
    #   key_file: /etc/ssl/certs/postgres.key
    metrics:
      postgresql.database.locks:
        enabled: true
      postgresql.deadlocks:
        enabled: true
      postgresql.sequential_scans:
        enabled: true

processors:
  # enriches the data with additional host information
  # see https://github.com/open-telemetry/opentelemetry-collector-contrib/tree/main/processor/resourcedetectionprocessor#resource-detection-processor
  resourcedetection/system:
    # add additional detectors if needed
    detectors: ["system"]
    system:
      hostname_sources: ["os"]

exporters:
  # export to SigNoz cloud
  otlp/postgres:
    endpoint: "${env:OTLP_DESTINATION_ENDPOINT}"
    tls:
      insecure: false
    headers:
      "signoz-ingestion-key": "${env:SIGNOZ_INGESTION_KEY}"

  # export to local collector
  # otlp/postgres:
  #   endpoint: "localhost:4317"
  #   tls:
  #     insecure: true

service:
  pipelines:
    metrics/postgresql:
      receivers: [postgresql]
      # note: remove this processor if the collector host is not running on the same host as the postgres instance
      processors: [resourcedetection/system]
      exporters: [otlp/postgres]
Step 2: Set Environment Variables
Set the following environment variables in the otelcol-contrib folder:
# password for Postgres monitoring user"
export POSTGRESQL_USERNAME="monitoring"

# password for Postgres monitoring user"
export POSTGRESQL_PASSWORD="<PASSWORD>"

# Postgres endpoint reachable from the otel collector"
export POSTGRESQL_ENDPOINT="host:port"

# region specific SigNoz cloud ingestion endpoint
export OTLP_DESTINATION_ENDPOINT="ingest.{region}.signoz.cloud:443"

# your SigNoz ingestion key
export SIGNOZ_INGESTION_KEY="<your-signoz-ingestion-key>"
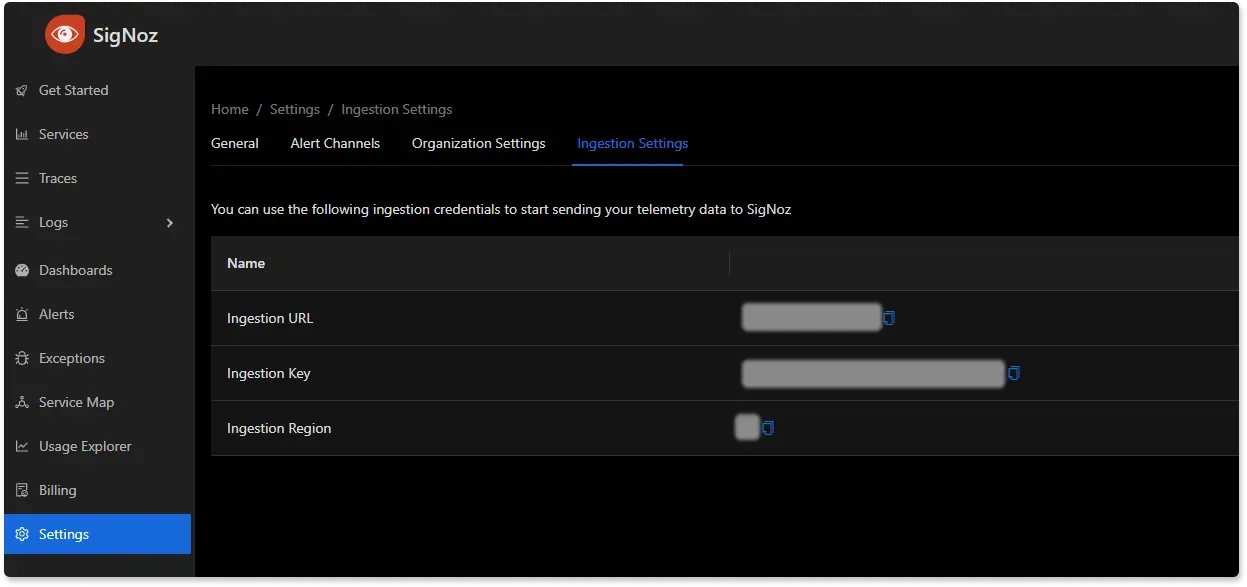
Replace {region} with the region where you have your SigNoz cloud account and <your-signoz-ingestion-key> with your account ingestion key. You can find these values in your SigNoz account. Go to Settings > Ingestion Settings.

Step 3: Start the Collector
Run the following command in the otelcol-contrib folder directory:
./otelcol-contrib --config postgres-metrics-collection-config.yaml
Monitoring with the SigNoz Dashboard
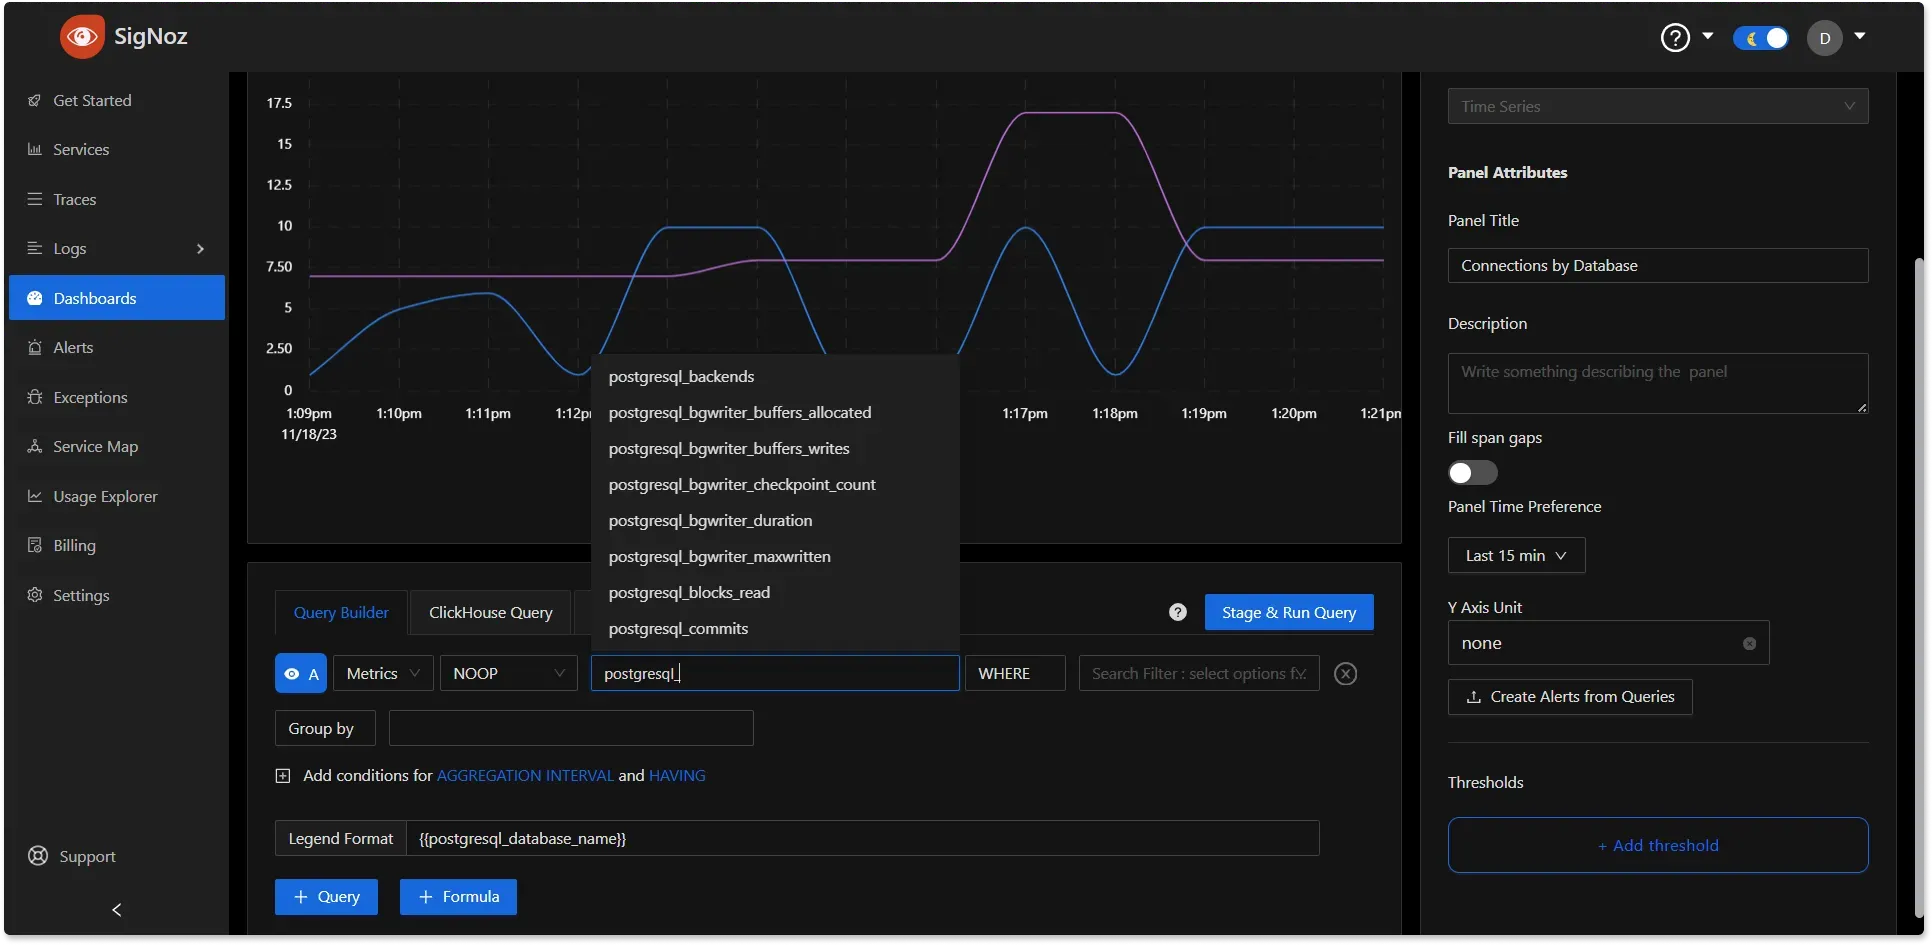
Once the above setup is done, you will be able to access the metrics in the SigNoz dashboard. Go to the Dashboards tab in the SigNoz UI and try adding a new panel. You can learn how to create dashboards in SigNoz here. When you begin to load your database, the metrics will be automatically generated, allowing you to monitor your database metrics in real-time.
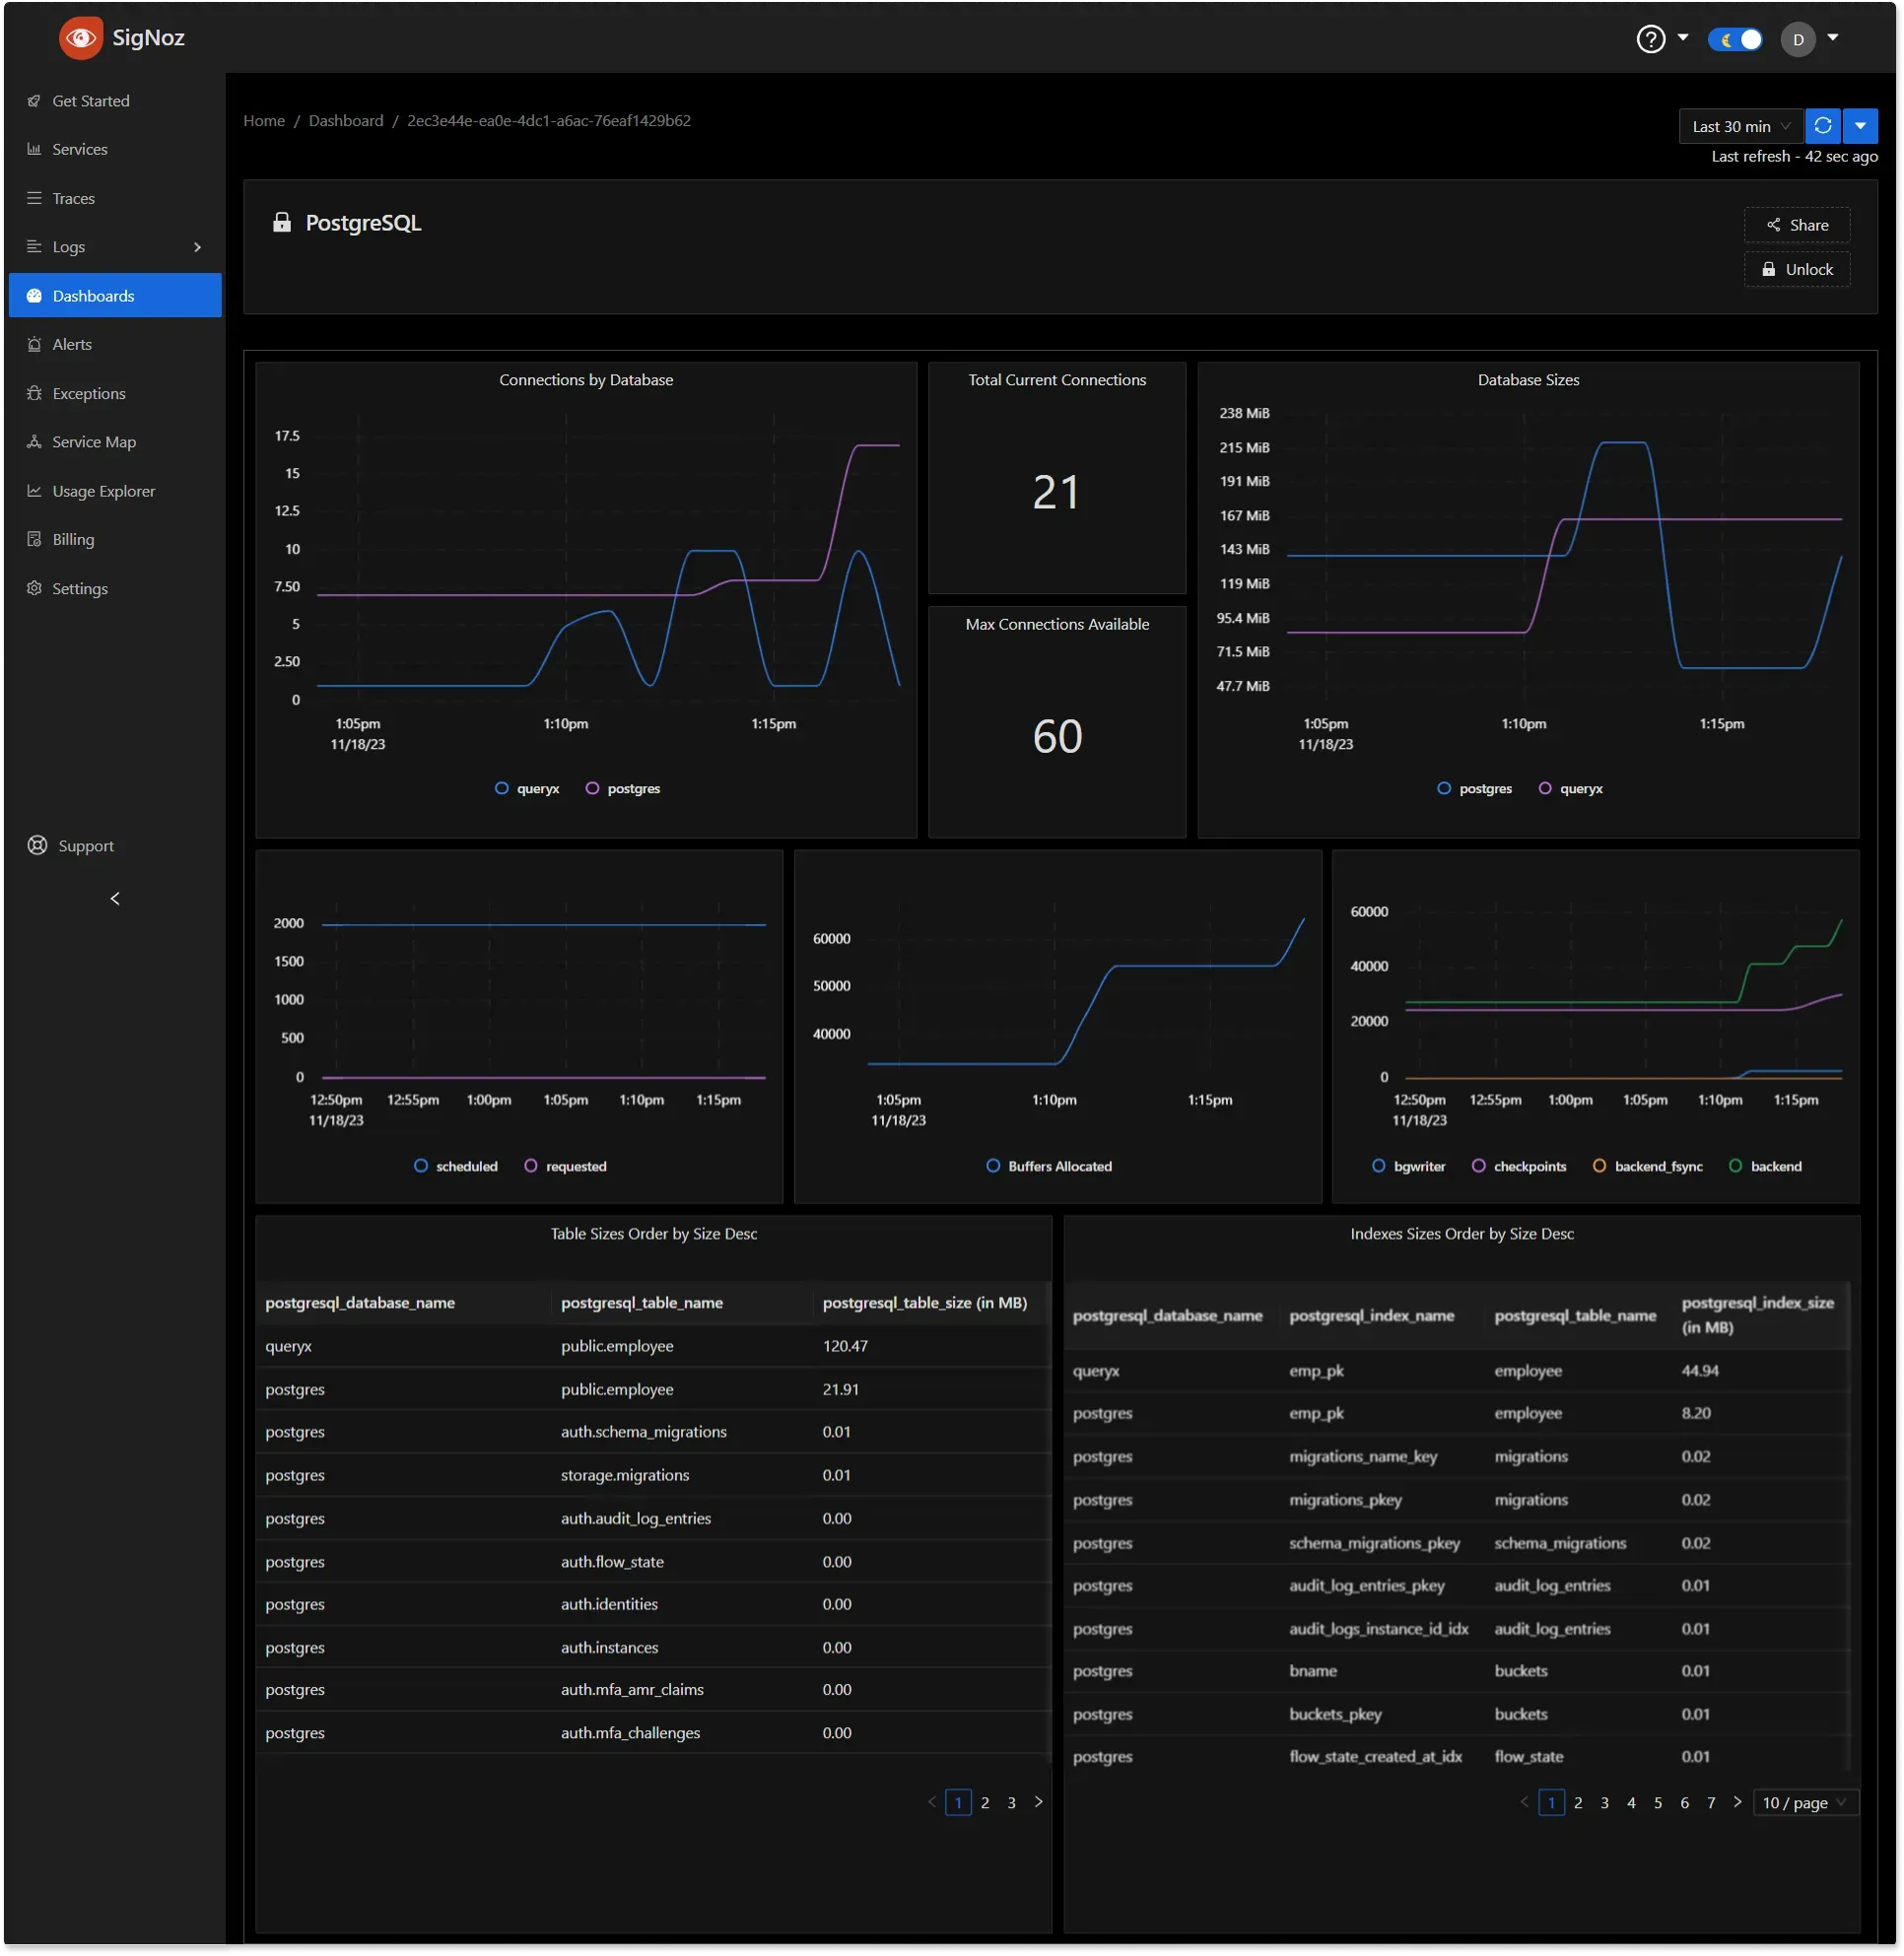
PostgreSQL Metrics

If you want to get started quickly with PostgreSQL monitoring, you can load this JSON dashboard config in the SigNoz dashboard UI.
PostgreSQL Basic Metrics Dashboard

You can also create alerts on any metric. Learn how to create alerts here.
Overcoming Database Monitoring Challenges
As you implement your monitoring strategy, you may face several challenges:
- Scale: Monitoring large, distributed databases requires careful planning and resource allocation.
- Performance Impact: Balance comprehensive monitoring with minimal overhead on your production systems.
- Security Concerns: Ensure your monitoring practices comply with data protection regulations.
- Technology Diversity: Develop a unified monitoring approach for different database technologies in your stack.
Key Takeaways
- Database monitoring is essential for maintaining performance and preventing costly downtime.
- Focus on key metrics like query response time, resource usage, and cache performance.
- Implement a mix of proactive and reactive monitoring strategies.
- Use automated tools and advanced techniques to enhance your monitoring effectiveness.
- Address challenges such as scale, security, and diverse technologies in your monitoring approach.
FAQs
What is the difference between database monitoring and database management?
Database monitoring focuses on observing and analyzing performance metrics, while database management encompasses broader tasks such as configuration, security, and data organization. Monitoring is a crucial component of effective database management.
How often should database performance be monitored?
Continuous monitoring is ideal for production databases. Set up real-time alerts for critical issues and schedule regular performance reviews to identify long-term trends.
Can database monitoring help with capacity planning?
Yes, database monitoring provides valuable insights into resource utilization trends. This data helps you anticipate future needs and make informed decisions about scaling your database infrastructure.
What are the security implications of database monitoring?
While monitoring is crucial for identifying security threats, it's important to implement monitoring practices that don't compromise data privacy. Ensure your monitoring tools and processes comply with relevant security standards and regulations.


