Docker logs offer real-time insights into container behavior and status. By using the docker log command you can stream and analyze these logs to monitor your applications. These logs are crucial for monitoring activities, detecting anomalies, troubleshooting issues, and maintaining optimal performance.
This article covers Docker logs, how they can be tailed, the limitations of the tail command, and how you can monitor these logs.
What are Docker Logs?
Docker logs are a record of the output generated by applications running inside Docker containers. These logs can include standard output (stdout) and standard error (stderr) streams from the application. They provide insights into what is happening inside the container, which is crucial for troubleshooting, monitoring, and understanding the behavior of applications running in Docker environments.
Benefits of Monitoring Docker Logs
Monitoring Docker logs offers several key benefits:
- Debugging and Troubleshooting: Logs provide detailed information about errors and issues, making it easier to diagnose and fix problems.
- Performance Monitoring: By analyzing logs, you can identify performance bottlenecks and optimize your applications.
- Security Auditing: Logs can help detect suspicious activities and ensure compliance with security policies.
- Operational Insights: Continuous log monitoring helps maintain the overall health and reliability of your containerized applications.
How to Tail Docker Logs
Tailing refers to the practice of actively monitoring the most recent additions to a file, typically a log file, as they are being written. When you tail a file, you watch the end of the file for new data that is received. Tailing Docker logs is an essential monitoring task for debugging applications running in containers. You can achieve this using the docker logs command with the -f (follow) flag.
- Tailing a specific Container’s Logs
To tail logs from a container, first get the container ID or name of the container you want to tail the logs for. You can list all running containers with:
docker ps
Use the docker logs command with the f option to tail the logs of a specific container. Replace <container_id_or_name> with the actual container ID or name.
docker logs -f <container_id_or_name>
- Tailing a Specific Number of Lines
You can tail a specific number of lines from the end of the logs using the -tail option. For example, to tail the last 100 lines:
docker logs -f --tail 100 <container_id_or_name>
- Tailing Logs of All Containers
If you have containers running with Docker Compose and want to tail logs from all running containers, you can use:
docker-compose logs -f <container_id_or_name>
- Using the
--sinceFlag
You can view Docker container logs generated from a specific date and time onwards using the —-since flag:
docker logs -f --since "yyyy-mm-ddThh:mm:ss" <container_id_or_name>
The format for the timestamp is yyyy-mm-ddThh:mm:ss (year-month-dayThour:minute:second).
- Using the
--untilFlag
You can view Docker container logs up to a specific time using the --until flag:
docker logs -f --until "yyyy-mm-ddThh:mm:ss" <container_id>
- Using GREP
You can filter logs with a keyword using the grep command. grepallows you to dynamically filter Docker container logs for specific content by piping (|) the output of docker logs -f <container_id> (which fetches the logs of a specific container in real-time with the -f flag) into the grep command.
docker logs -f <container_id> | grep "error"
Limitations of the Docker Logs Tail Command
The docker logs -f command is useful for monitoring, but it also has several limitations:
- No Log Rotation Management: The
docker logs -fcommand does not manage log rotation. As logs grow, they can consume significant disk space, potentially filling up the disk and causing performance issues or application failures. In production, this may cause problems as large log files can slow down the system, making it difficult to access or process logs efficiently. - Limited Log Storage: By default, Docker stores logs on the host filesystem. If logs are large or grow quickly, this can consume substantial disk space. Docker’s default logging driver does not provide built-in mechanisms for archiving or long-term storage.
- Limited Built-in Filtering: While the
docker logscommand itself lacks advanced filtering options (e.g., by log level, keyword, or timestamp), you can pipe its output to tools likegrep,awk, orsedfor basic filtering. However, this approach may not be ideal for large log volumes or complex filtering needs. - Single Container Focus:
docker logs -fonly follows logs for a single container at a time. If you have a multi-container application, you need to run separate commands for each container, which can be cumbersome. - No Built-in Alerting: The command does not support alerting. You cannot set up alerts based on log contents or log patterns. You will need additional tools or scripts to monitor logs and generate alerts.
Monitoring Docker Logs with SigNoz
To effectively monitor Docker logs and overcome the limitations of the docker logs -f command, using an advanced observability platform like SigNoz can be highly beneficial. SigNoz is an open-source observability tool that provides end-to-end monitoring, troubleshooting, and alerting capabilities for your applications and infrastructure.
Here's how you can leverage SigNoz for monitoring Docker logs:
- Set Up your Docker Containers
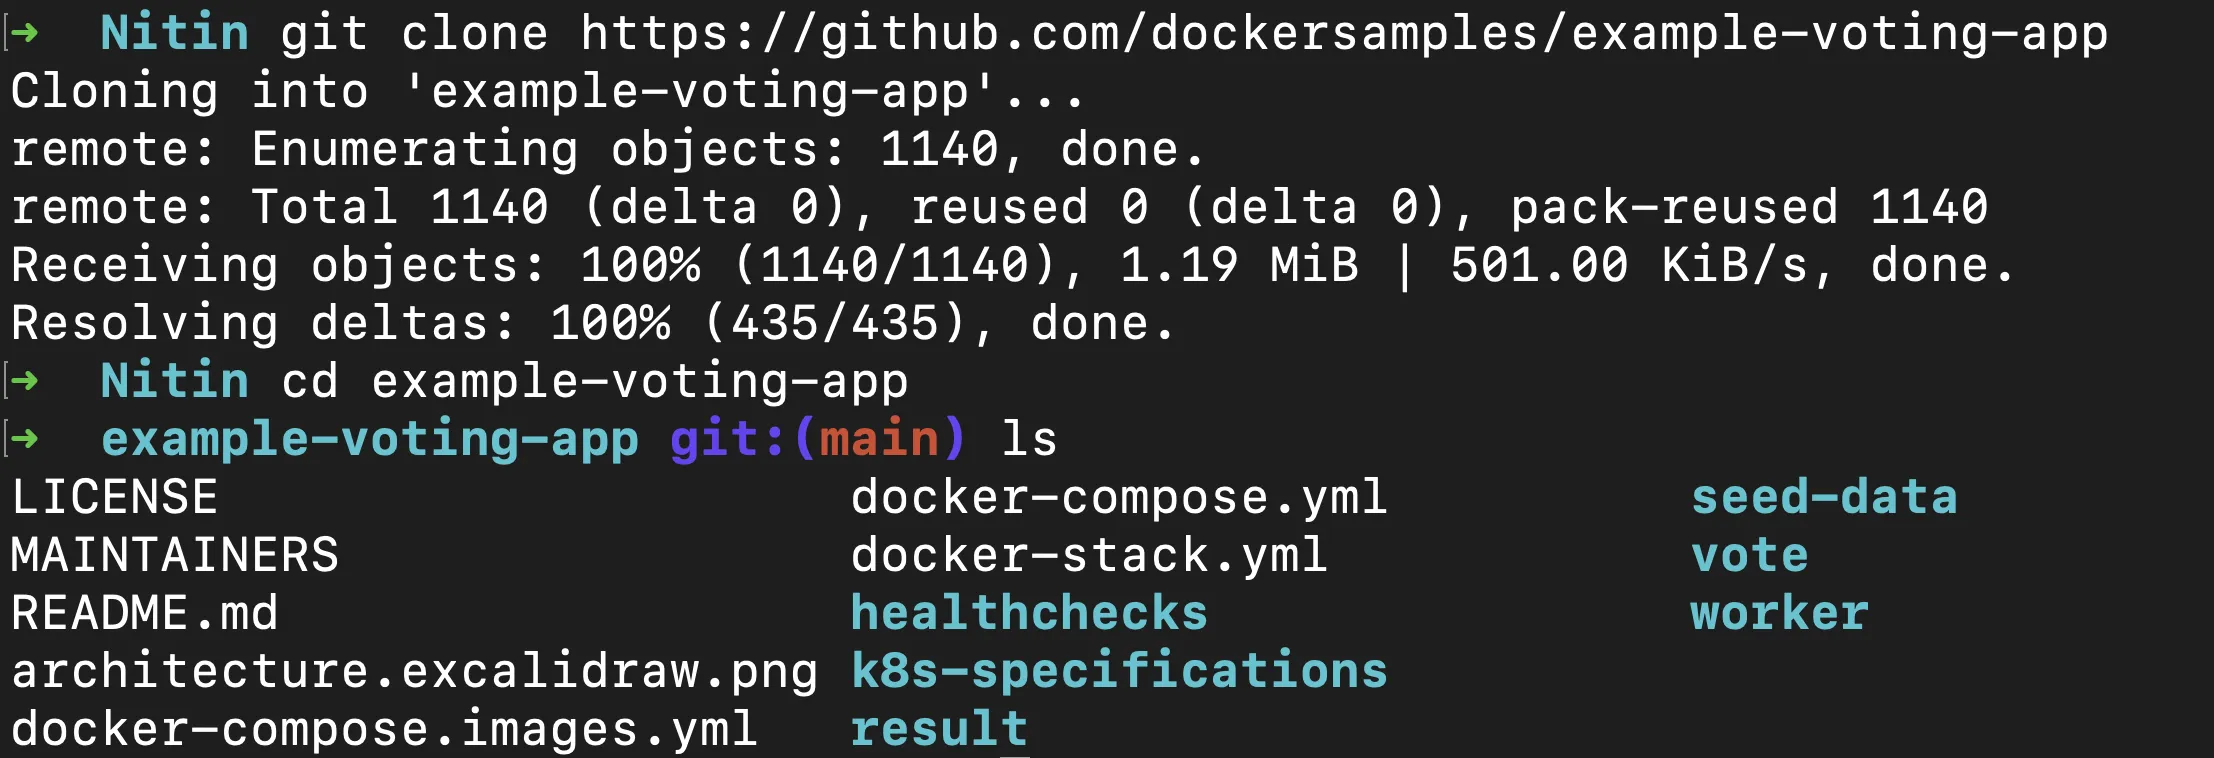
A project folder has been provided with Docker Compose configuration that sets up a sample application. Clone the repository and navigate to the project directory.
git clone <https://github.com/dockersamples/example-voting-app>
cd example-voting-app

Git commands to clone the repo
Note: Skip this step if you have your own running Docker containers and Docker Compose configuration.
- Create a SigNoz Cloud Account
SigNoz Cloud provides a 30-day free trial period. This demo uses SigNoz Cloud, but you can choose to use the open-source version.
- Add .env File to the Root Project Folder
In the root directory of your project folder, create a new file named .env and paste the below into it:
OTEL_COLLECTOR_ENDPOINT=ingest.{region}.signoz.cloud:443
SIGNOZ_INGESTION_KEY=***
OTEL_COLLECTOR_ENDPOINT: Specifies the address of the SigNoz collector where your application will send its telemetry data.SIGNOZ_INGESTION_KEY: Authenticates your application with the SigNoz collector.
Note: Replace {region} with your SigNoz region and SIGNOZ_INGESTION_KEY with your actual ingestion key.
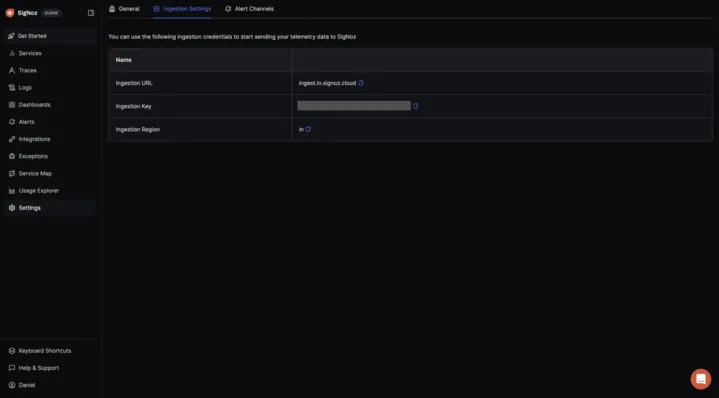
To obtain the SigNoz ingestion key and region, navigate to the “Settings” page in your SigNoz dashboard. You will find the ingestion key and region under the “Ingestion Settings” tab.

SigNoz Ingestion Settings Page
- Set Up the OpenTelemetry Collector Config
An OTel Collector is a vendor-agnostic service that receives, processes, and exports telemetry data (metrics, logs, and traces) from various sources to various destinations.
In the root of your project folder, create a file otel-collector-config.yaml and paste the below contents in it:
receivers:
  tcplog/docker:
    listen_address: "0.0.0.0:2255"
    operators:
      - type: regex_parser
        regex: '^<([0-9]+)>[0-9]+ (?P<timestamp>[0-9]{4}-[0-9]{2}-[0-9]{2}T[0-9]{2}:[0-9]{2}:[0-9]{2}(\\.[0-9]+)?([zZ]|([\\+-])([01]\\d|2[0-3]):?([0-5]\\d)?)?) (?P<container_id>\\S+) (?P<container_name>\\S+) [0-9]+ - -( (?P<body>.*))?'
        timestamp:
          parse_from: attributes.timestamp
          layout: "%Y-%m-%dT%H:%M:%S.%LZ"
      - type: move
        from: attributes["body"]
        to: body
      - type: remove
        field: attributes.timestamp
      - type: filter
        id: signoz_logs_filter
        expr: 'attributes.container_name matches "^signoz-(logspout|frontend|alertmanager|query-service|otel-collector|otel-collector-metrics|clickhouse|zookeeper)"'

processors:
  batch:
    send_batch_size: 10000
    send_batch_max_size: 11000
    timeout: 10s

exporters:
  otlp:
    endpoint: ${env:OTEL_COLLECOTR_ENDPOINT}
    tls:
      insecure: false
    headers:
      "signoz-ingestion-key": ${env:SIGNOZ_INGESTION_KEY}

service:
  pipelines:
    logs:
      receivers: [tcplog/docker]
      processors: [batch]
      exporters: [otlp]
The above configuration sets up the OpenTelemetry Collector to listen on 0.0.0.0:2255 for incoming Docker logs over TCP and to parse and filter the logs using a regex parser. The logs are then processed in batches for optimized handling and exported securely via OTLP to the OTEL_COLLECTOR_ENDPOINT specified in your .env file.
- Add Services to the Docker Compose File
In your existing Docker Compose file, add the below configuration:
  otel-collector:
    image: signoz/signoz-otel-collector:${OTELCOL_TAG:-0.79.7}
    container_name: signoz-otel-collector
    command:
      [
        "--config=/etc/otel-collector-config.yaml",
        "--feature-gates=-pkg.translator.prometheus.NormalizeName"
      ]
    volumes:
      - ./otel-collector-config.yaml:/etc/otel-collector-config.yaml
    environment:
      - OTEL_RESOURCE_ATTRIBUTES=host.name=signoz-host,os.type=linux
      - DOCKER_MULTI_NODE_CLUSTER=false
      - LOW_CARDINAL_EXCEPTION_GROUPING=false
    env_file:
      - ./.env
    ports:
      - "4317:4317" # OTLP gRPC receiver
      - "4318:4318" # OTLP HTTP receiver
    restart: on-failure

  logspout:
    image: "gliderlabs/logspout:v3.2.14"
    container_name: signoz-logspout
    volumes:
      - /etc/hostname:/etc/host_hostname:ro
      - /var/run/docker.sock:/var/run/docker.sock
    command: syslog+tcp://otel-collector:2255
    depends_on:
      - otel-collector
    restart: on-failure
The above Docker Compose configuration sets up two services:
otel-collector:- Uses the Signoz OpenTelemetry Collector image.
- Mounts the
otel-collector-config.yamlfile into the container. - Uses environment variables from the
.envfile for configuration. - Exposes ports
4317(OTLP gRPC receiver) and4318(OTLP HTTP receiver).
logspout:- Uses the
gliderlabs/logspoutimage to collect logs from other Docker containers. - Forwards logs to the
otel-collectorservice on port2255. - Depends on the
otel-collectorservice, ensuring it starts first so it can forward the logs to it.
- Uses the
- Start the Docker Compose file
Run the below command in your terminal to start the containers:
docker compose up -d
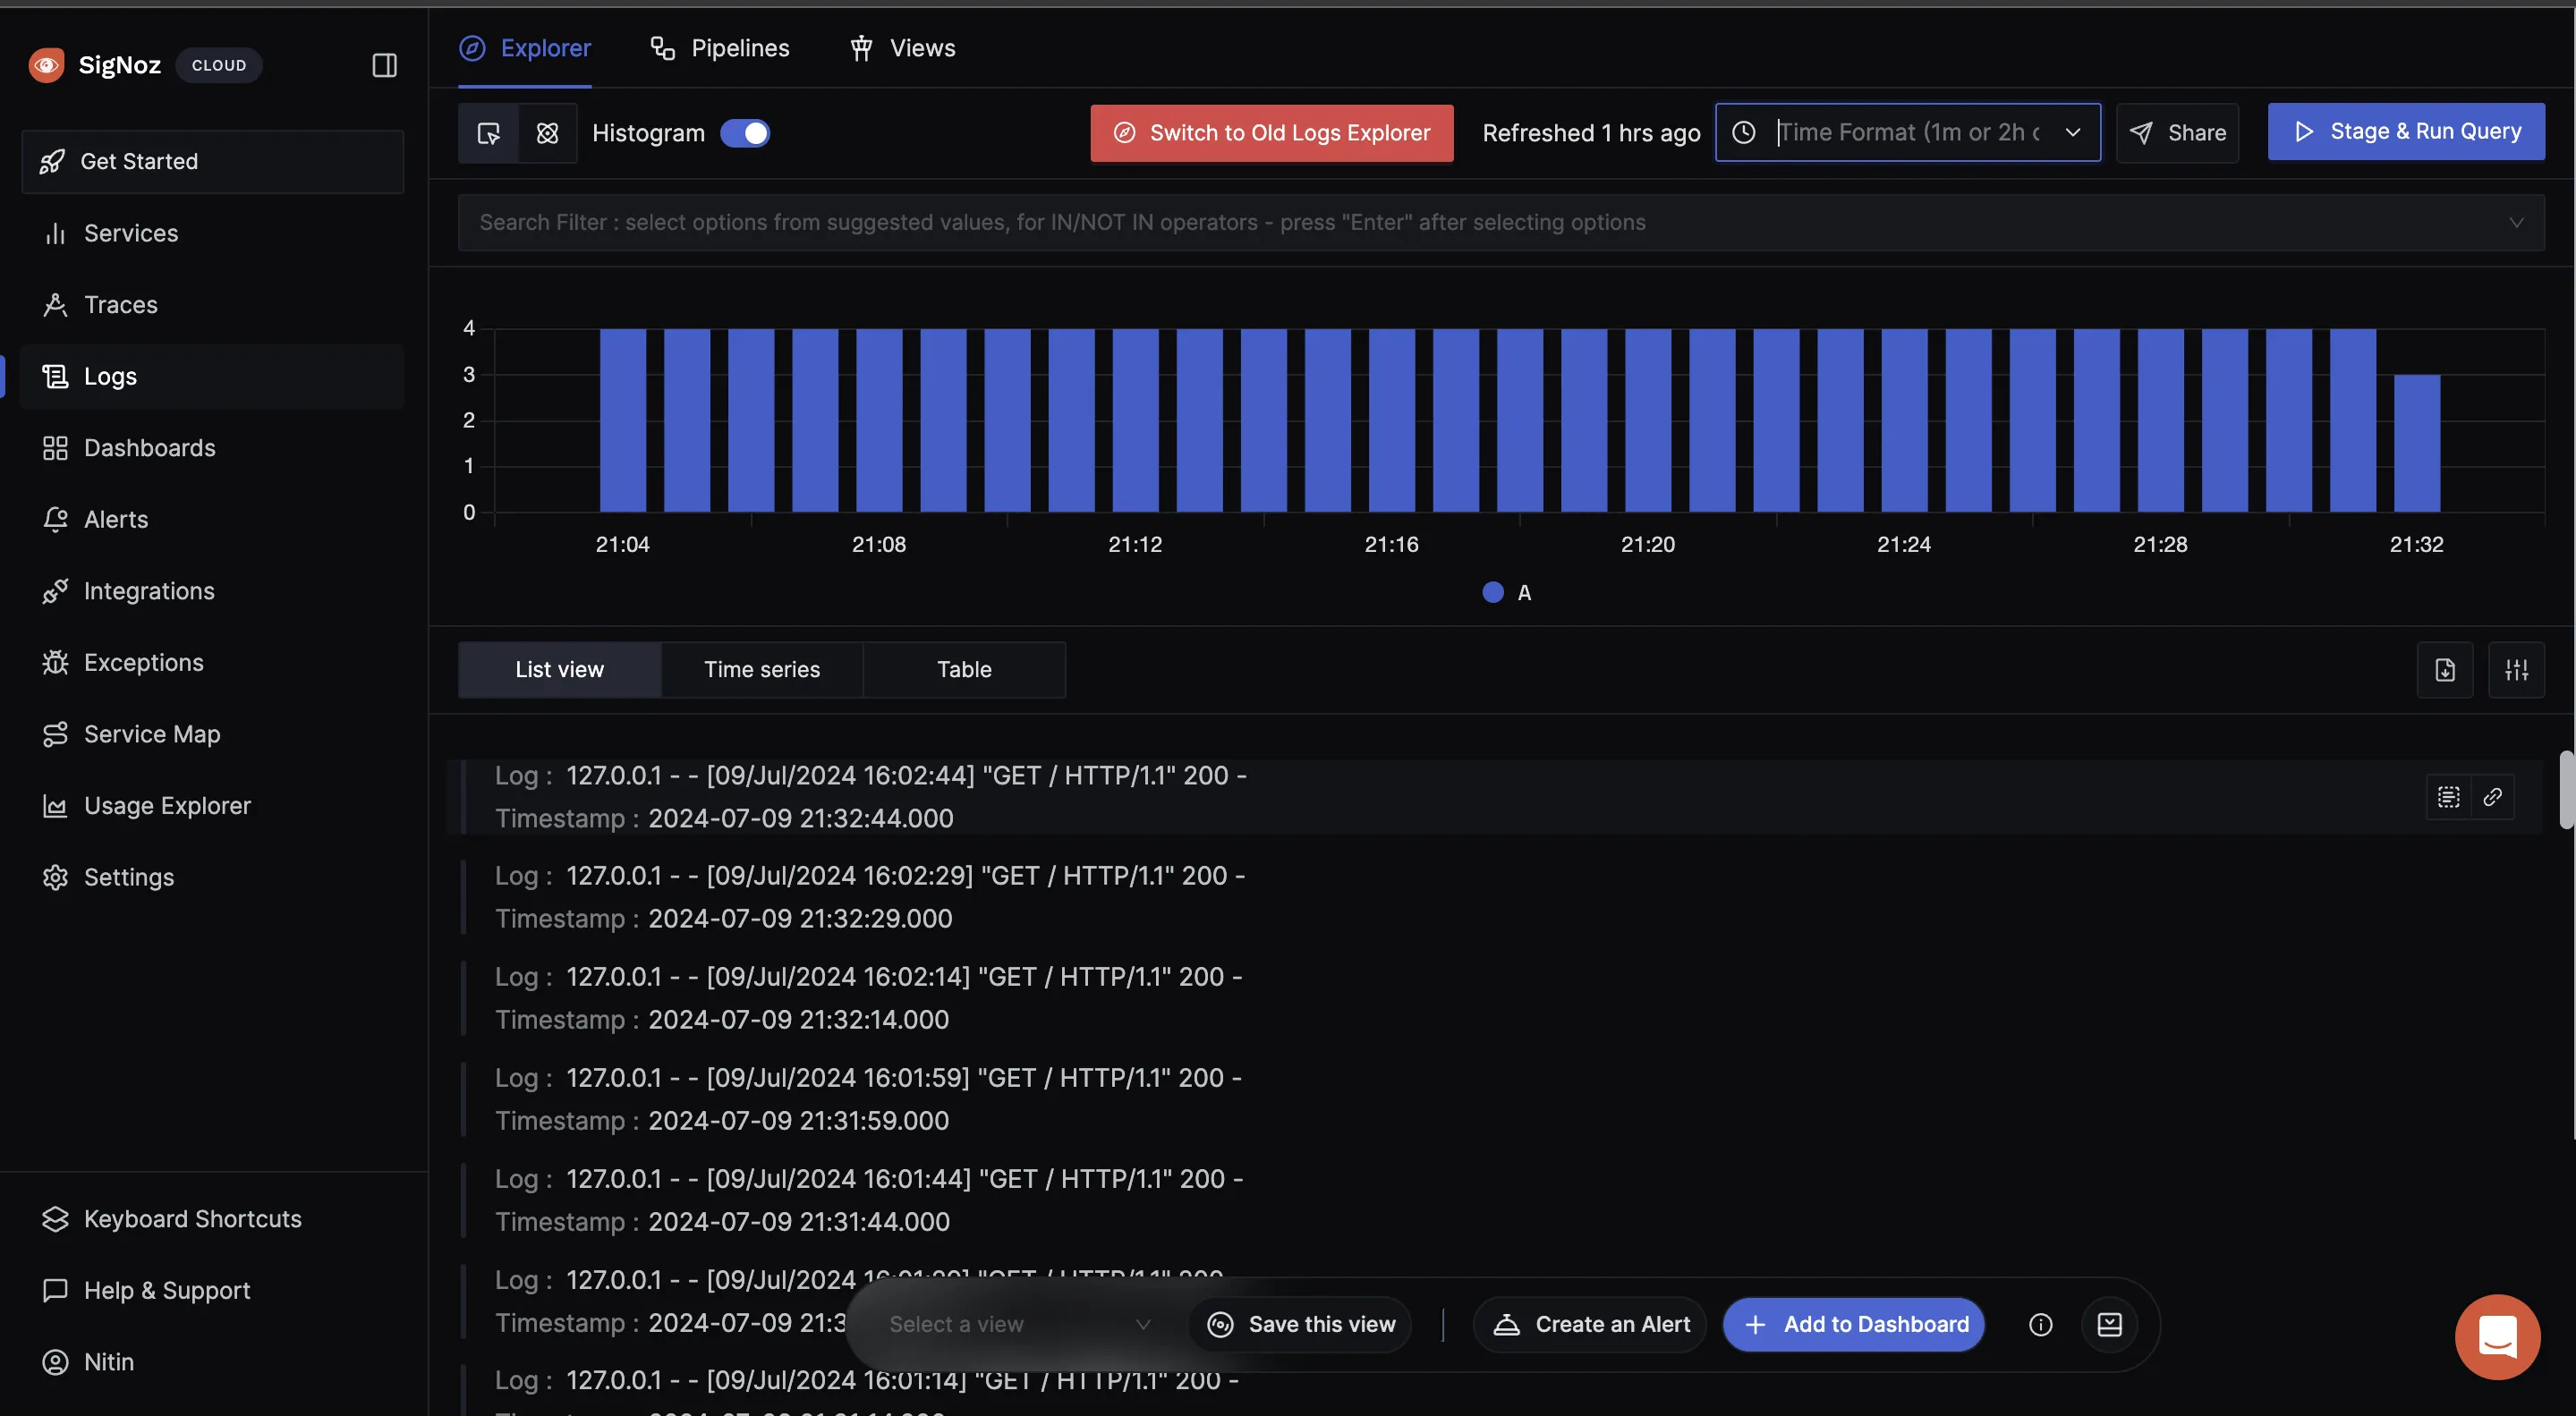
If it runs without any error, navigate to your SigNoz Cloud. Under the “Logs” tab, you should see the incoming logs.

Conclusion
- Docker logs provide insight into the health, performance, and behavior of containerized applications.
- Tailing Docker logs allows you to view real-time output, enabling you to proactively identify and address problems as they occur, ensuring the smooth functioning of your applications.
- The
docker logscommand provides fundamental log monitoring capabilities, but it has certain limitations that can be effectively addressed with advanced observability tools like SigNoz.
FAQs
Can you tail Docker logs?
Yes, you can tail Docker logs using the docker logs -f <container_id> command. This command allows you to follow the log output in real-time, similar to the tail -f command in Unix/Linux systems.
What is the use of -- tail flag in docker logs -- tail 100?
The --tail flag in the docker logs --tail 100 <container_id> command fetches the last 100 lines of the log output. This is useful for quickly accessing recent logs without having to sift through the entire log history.
How do I check Docker logs?
To check Docker logs, use the docker logs <container_id> command. This will display the log output for the specified container.
Where do Docker logs go?
By default, Docker logs are stored in JSON format on the host system in the /var/lib/docker/containers/<container_id>/ directory. Each container has its own log file located in its specific directory.
Are Docker logs persistent?
Docker logs are persistent as long as the container exists. However, managing log retention and disk space can be challenging without proper log management practices. Logs can be rotated and managed using external logging drivers or tools.
How do you tail logs continuously?
To tail logs continuously, use the docker logs -f <container_id> command. The -f flag ensures that the log output is streamed in real-time.
What does tail logs do?
The tail command shows the end of a log file, providing the most recent entries. In Docker, using the docker logs --tail flag allows you to specify the number of log lines to display from the end of the log file.
What is tail vs head logs?
The tail command displays the end of a log file, whereas the head command shows the beginning of the log file. In Docker, docker logs --tail fetches recent log entries, while head can be used in combination with other commands to show the first few lines.
What is the purpose of a tail Docker?
Tailing Docker logs allows real-time monitoring of log outputs, helping in troubleshooting, debugging, and ensuring the smooth operation of containers. It is especially useful for observing log entries as they are generated.
How do I exit from Docker logs?
To exit from real-time log monitoring when using docker logs -f <container_id>, press Ctrl + C.
How to check Docker running status?
To check the running status of Docker containers, use the docker ps command. This will list all currently running containers.
Where are Docker images stored?
Docker images are stored in the Docker repository on the host system. By default, this is located in /var/lib/docker under various subdirectories depending on the storage driver in use.
Can you tail CloudWatch logs?
Yes, you can tail CloudWatch logs using the AWS CLI command aws logs tail <log_group>. This allows real-time monitoring of logs stored in Amazon CloudWatch.
Can I delete Docker container logs?
Yes, you can delete or truncate Docker container logs. To truncate a log file, you can use the command truncate -s 0 <log_file>, where <log_file> is the path to the log file. However, proper log rotation and management practices are recommended to avoid losing critical log data.
How do I detach from Docker logs?
To detach from real-time log monitoring without stopping the container, press Ctrl + C when using the docker logs -f <container_id> command.
How to extract logs from Docker container?
To extract logs from a Docker container and save them to a file, use the command:
docker logs <container_id> > container_logs.txt
This command redirects the log output to a file named container_logs.txt.

