Range vectors in Prometheus allow you to analyze metric data over specific time periods. You create range vectors by adding a time duration selector [d] to your instant vector selectors. This fundamental concept enables you to perform time-series analysis, calculate rates of change, and identify trends in your metrics data.
Understanding Range Vectors in Prometheus
Range vectors are a crucial concept in Prometheus for analyzing time-series data over intervals, allowing you to observe trends, patterns, and aggregate changes over time. They are essential for complex queries involving rates, averages, and other calculations that need data points collected across a specific timeframe.
What are Range Vectors?
A range vector represents a sequence of data points over a given period, enabling Prometheus to evaluate trends or patterns across intervals. Unlike instant vectors, which represent a single data point at a specific time, range vectors capture historical data across a specified time range. This historical data allows users to perform aggregations, such as averages or rates, which depend on multiple points in time.
Role in Time-Series Analysis
Range vectors empower Prometheus to evaluate metrics in a more dynamic way, which is particularly valuable for analyzing performance over time or investigating spikes or dips in data.
Difference between Instant Vectors and Range Vectors
In Prometheus, instant vectors and range vectors are two distinct ways to query and analyze time-series data. Understanding their differences helps in selecting the right approach for specific monitoring or analytical needs.
- Instant Vectors: An instant vector captures a snapshot of data at a single moment. They are ideal for real-time monitoring, where current metric values (e.g., CPU usage or memory utilization at a specific instant) are more relevant. For example:
http_requests_total: Returns the current value of HTTP requests at the time of the query.
- Range Vectors: A range vector captures a series of data points over a specified time range. These values are then used to calculate trends, averages, or rates over time, making range vectors suitable for more in-depth analyses that require historical context. For example:
http_requests_total[5m]: Returns the values of HTTP requests collected over the past 5 minutes.
These differences can help in determining whether you need single-point data (instant) or need to evaluate a trend over time (range).
Syntax for Creating Range Vectors
Creating a range vector involves appending a time duration in square brackets ([]) to a metric name. This duration specifies how far back in time Prometheus should look to gather data points for that vector.
Syntax:
<metric_name>[<duration>]
Example:
# Instant vector example
node_cpu_seconds_total

# Range vector example with a 5-minute duration
node_cpu_seconds_total[5m]
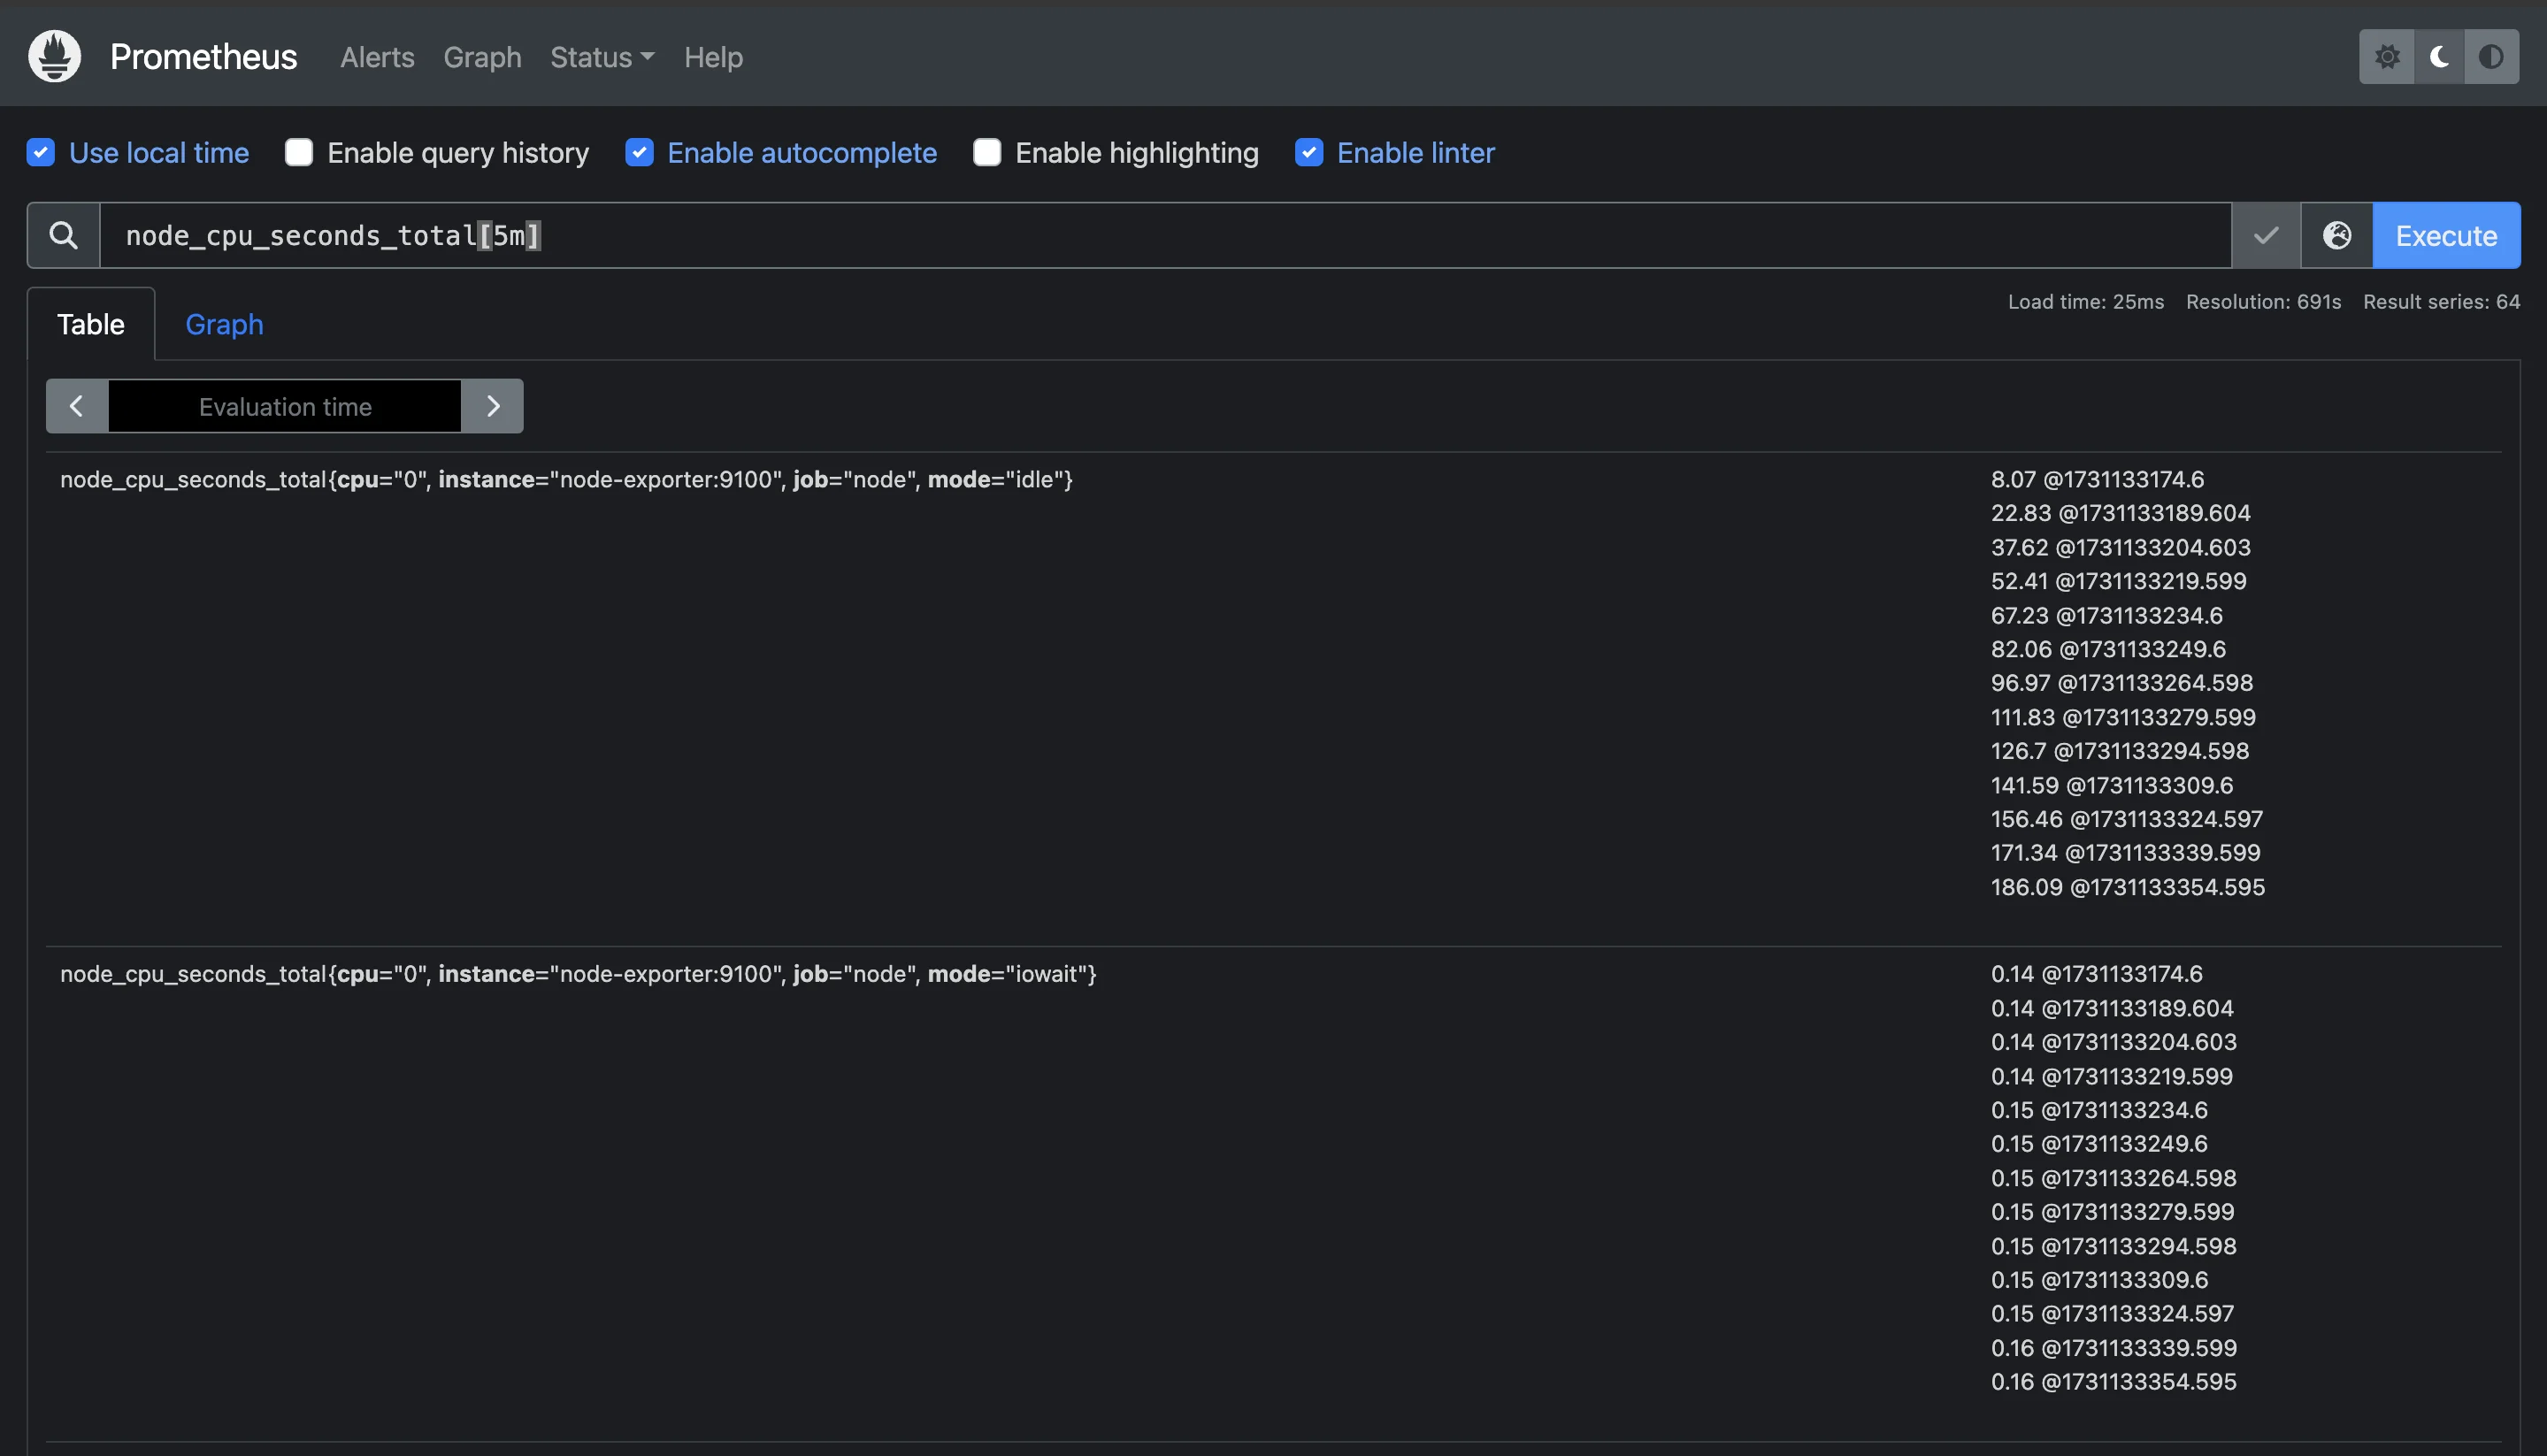
Common Use Cases for Range Vectors in Monitoring
Range vectors are useful for:
- Rate Calculations: Measuring changes over time, such as requests per second or errors per second.
- Trend Analysis: Detecting gradual increases or decreases in resource usage.
- Anomaly Detection: Spotting unusual spikes or drops in data.
- Smoothing and Averaging: Reducing noise by calculating moving averages or smoothed rates.
Time Duration Formats in Prometheus
When working with time-series data in Prometheus, selecting the appropriate time duration format for your queries is crucial. Time duration formats allow you to specify how far back in time Prometheus should look to pull data for range vector queries. Understanding these formats is essential for building efficient, accurate queries that match the frequency and scope of your data collection needs.
Time Duration Formats
Prometheus supports a variety of time duration formats, each represented by specific abbreviations:
s- secondsm- minutesh- hoursd- daysw- weeksy- years
This syntax is straightforward, and you can use any combination to define a time range that suits your analysis. For example, to query data over a short period, you could use [5m] to select the last five minutes of data. If you want a broader view, you could use [1h] for the last hour or [7d] for the last seven days.
These units allow you to create flexible queries that match your monitoring and analysis requirements, whether you’re looking for minute-by-minute data or multi-day trends.
metric_name[30s]  # Last 30 seconds
metric_name[5m]   # Last 5 minutes
metric_name[1h]   # Last hour
metric_name[1d]   # Last day
metric_name[1w]   # Last week
metric_name[1y]   # Last year
Best Practices for Selecting Appropriate Time Ranges
Selecting the right time range in Prometheus queries is essential for accurate monitoring and analysis. Here are some best practices to help you make the right choice:
- Align with Metric Frequency: The time range should generally match the frequency of data collection for your metric.
- High-frequency metrics (e.g., per-second data) benefit from shorter time ranges (like 30s to 5m) for recent data aggregation.
- Low-frequency metrics (e.g., daily data) are better suited to longer time ranges, such as several hours or days.
- Consider Performance Impact: Shorter time ranges generally return smaller data sets and are faster to query. As the time range grows, so does the amount of data Prometheus needs to process, which can increase query time and resource usage.
- Use Specific Time Durations for Alerting: For alerts, choose time ranges that capture relevant patterns. For instance, if you’re monitoring a metric that typically fluctuates every few minutes, a 5-minute range may be ideal to avoid false positives.
- Experiment and Adapt: Adjust the time range based on the specific behavior of the metrics you're tracking. Monitoring patterns often vary across systems, and a trial-and-error approach can help in finding the most effective time range for accurate insights.
Impact of Time Range Selection on Query Performance
Selecting an appropriate time range has a direct impact on query performance in Prometheus. Since Prometheus pulls multiple data points from the specified range, broader ranges increase the volume of data that needs to be processed. Here’s how time range selection can impact performance:
- Data Volume and Processing Time: A larger time range means that Prometheus needs to retrieve and process a more extensive dataset. This can slow down the query and, depending on your server’s capacity, may affect the performance of other queries or tasks running concurrently. For example, querying a metric over
[1y]pulls a year’s worth of data, which can take much longer than a query over[5m]or[1h]. - Resource Utilization: Prometheus queries that process large time ranges consume more CPU and memory, especially for high-frequency metrics. If your Prometheus server has limited resources, you may experience lag or even timeouts when querying long periods for metrics collected at high rates. Optimizing time ranges ensures that Prometheus remains responsive and can continue collecting and storing data reliably.
- Balancing Detail and Query Speed: Narrower time ranges often produce faster query results, but they also limit the scope of the data being analyzed. It’s important to strike a balance between retrieving enough data for meaningful analysis and keeping queries fast and efficient. If you need insights on trends across both short and long periods, consider running separate queries with different time ranges or using roll-up metrics that aggregate data over longer intervals.
- Impact on Graph Readability: In tools like Grafana, using larger time ranges for fast-changing metrics can result in cluttered graphs with too much data to interpret easily. Selecting an appropriate time range helps create clearer visualizations that highlight trends without overwhelming the display.
Creating Basic Range Vector Queries
Range vectors are an essential part of Prometheus querying, enabling you to analyze data over a specific period rather than looking at single data points. By following these steps, even beginners can start constructing effective range vector queries to monitor trends and extract deeper insights from time-series data.
Step-by-Step Guide to Constructing Range Vector Queries
Follow these steps to construct and optimize range vector queries in Prometheus effectively:
Identify the Metric: The first step in constructing a range vector query is identifying the metric you want to analyze. Prometheus collects data as different metrics—like
http_requests_totalornode_cpu_seconds_total. Each metric represents a specific aspect of your system or application.Specify the Range Duration: After identifying the metric, you need to decide how far back you want to look in time. This is defined as the range duration, which is added in square brackets (
[]) after the metric name.For example:
rate(prometheus_http_requests_total[15m])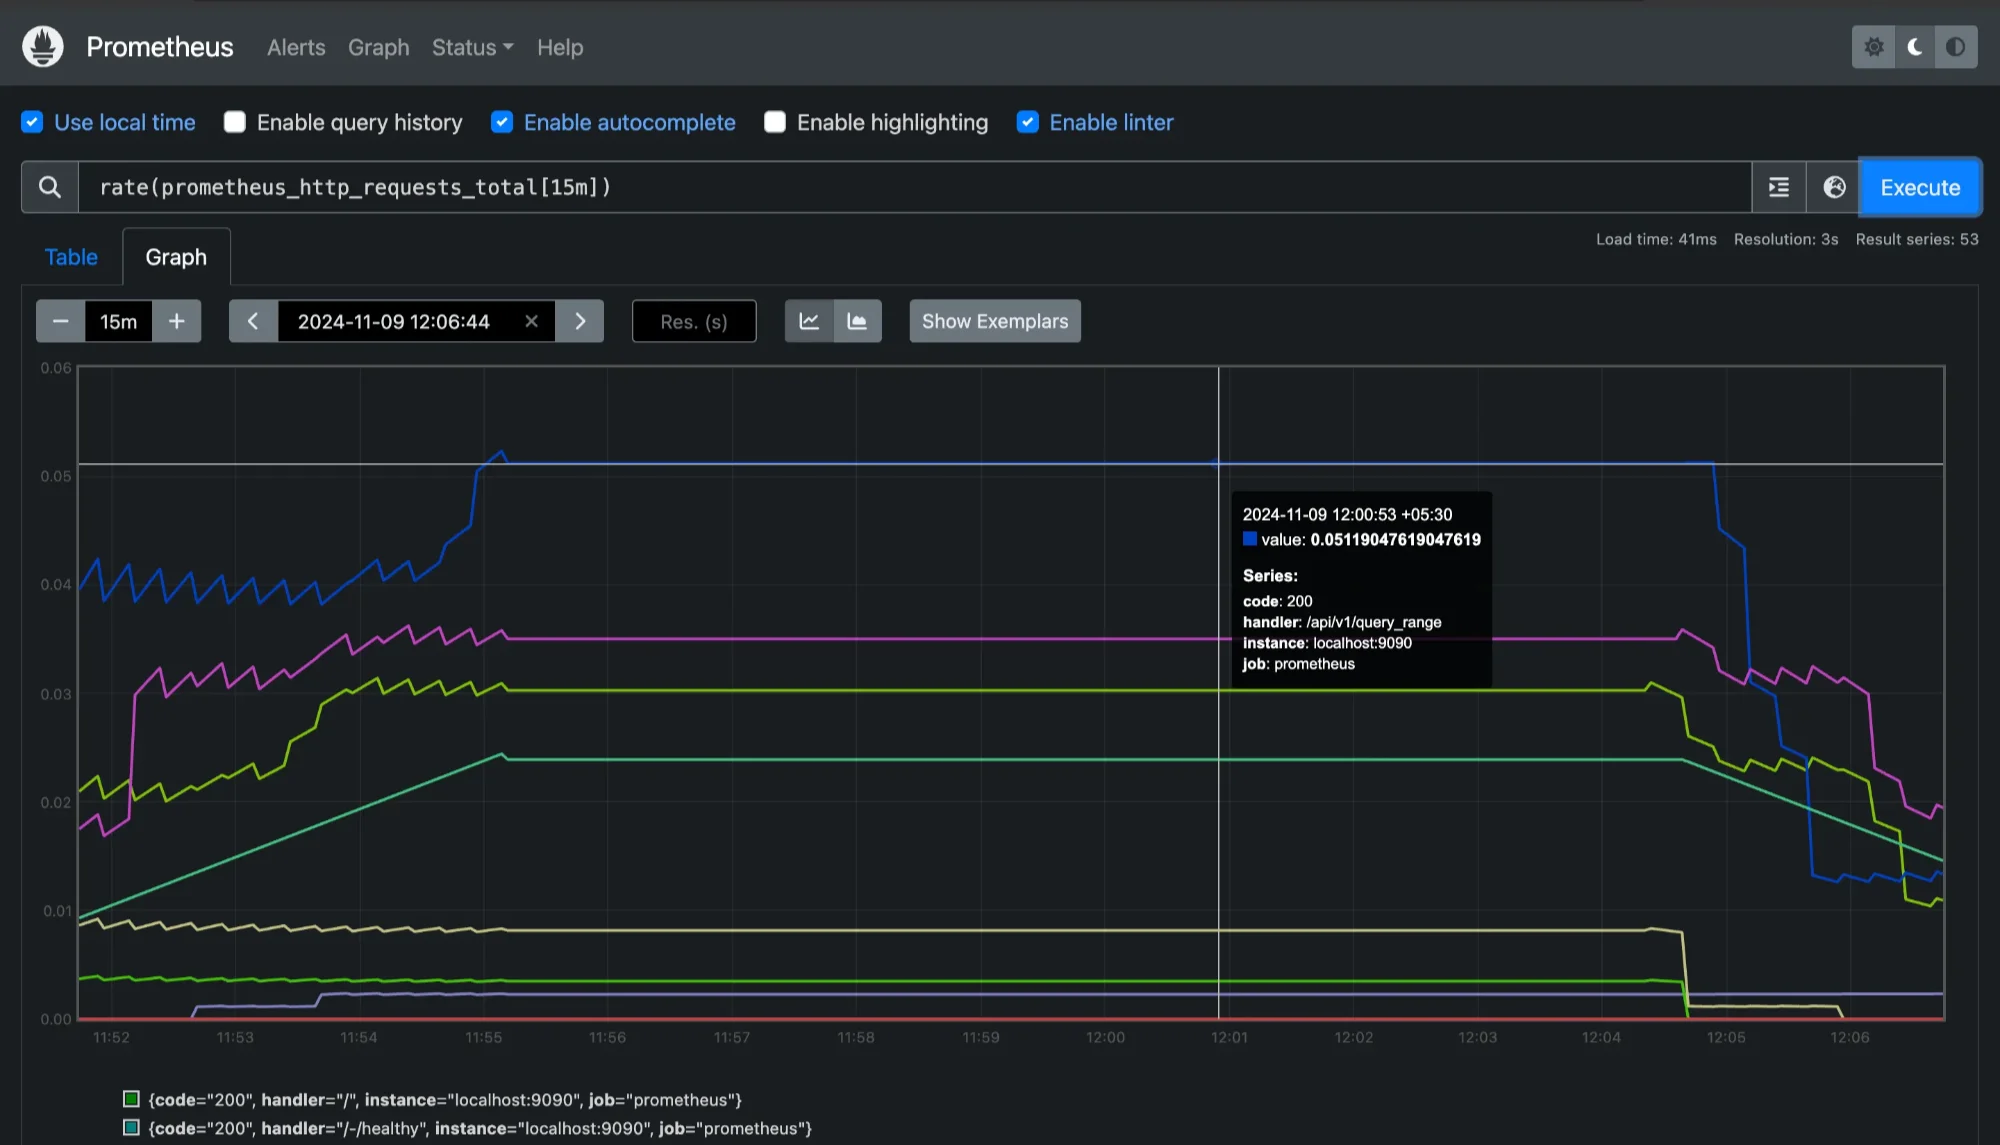
Checking range durations for 15mins for `prometheus_http_requests_tota` This range vector query retrieves
http_requests_totaldata from the last 5 minutes.Apply Aggregation Functions (If Needed): Functions like
rate,irate, andincreaseare commonly used with range vectors to provide meaningful calculations based on the data over time. For instance, to calculate the rate of HTTP requests over a 5-minute window, you can use:irate(prometheus_http_requests_total[15m])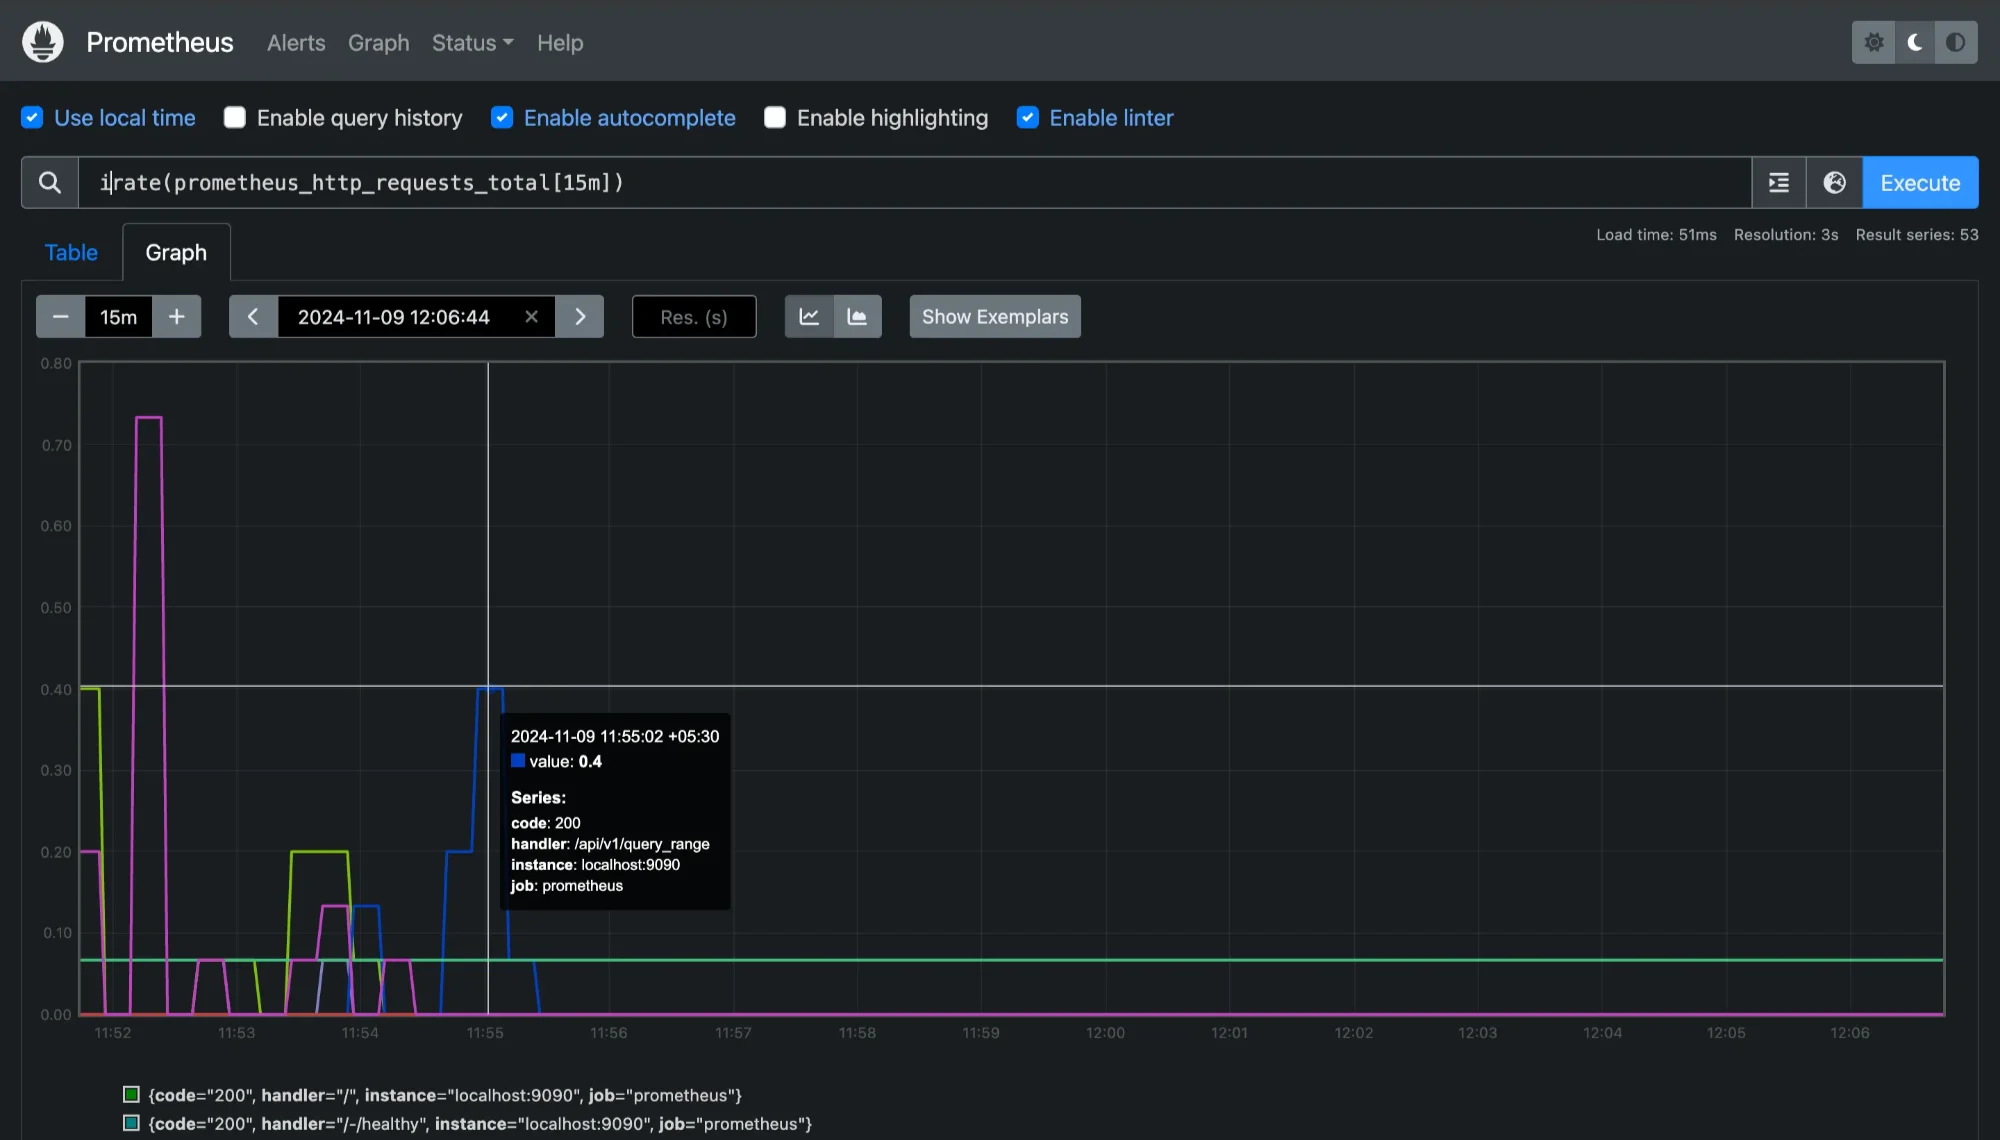
Checking `prometheus_http_requests_total` with adding a function `irate` This calculates the instantaneous rate of HTTP requests per second over the last 15 minutes based on the most recent counter increments.
Use Filters or Labels (Optional): Prometheus metrics often come with labels that provide additional context, such as
method="POST"orstatus="200". You can use these labels to filter data within a range vector query to target specific data.rate(prometheus_http_requests_total{code="200"}[5m])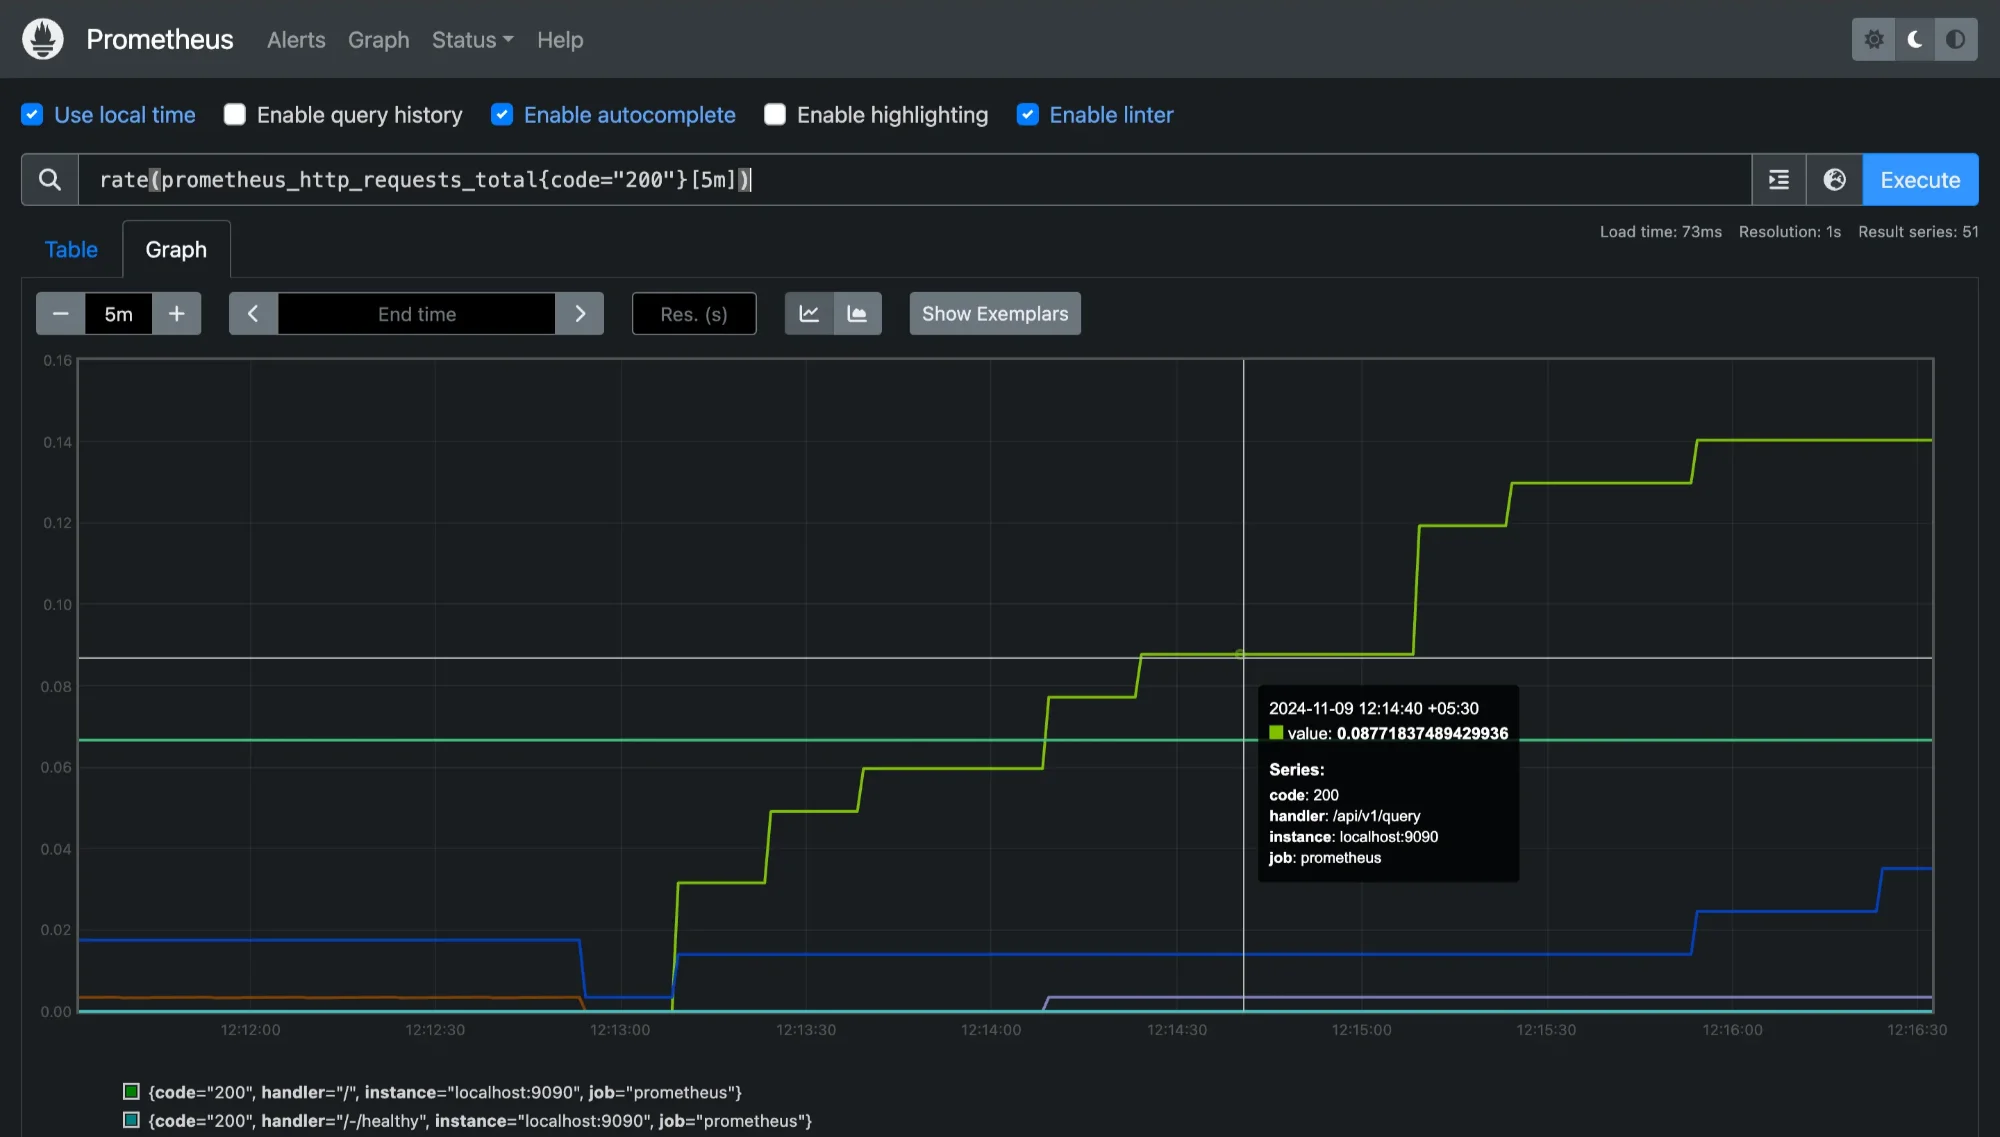
This query calculates the
code=200requests only, helping you focus on specific metrics.
Example of a Basic Range Vector Query
Let’s put it all together. Suppose you want to calculate the rate of CPU usage for the past 10 minutes, filtered by the instance label to focus on a specific server. You would write:
rate(node_cpu_seconds_total{instance="node-exporter:9100", mode="user"}[10m])
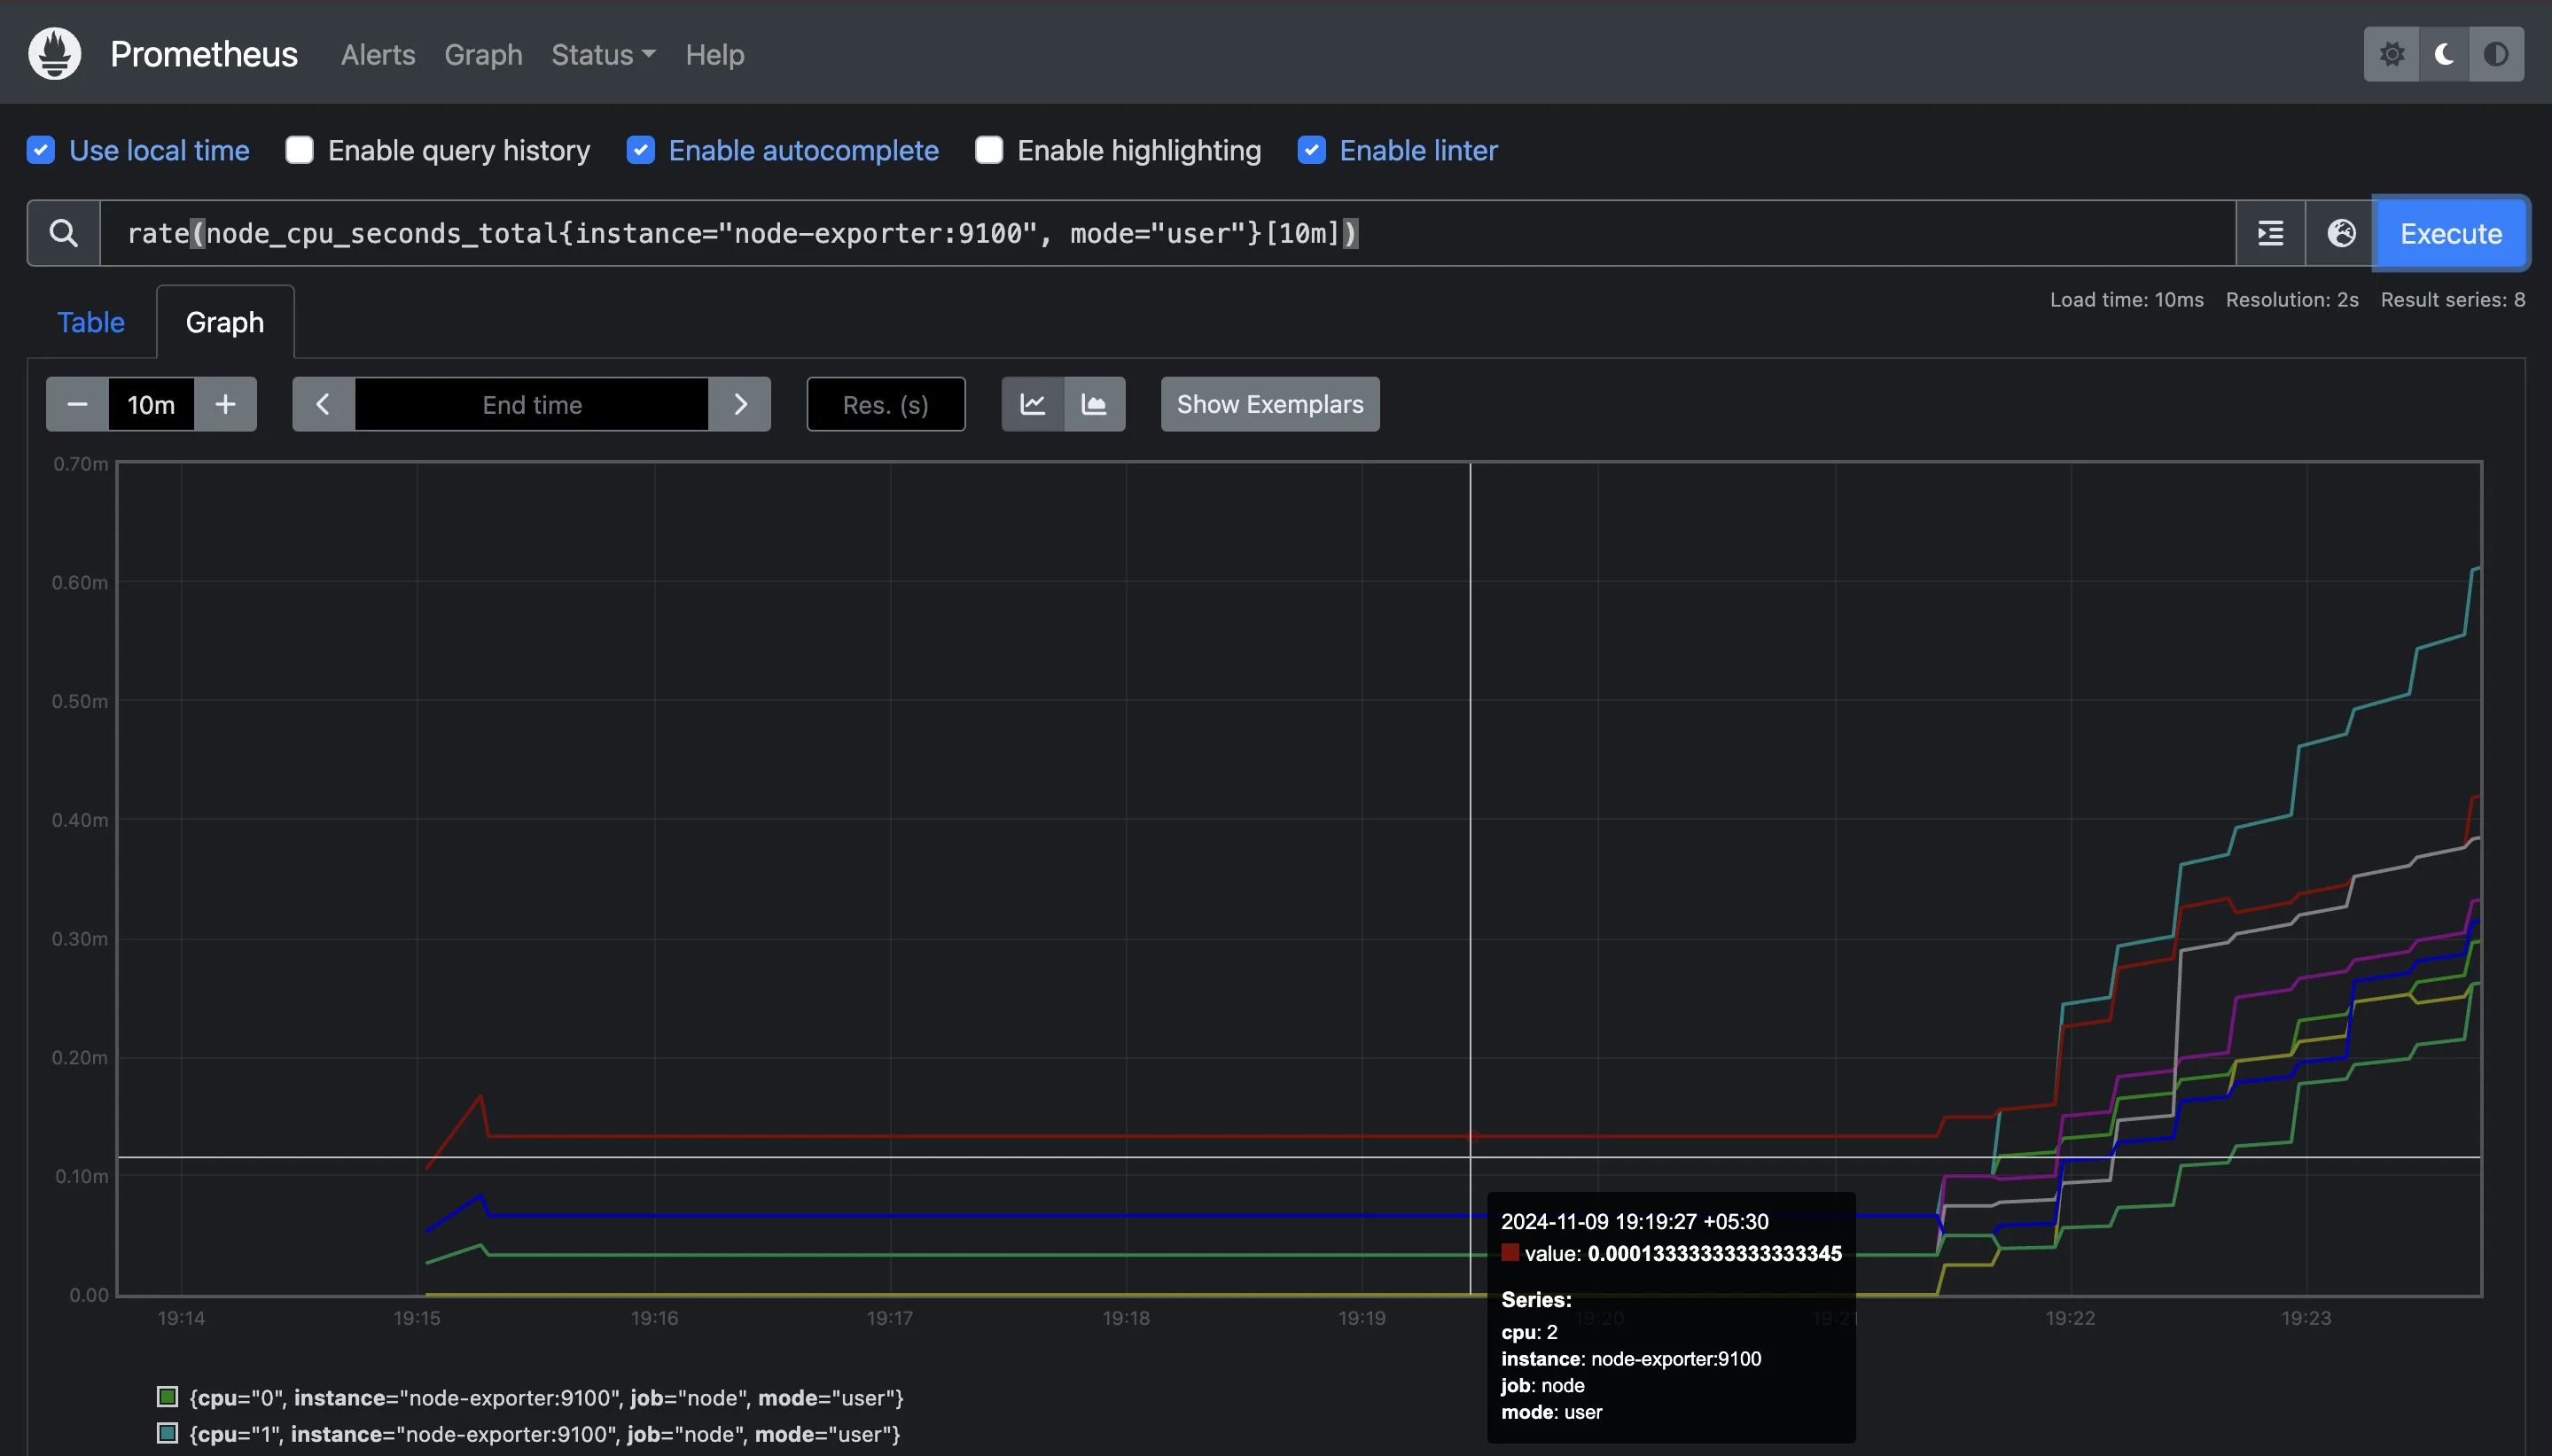
This query provides the rate of CPU usage in "user" mode over the past 10 minutes for the node-exporter:9100 instance.
Essential Operators for Range Vector Manipulation
Range vector queries are powerful when combined with operators that allow you to analyze trends and monitor changes effectively. Here are the most commonly used operators:
rate- Definition: Calculates the average per-second rate of increase for a given metric within a specified time range.
- Usage:
rate(http_requests_total[5m]) - When to Use: Use
ratewhen you need an averaged rate over a period, such as the average requests per second over the past 5 minutes.
irate- Definition: Computes the "instantaneous" per-second rate, based on the most recent two data points within the specified range.
- Usage:
irate(node_cpu_seconds_total[1m]) - When to Use:
irateis useful for detecting sudden spikes or drops, as it’s more responsive to recent changes compared torate. However, it can be noisy since it relies only on the latest two samples.
increase- Definition: Calculates the total increase in a metric over the specified time range.
- Usage:
increase(http_requests_total[1h]) - When to Use: Use
increasewhen you need to know the cumulative growth over a period, such as the total number of requests in the last hour.
These operators are the foundation of effective range vector queries, enabling you to derive meaningful insights from raw metrics.
Using Offset Modifiers with Range Vectors
In some cases, you may need to look at data from a specific time in the past, instead of the current time. This is where the offset modifier comes into play. The offset modifier shifts the range vector query back by a specified duration, making it possible to compare data from different periods.
Example Use Cases for Offset Modifiers
Comparing Past and Current Performance: Suppose you want to compare the current CPU usage with the usage from an hour ago. You can use
offsetto achieve this:# Current rate over the last 5 minutes rate(node_cpu_seconds_total[5m]) # Rate over 5 minutes, but one hour ago rate(node_cpu_seconds_total[5m] offset 1h)This comparison allows you to monitor changes and identify if the CPU usage has increased or decreased over time.
Handling Delayed Data: Sometimes, data may have delayed ingestion due to network issues or other factors. If you know your data arrives with a delay, you can use
offsetto account for it, ensuring your query aligns with the latest available data.
Handling Missing or Incomplete Data Points
Prometheus data may sometimes be incomplete due to collection delays, system issues, or network interruptions. Handling missing data points gracefully in range vector queries is important to ensure reliable results. Here are ways to handle these situations:
Using Functions to Handle Missing Data: Prometheus functions such as
rate,irate, andincreaseare generally resilient to missing data points because they calculate rates and totals based on available data. However, if you have a specific need to handle missing data, thepresent_over_timefunction can be useful:present_over_time(prometheus_http_requests_total[5m])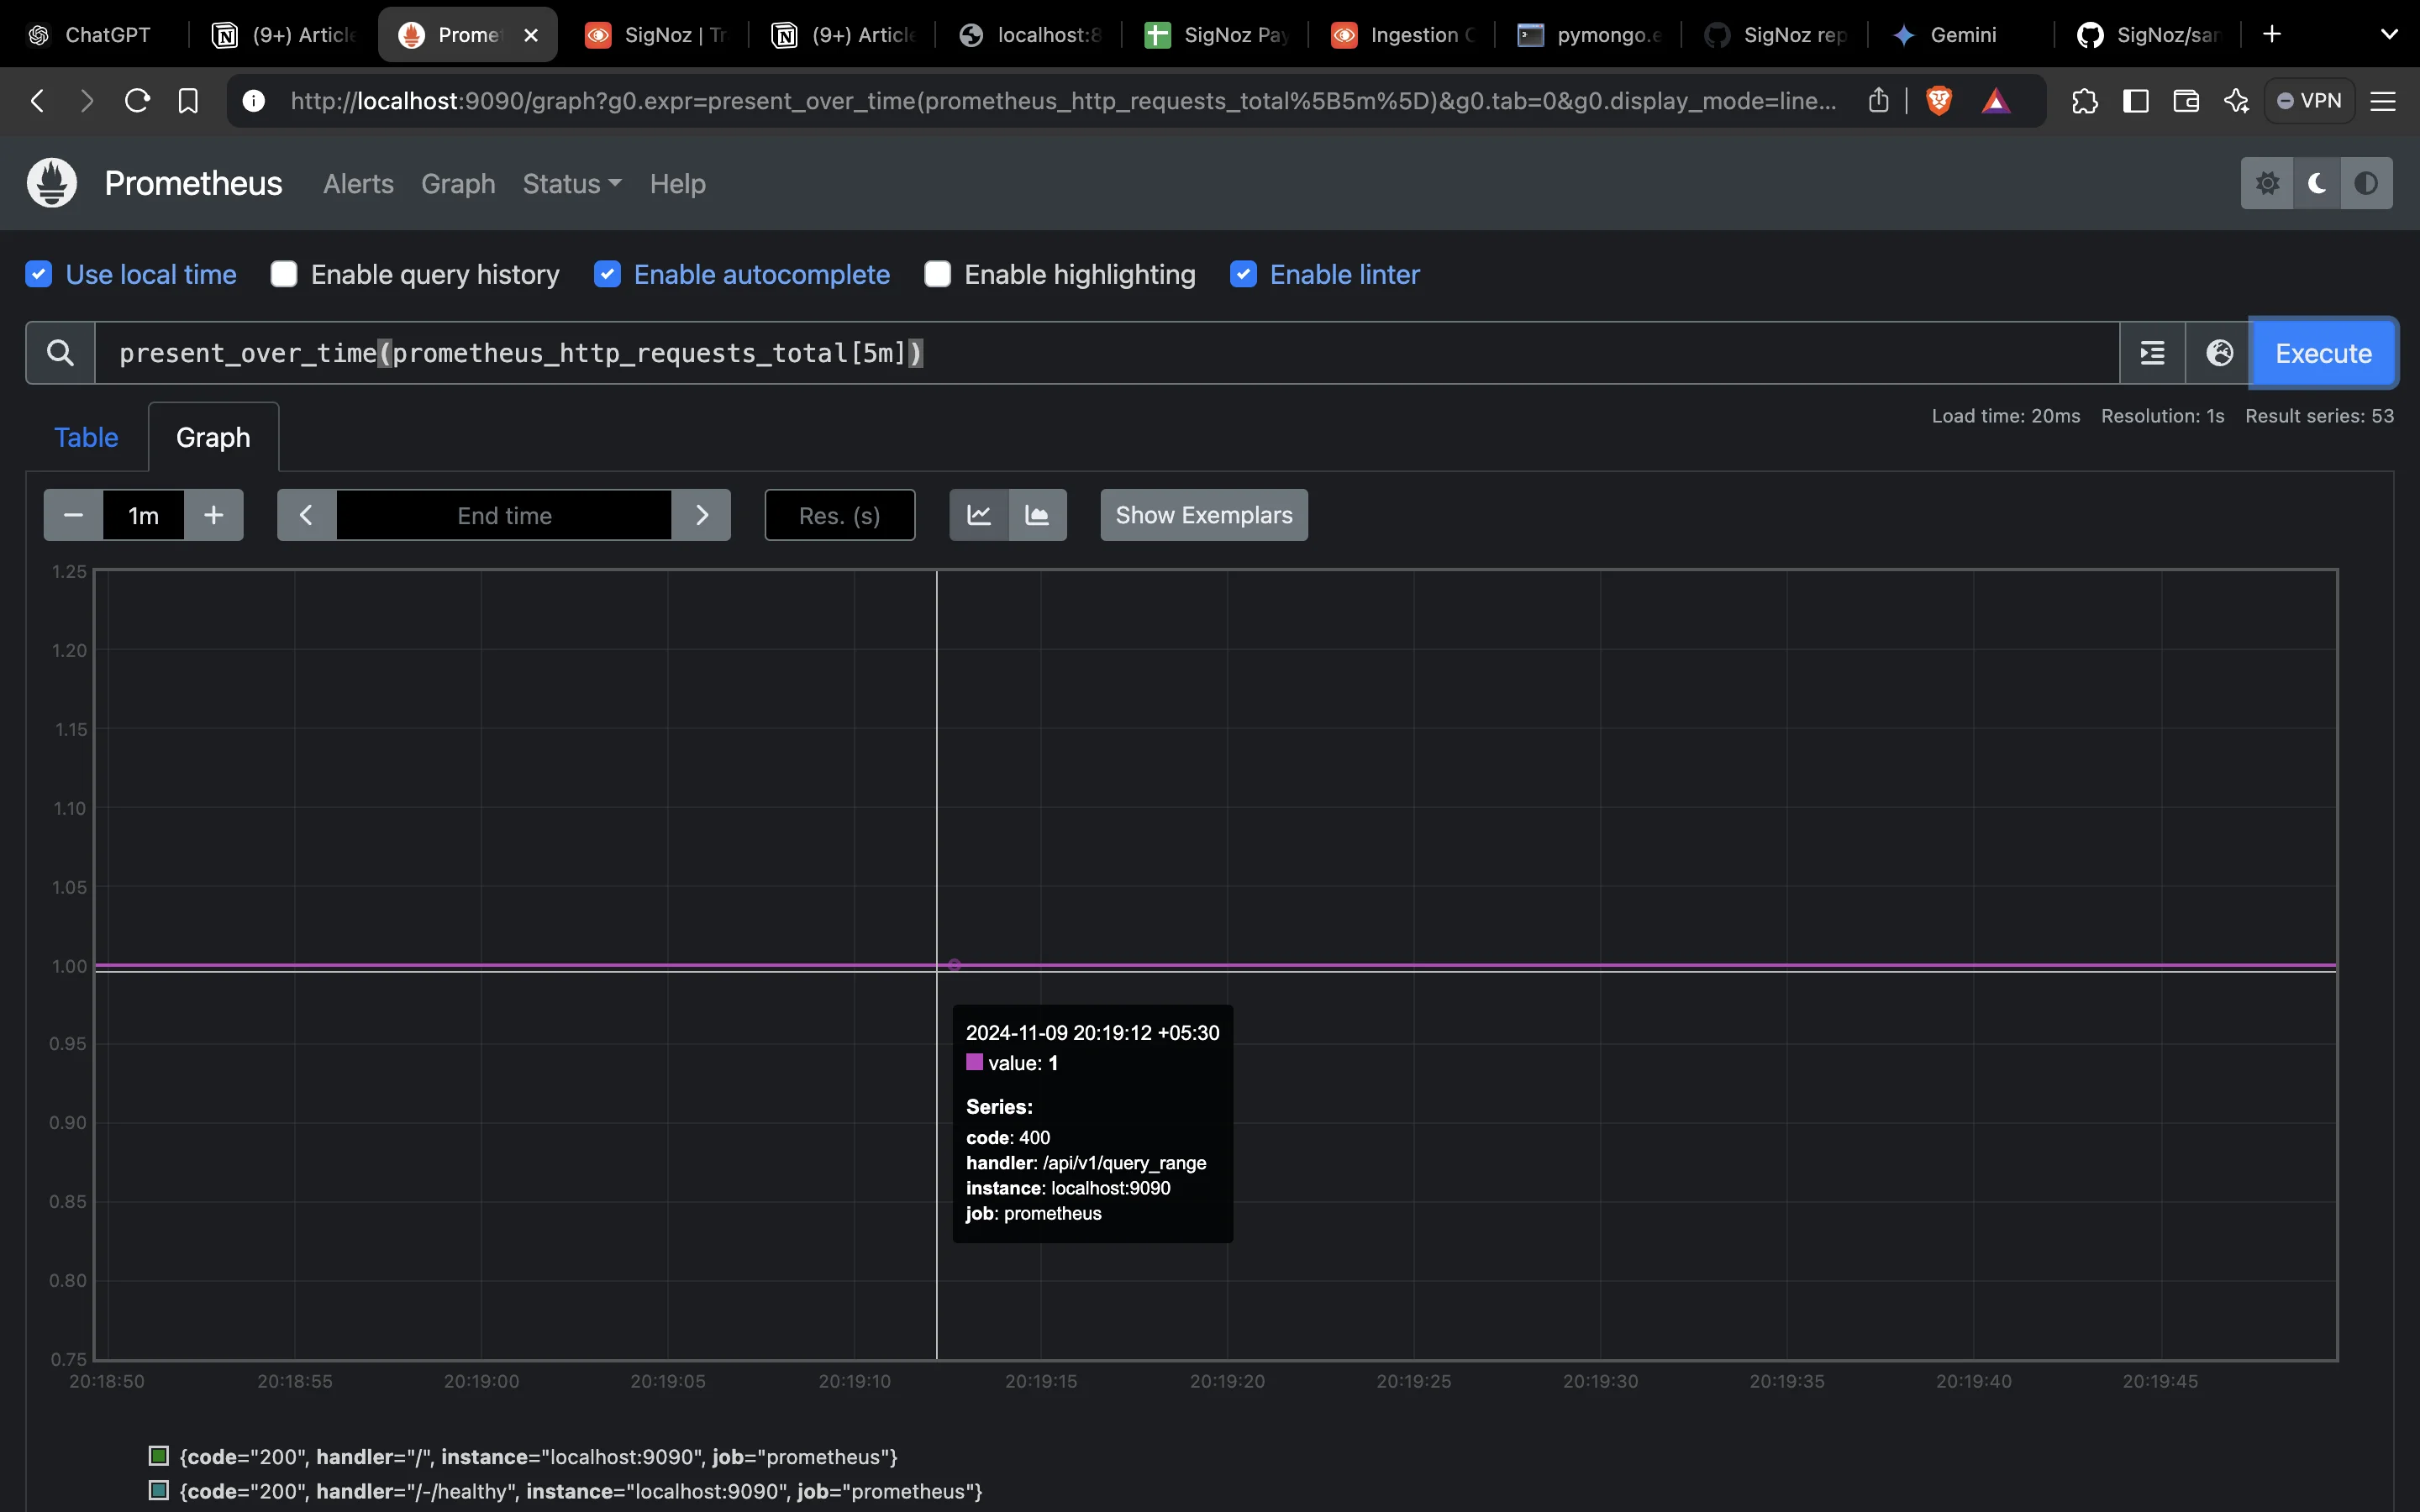
Using `present_over_time` to handle missing data This function will return
1if any data points are recorded forprometheus_http_requests_totalwithcode="200"onlocalhost:9090within the last 5 minutes, and0if there are no data points. This can be especially useful for detecting whether data was recorded in a specific period.Adjusting the Range Duration: If you encounter frequent gaps in data, it may be helpful to adjust your range duration to be longer, allowing Prometheus to pull in more data points. For example, changing a 1-minute window to 5 minutes may yield more consistent results.
Using Aggregation Operators for Stability: Aggregation operators like
avg_over_timecan also help in smoothing out missing data points. For example:avg_over_time(node_cpu_seconds_total[10m])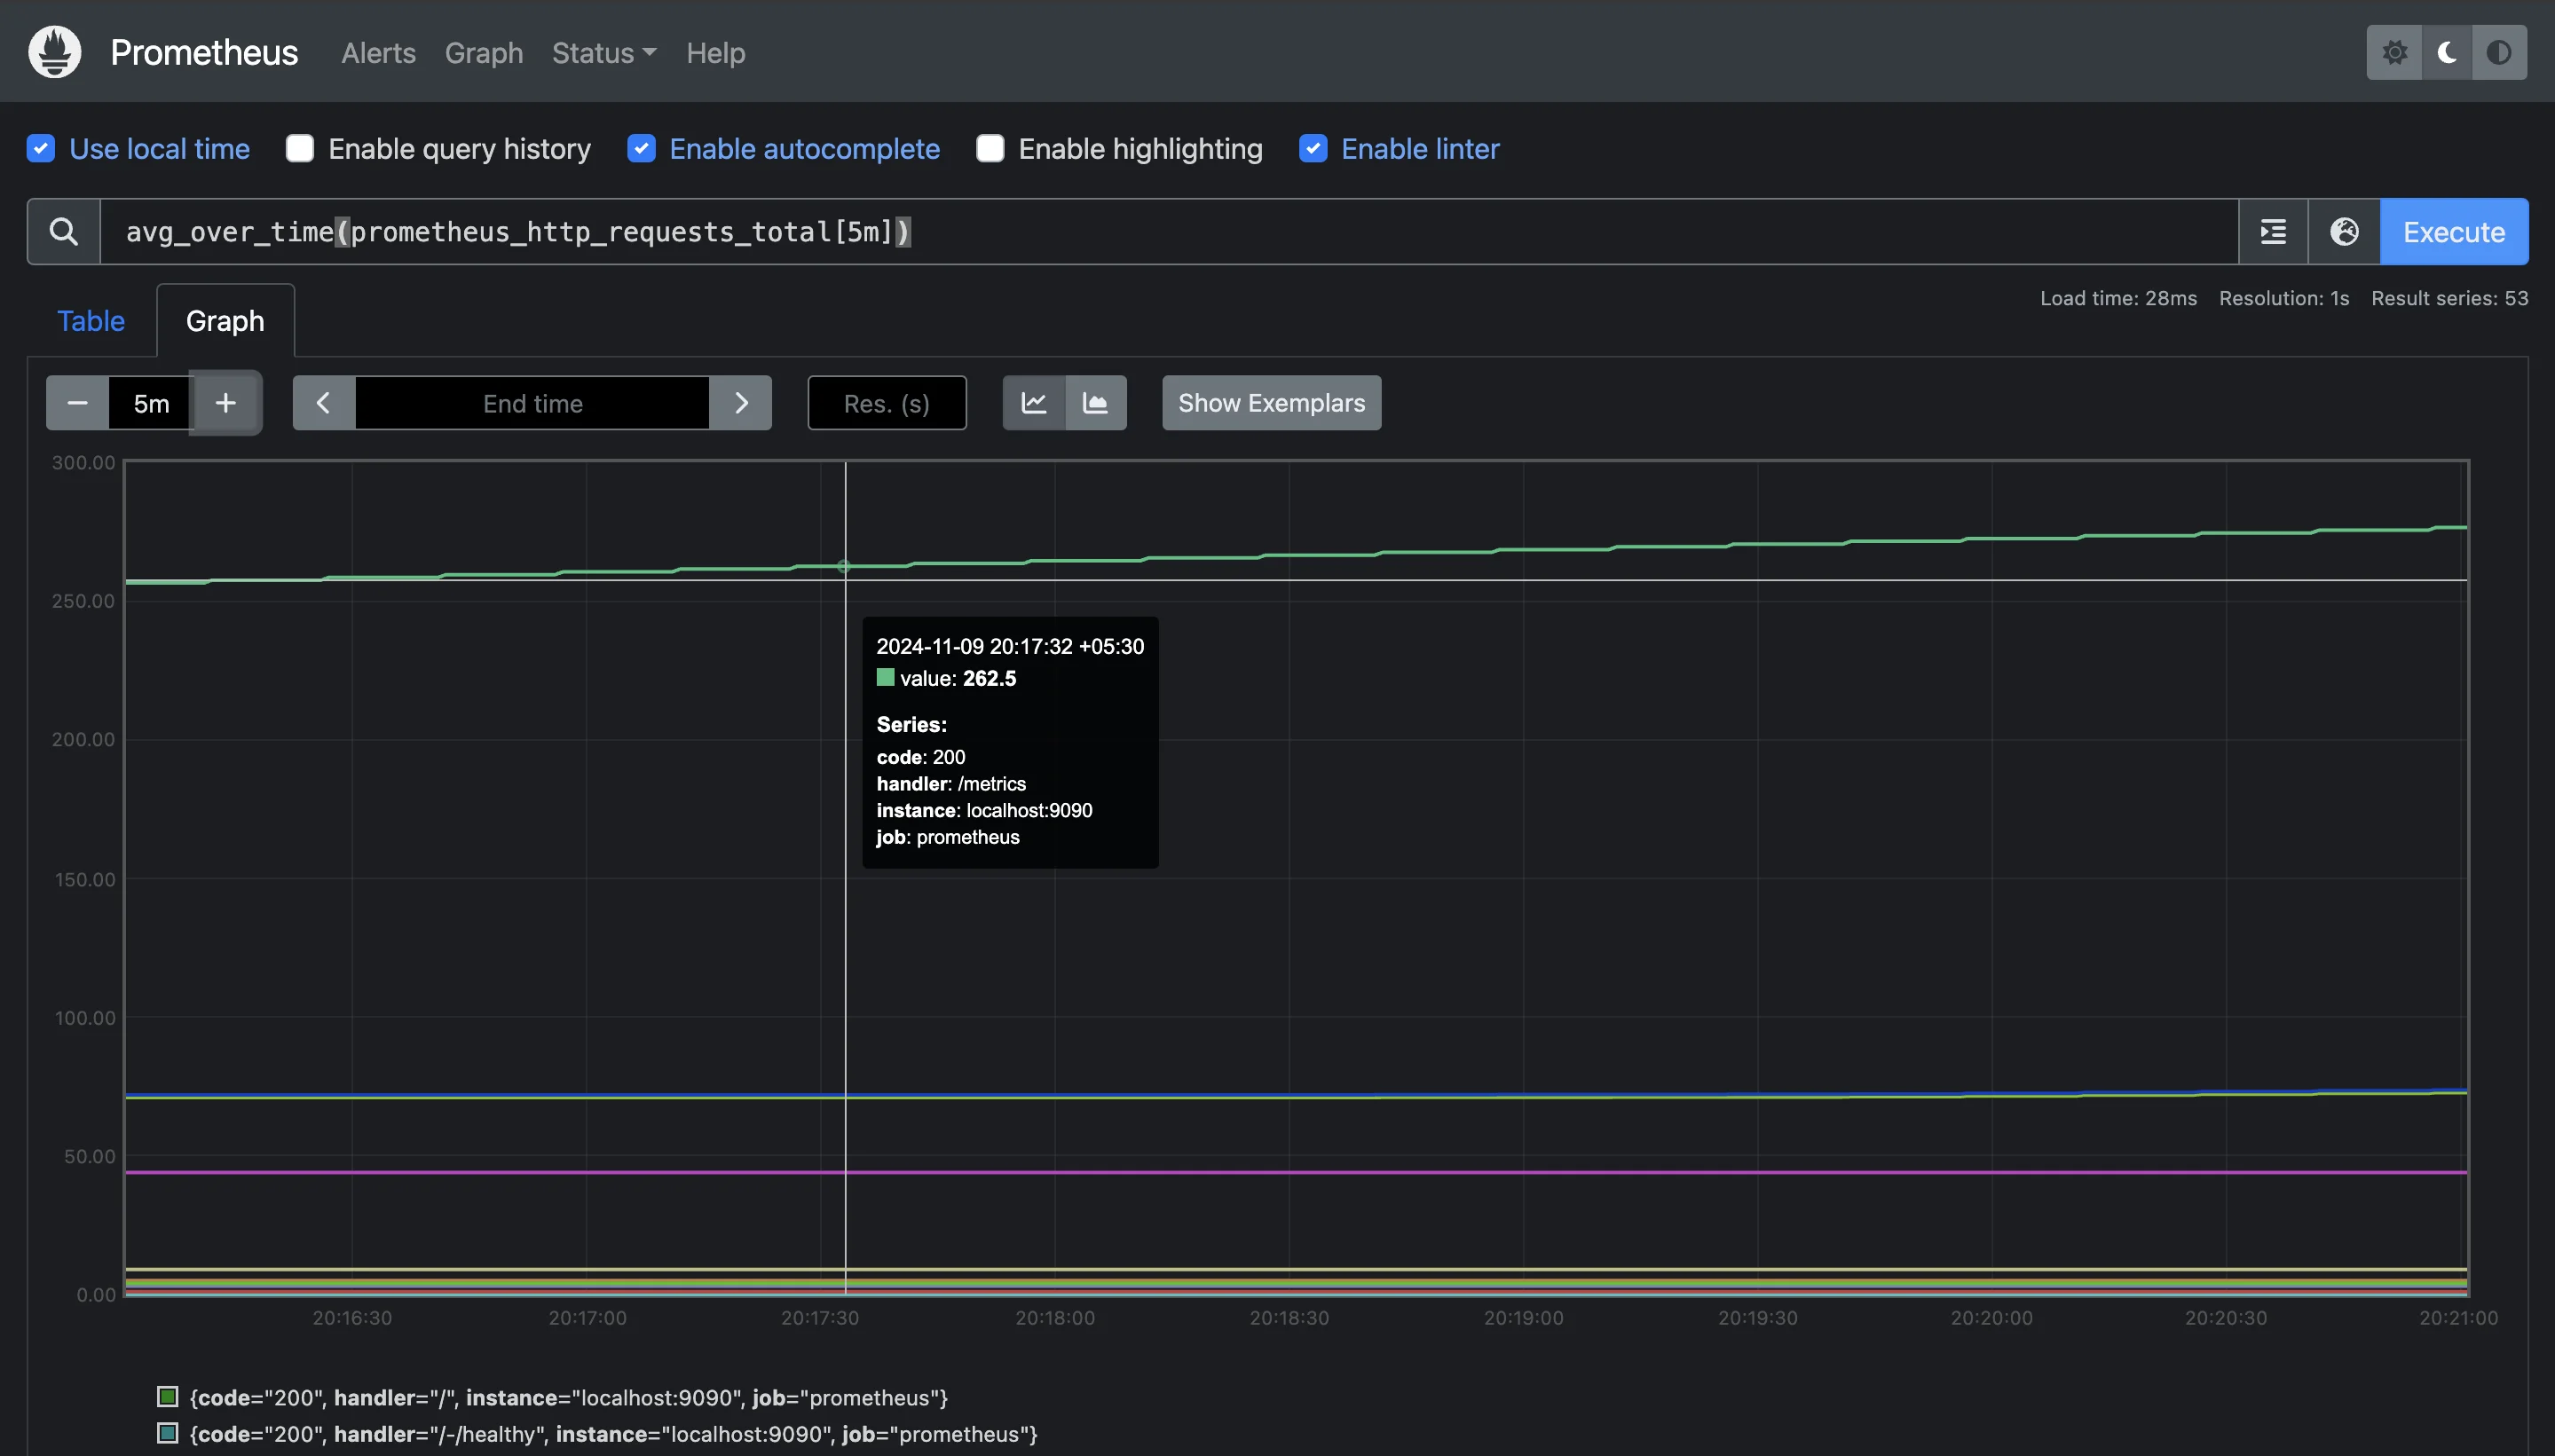
Using `avg_over_time` to average out missing data This takes the average value over the last 10 minutes, which can reduce the effect of missing data by averaging over a broader time span.
Advanced Range Vector Operations
After learning the basics of range vectors, you may find that more complex scenarios require additional techniques to manage, aggregate, and optimize your queries. This section covers advanced operations you can use to work with range vectors effectively, including aggregation functions, combining range vectors, using subqueries, and optimizing query performance.
Aggregating Range Vector Data Using Functions
Aggregation functions are vital in Prometheus for summarizing data over time, making it easier to extract meaningful insights from large datasets. By applying these functions to range vectors, you can calculate averages, maximums, minimums, sums, and more across your data.
avg_over_time: Calculates the average value over the specified range duration.avg_over_time(node_cpu_seconds_total[10m])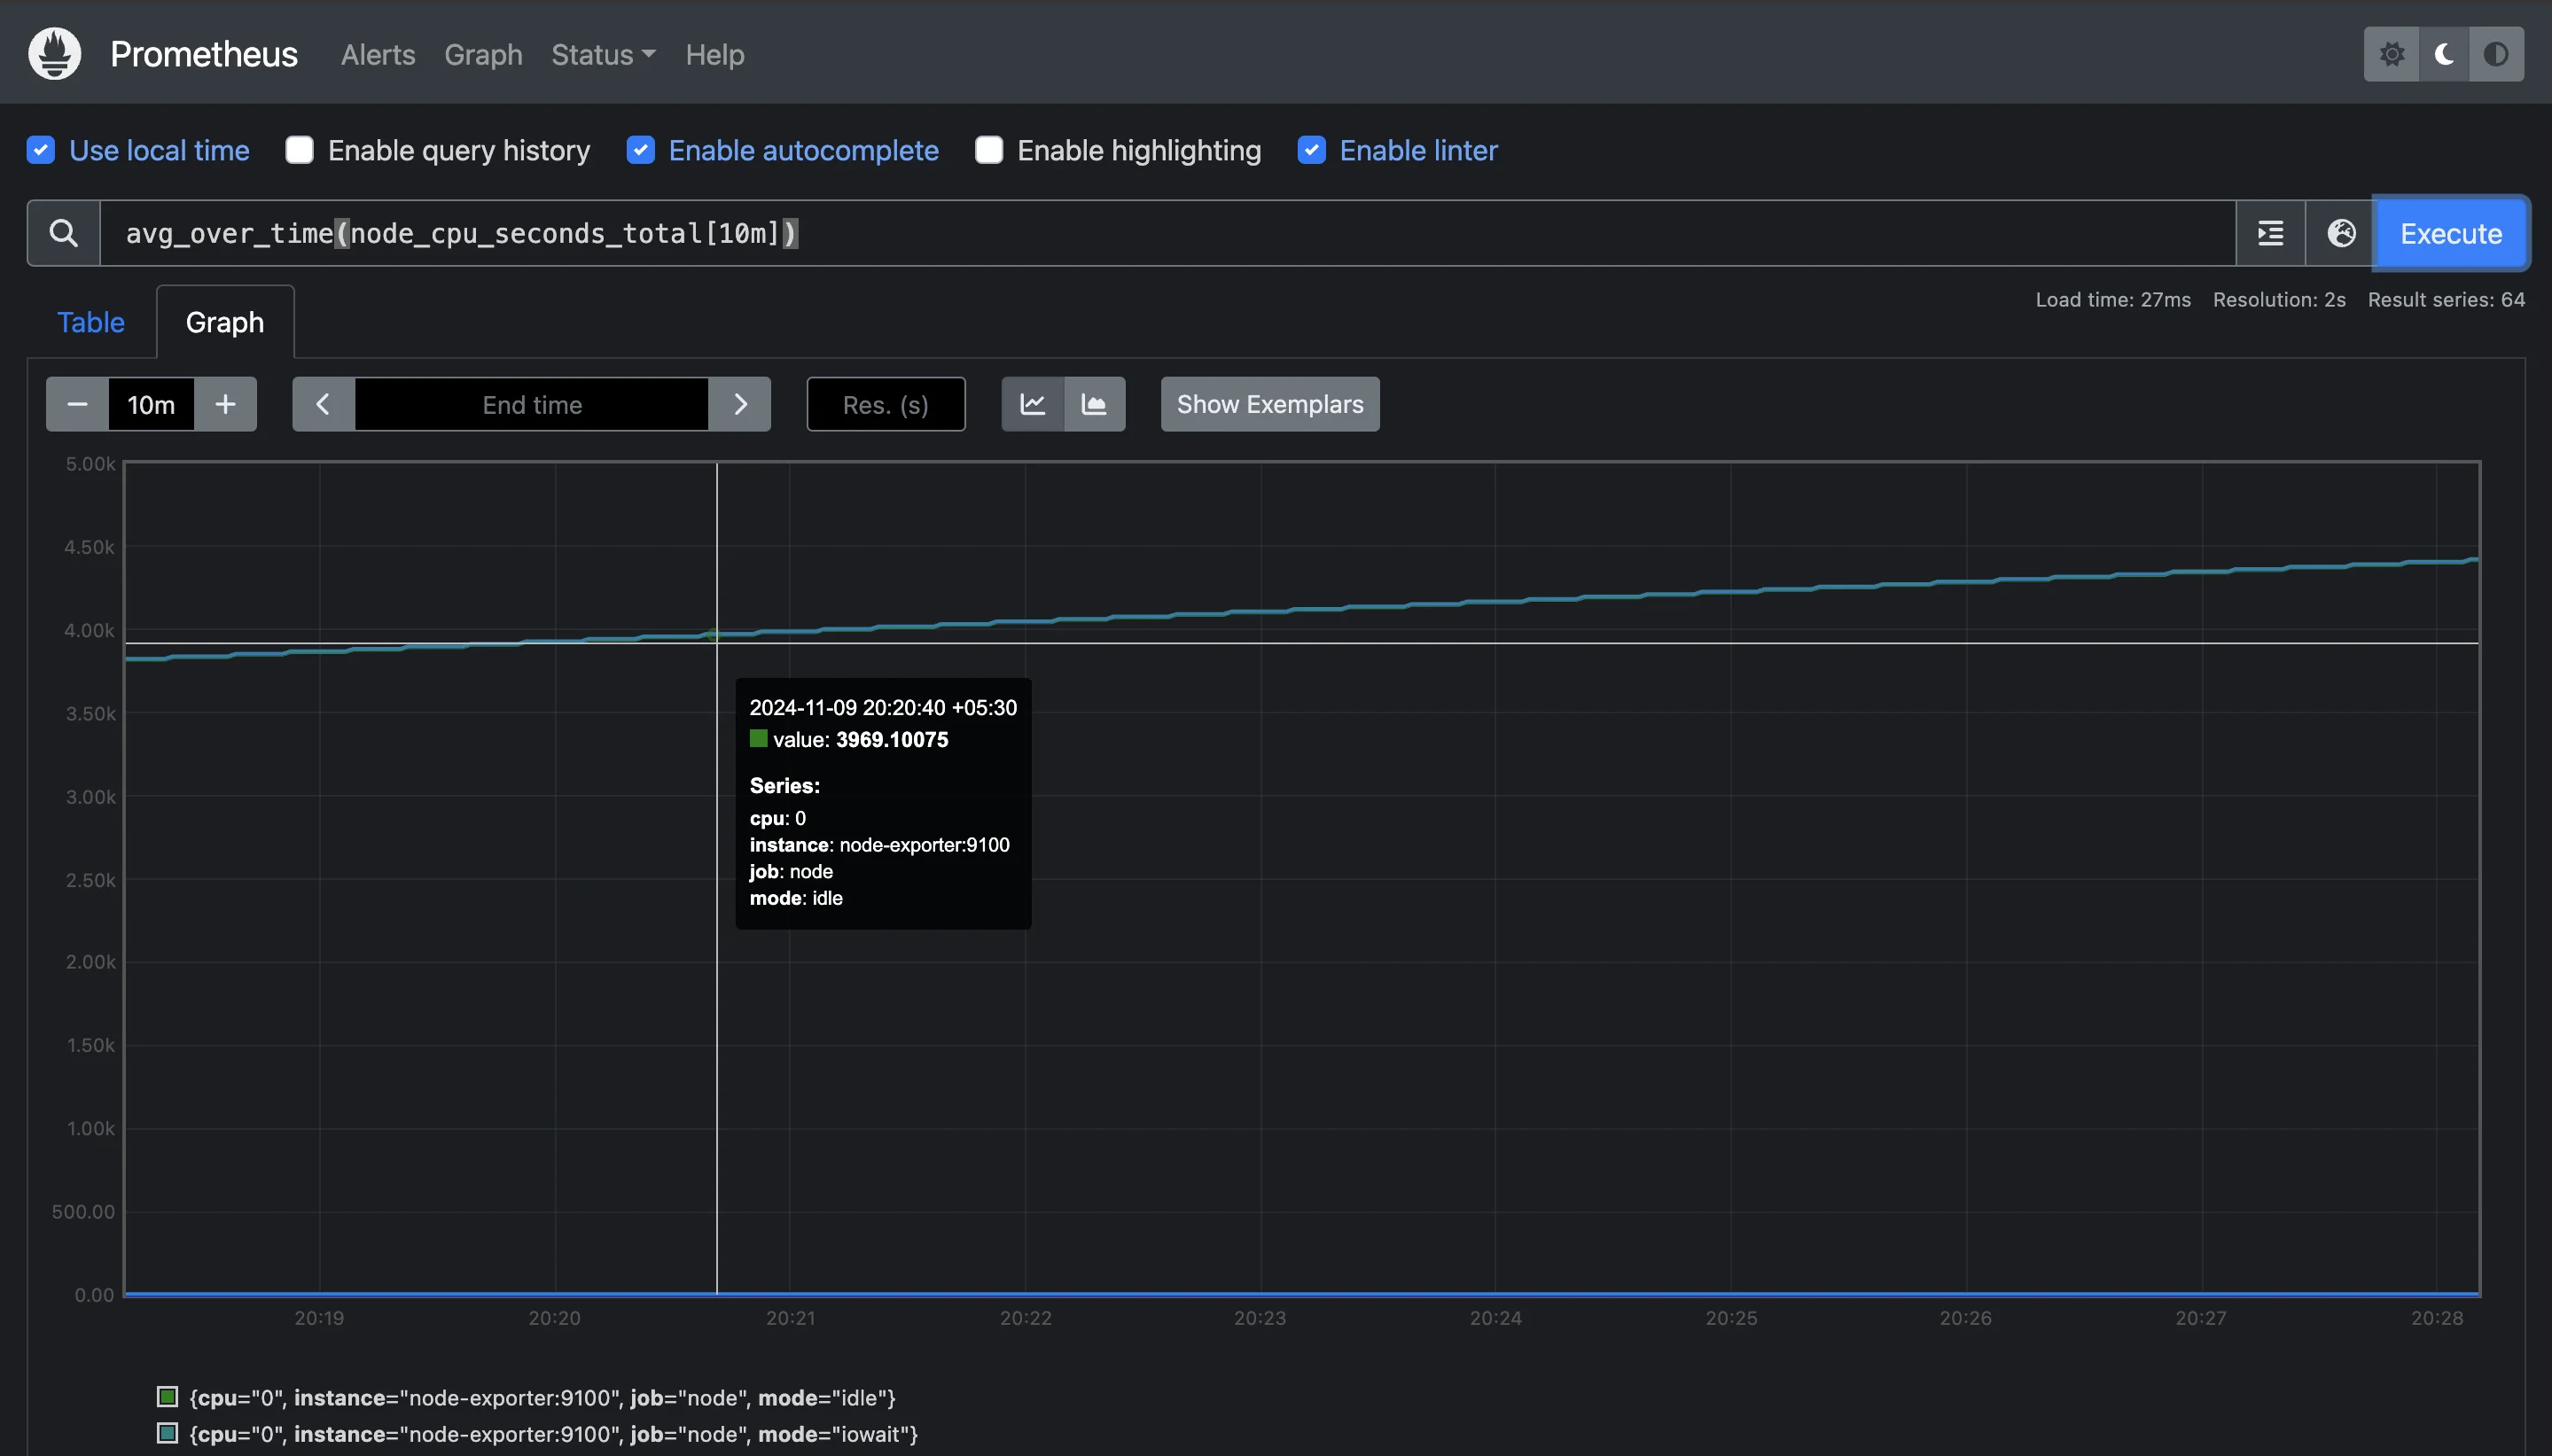
Using `avg_over_time` function for 10min This example gives the average CPU usage over the last 10 minutes. It’s particularly useful for smoothing out fluctuations and understanding general trends.
min_over_timeandmax_over_time: These functions return the minimum and maximum values within the specified time range.min_over_time(node_memory_MemAvailable_bytes[5m]) max_over_time(node_memory_MemAvailable_bytes[5m])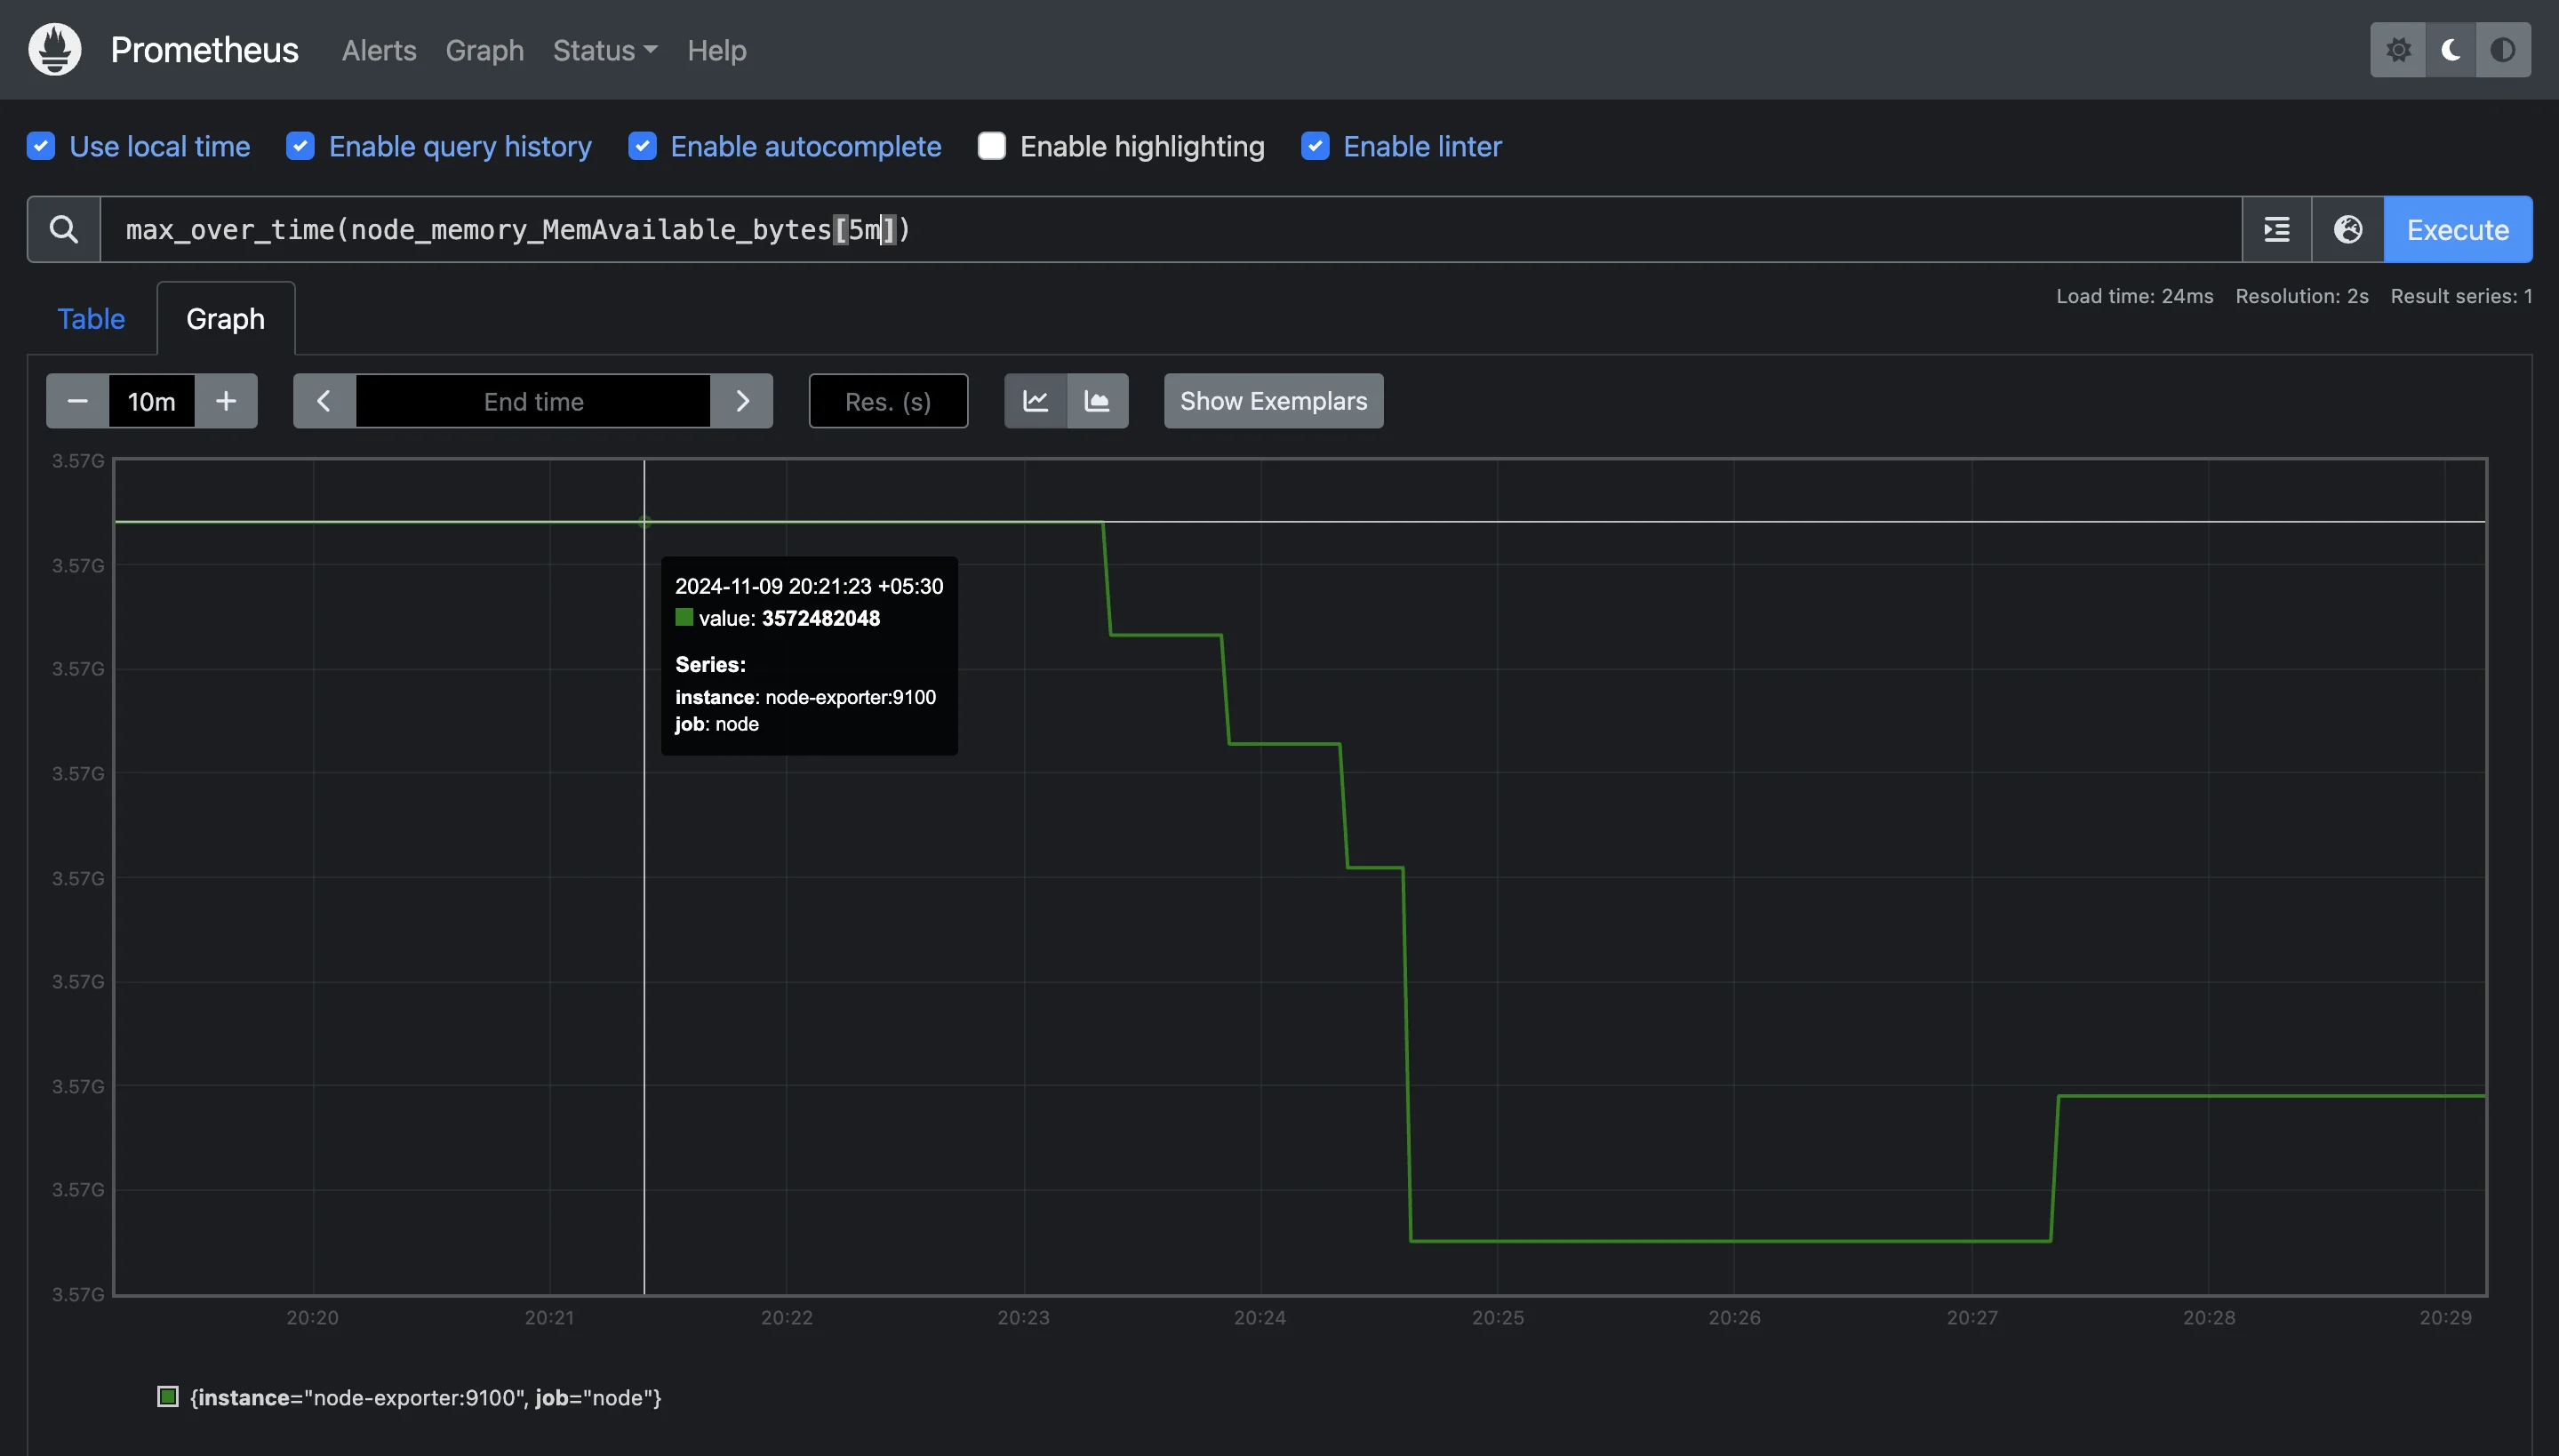
Using `max_over_time` function to identify highest memory availability These queries can help identify the lowest and highest memory availability within the past 5 minutes, providing insight into memory spikes or dips.
sum_over_time: Calculates the total sum of values within the range.sum_over_time(prometheus_http_requests_total[1h])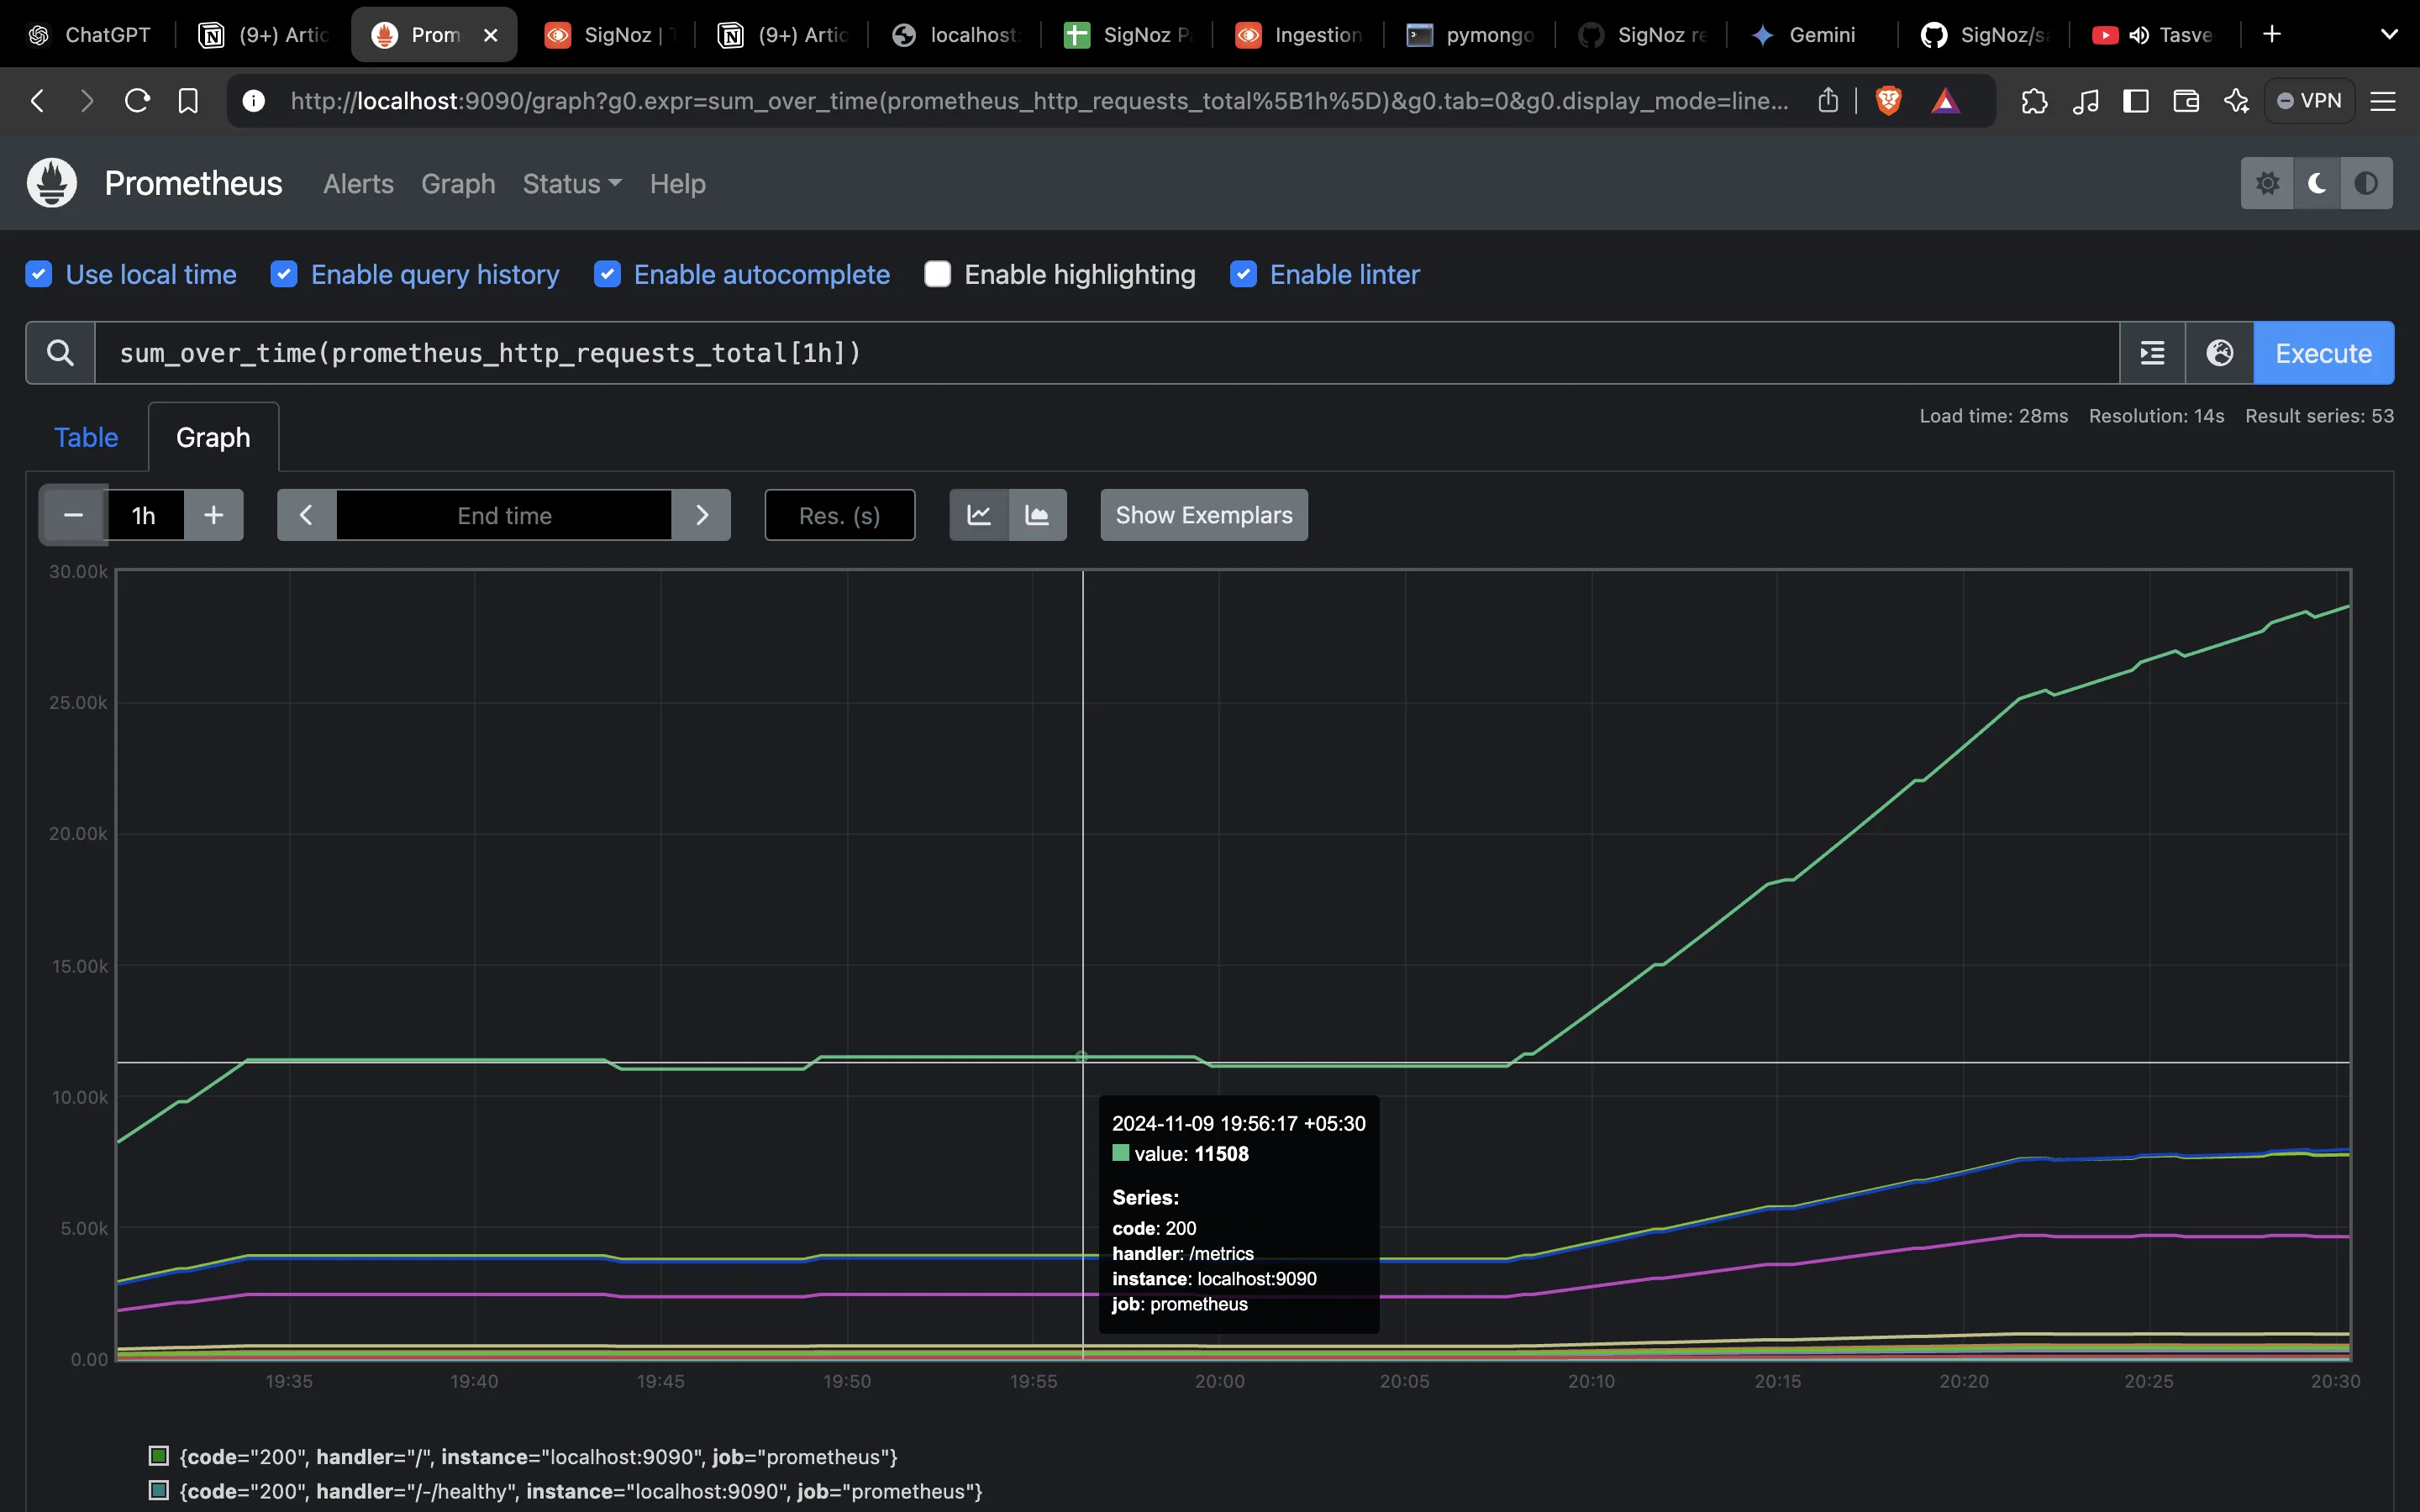
Using `sum_over_time` to add all prometheus HTTP requests over the last hour This example sums all prometheus HTTP requests over the last hour, giving a cumulative count of requests over time.
count_over_time: Counts the number of data points available in the time range.count_over_time(prometheus_http_requests_total[1h])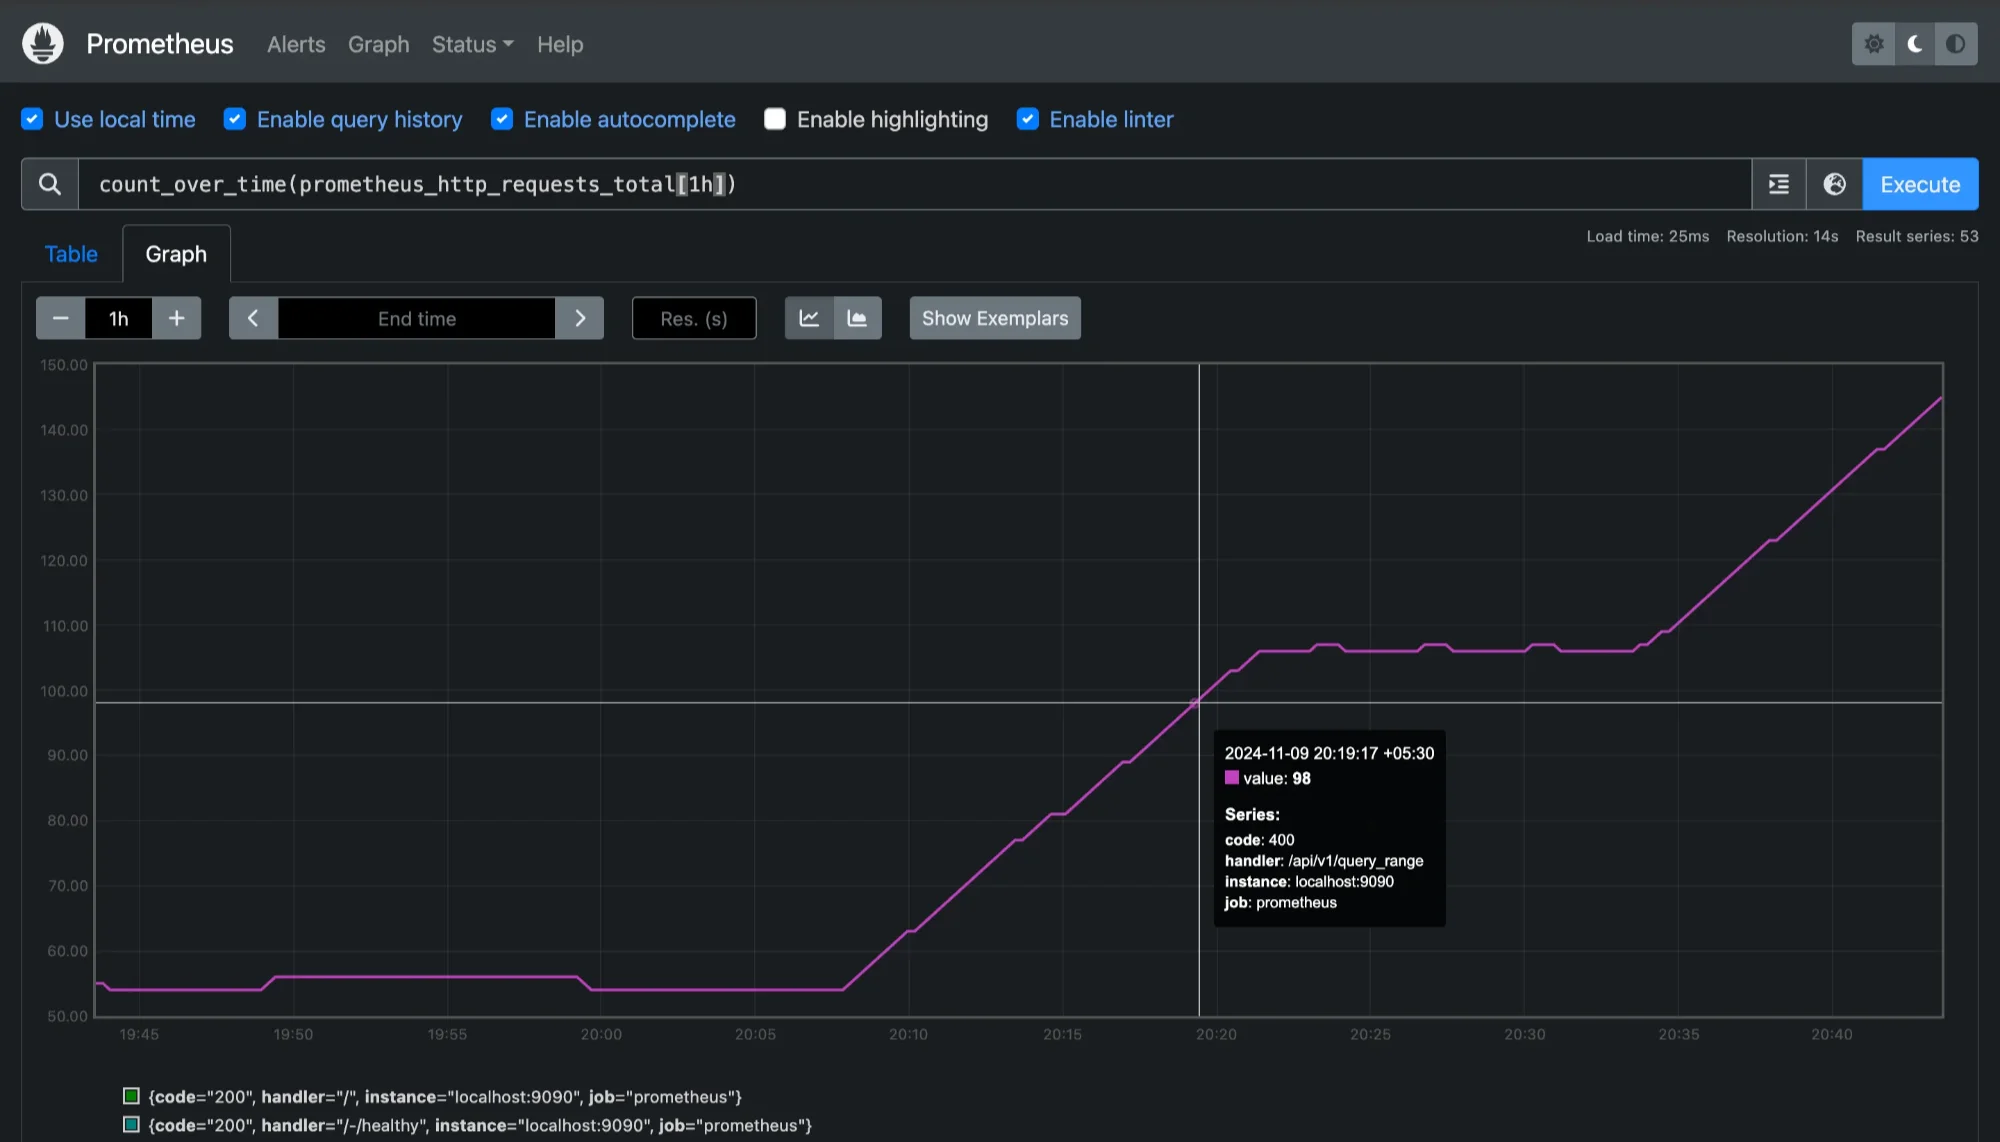
Using `count_over_time`to check data availability This can be useful to check data availability and ensure consistent collection, as it shows the number of samples recorded in the past hour.
When to Use Aggregation Functions Aggregation functions are especially useful when analyzing high-frequency metrics. They help reduce the volume of data by summarizing it, making it easier to visualize and analyze trends without being overwhelmed by individual data points. For example, using avg_over_time to calculate average CPU load over 5 minutes provides a smoothed-out view of CPU performance.
Combining Multiple Range Vectors in Complex Queries
In real-world scenarios, you might need to analyze multiple metrics together. Combining range vectors in a single query allows you to relate different metrics and gain a holistic view of your system’s performance.
Using Mathematical Operators: You can combine range vectors using arithmetic operations such as addition (
+), subtraction (-), multiplication (*), and division (/). Here’s an example:(rate(http_requests_total[5m]) / rate(node_cpu_seconds_total[5m])) * 100This query calculates the HTTP request rate as a percentage of CPU usage, which might be useful in understanding how request load affects CPU performance.
Using Conditional Operators: Prometheus also supports conditional operators (
and,or,unless) that help you filter and compare range vectors:and: Returns values that match in both range vectors.or: Returns values that match in either range vector.unless: Excludes values present in the second vector from the first vector.
For example:
rate(http_requests_total[5m]) and rate(node_cpu_seconds_total[5m])This query returns only data points where both
http_requests_totalandnode_cpu_seconds_totalare present within the last 5 minutes, ensuring you compare data only when both metrics have recorded values.Using Grouping and Aggregation Together
Prometheus supports grouping by specific labels, allowing you to calculate values within each group separately:
sum(rate(http_requests_total[5m])) by (job)This query calculates the sum of HTTP requests in the past 5 minutes, grouped by the
joblabel, so you can see the request rate for each service separately.
Using Subqueries for Nested Range Vector Operations
Subqueries are an advanced feature that lets you nest queries within one another, which is helpful for more complex analyses. They allow you to perform calculations over the results of a query, making it possible to analyze trends or patterns within a specific range.
A subquery is written as a query within square brackets and can have its own time duration.
Syntax:
<query>[<range>]<resolution>
Here’s an example:
avg_over_time(rate(http_requests_total[5m])[1h:])
In this query:
- The inner query
rate(http_requests_total[5m])calculates the rate of HTTP requests over a 5-minute range. - The outer query
avg_over_time(...)then calculates the 1-hour average of this rate.
This structure allows you to calculate a moving average over time, which is useful for detecting trends while smoothing out temporary fluctuations.
Applications of Subqueries
Subqueries in Prometheus enable more complex and powerful query constructions by allowing you to use the results of one query as the input for another. Here are some key applications:
- Rolling Averages: Calculate the average rate or value over time to smooth data.
- Multi-Level Aggregations: Use multiple aggregation functions to obtain more complex summaries.
- Threshold Monitoring: Create subqueries to determine when a metric exceeds a threshold over a certain period.
Performance Optimization Techniques
As range vector queries grow more complex, optimizing them becomes crucial to ensure fast query performance and avoid straining Prometheus resources. Here are some tips:
Use Appropriate Time Durations: Avoid overly large time ranges in high-frequency metrics. For instance, querying
[1w](one week) for metrics recorded every second can result in massive data retrieval. Instead, try limiting range durations to what’s necessary for the analysis.Apply Aggregation Early: Whenever possible, aggregate data early in the query. For instance, summing up data first before combining multiple vectors reduces the amount of data Prometheus has to handle:
sum(rate(http_requests_total[5m])) by (job)This approach aggregates the data by
job, reducing the volume of data before further processing.Avoid Redundant Subqueries: Subqueries can quickly become resource-intensive if not used carefully. If a query doesn’t require a nested calculation, avoid using subqueries.
Filter by Labels: Adding label filters (e.g.,
{job="web_server"}) helps narrow down data selection to only relevant time series, which can significantly speed up query execution. For example:rate(node_cpu_seconds_total{instance="server1"}[5m])This filter limits the data to a specific server instance, reducing the data Prometheus needs to analyze.
Leverage Caching and Timeouts: Prometheus caching settings and timeout configurations can help manage performance when working with complex queries. Check your Prometheus settings to optimize these based on your server resources.
Implementing Range Vectors with SigNoz
Leveraging range vectors in SigNoz can enhance your ability to monitor and analyze time-series data effectively. SigNoz is an open-source observability platform that provides comprehensive monitoring, with support for range vectors to analyze data over specific time windows. This makes it ideal for tracking trends, understanding historical performance, and identifying patterns across your application’s metrics. With SigNoz’s range vector capabilities, you can efficiently observe changes, set up custom alerts, and make data-driven decisions for improved application health.
Here's how you can leverage SigNoz to implement range vectors:
Create a SigNoz Cloud Account SigNoz Cloud provides a 30-day free trial period. This demo uses SigNoz Cloud, but you can choose to use the open-source version.
Clone Sample Go App Repository From your terminal use the following command to clone sample Go app from the GitHub repository.
git clone https://github.com/SigNoz/sample-golang-appAdd .env File to the Root Project Folder In the root directory of your project folder, create a new file named
.envand paste the below details into it:OTEL_COLLECTOR_ENDPOINT=ingest.{region}.signoz.cloud:443 SIGNOZ_INGESTION_KEY=***
OTEL_COLLECTOR_ENDPOINT: Specifies the address of the SigNoz collector where your application will send its telemetry data.SIGNOZ_INGESTION_KEY: Authenticates your application with the SigNoz collector.Note: Replace
{region}with your SigNoz region andSIGNOZ_INGESTION_KEYwith your actual ingestion key.To obtain the SigNoz ingestion key and region, navigate to the “Settings” page in your SigNoz dashboard. You will find the ingestion key and region under the “Ingestion Settings” tab.
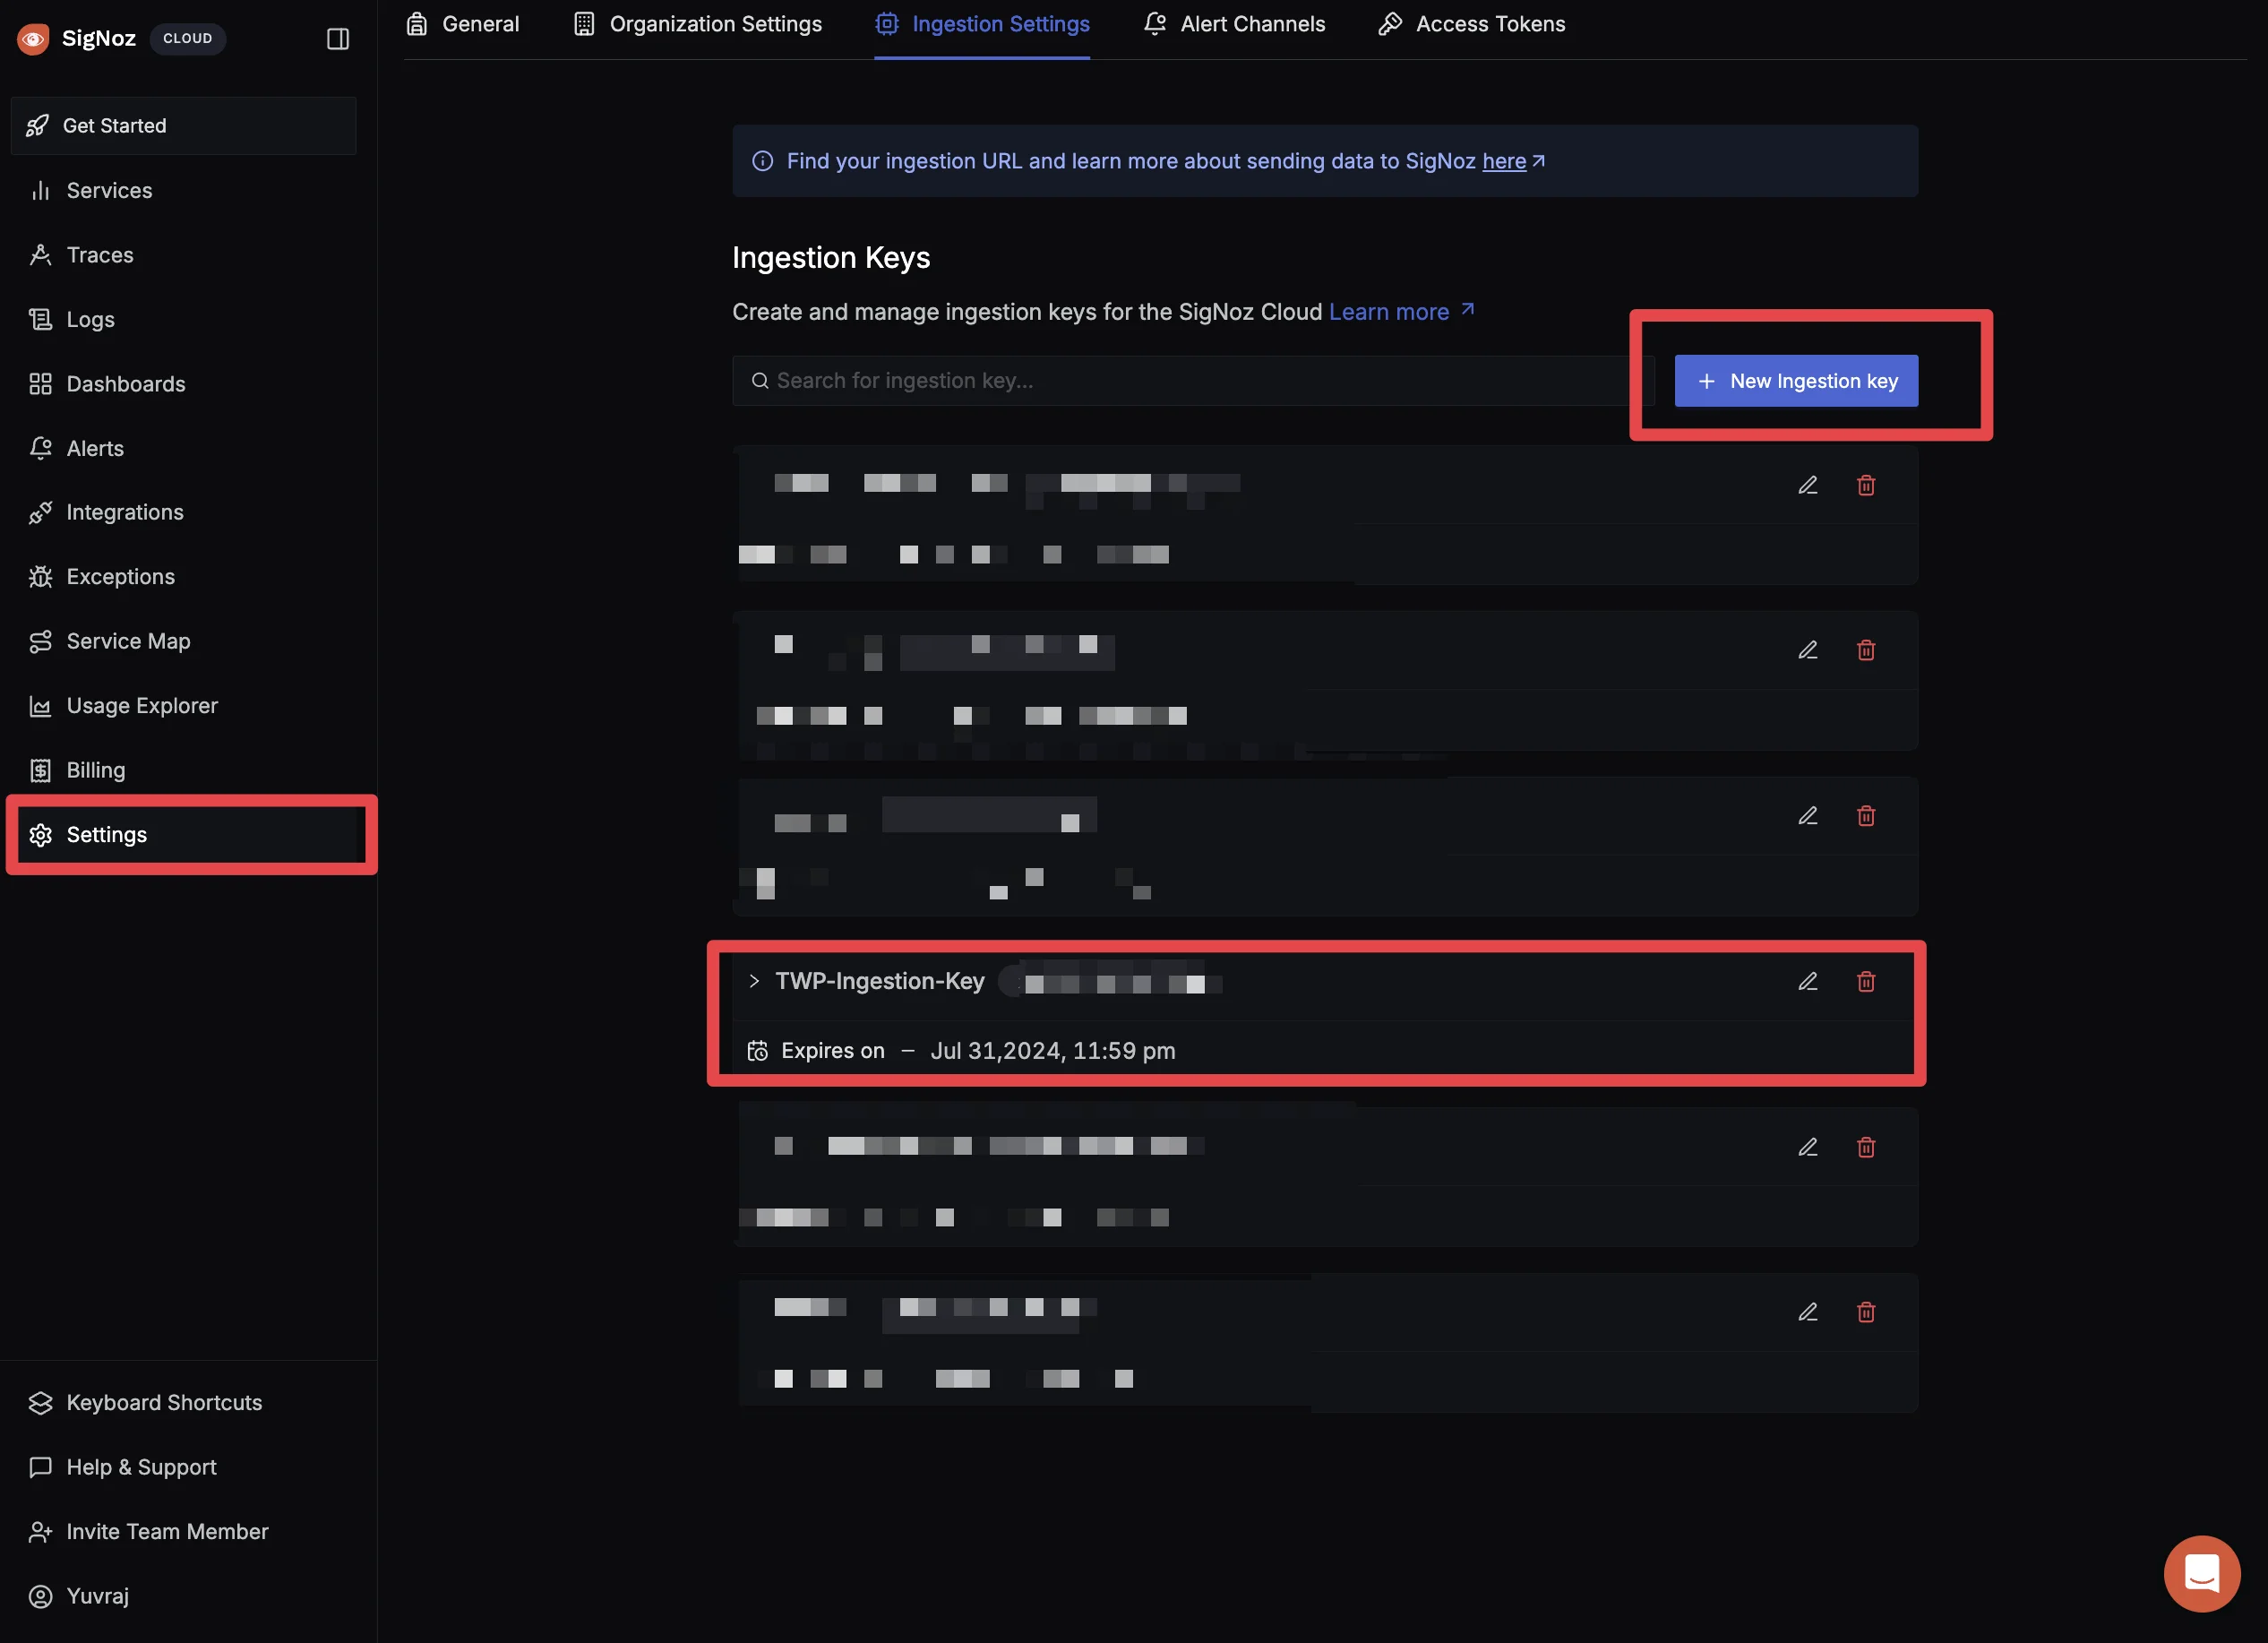
SigNoz Ingestion Settings Page
Using SigNoz Application Monitoring In the top left corner, click on getting started.

SigNoz Dashboard You will be redirected to “Get Started Page”. Choose
Application Monitoringto check latency and how your application is performing.
SigNoz Getting Started Select the Language and Framework of the Application We are using a Go Application which we want to monitor. Select
GoYou can write service name as you want, we are using go.
SigNoz Application Monitoring (Select Data Source) Choose Environment your App is Running On Choose from the environment options that match your setup. Since I'm running this on my Mac, I'm choosing the ARM option.
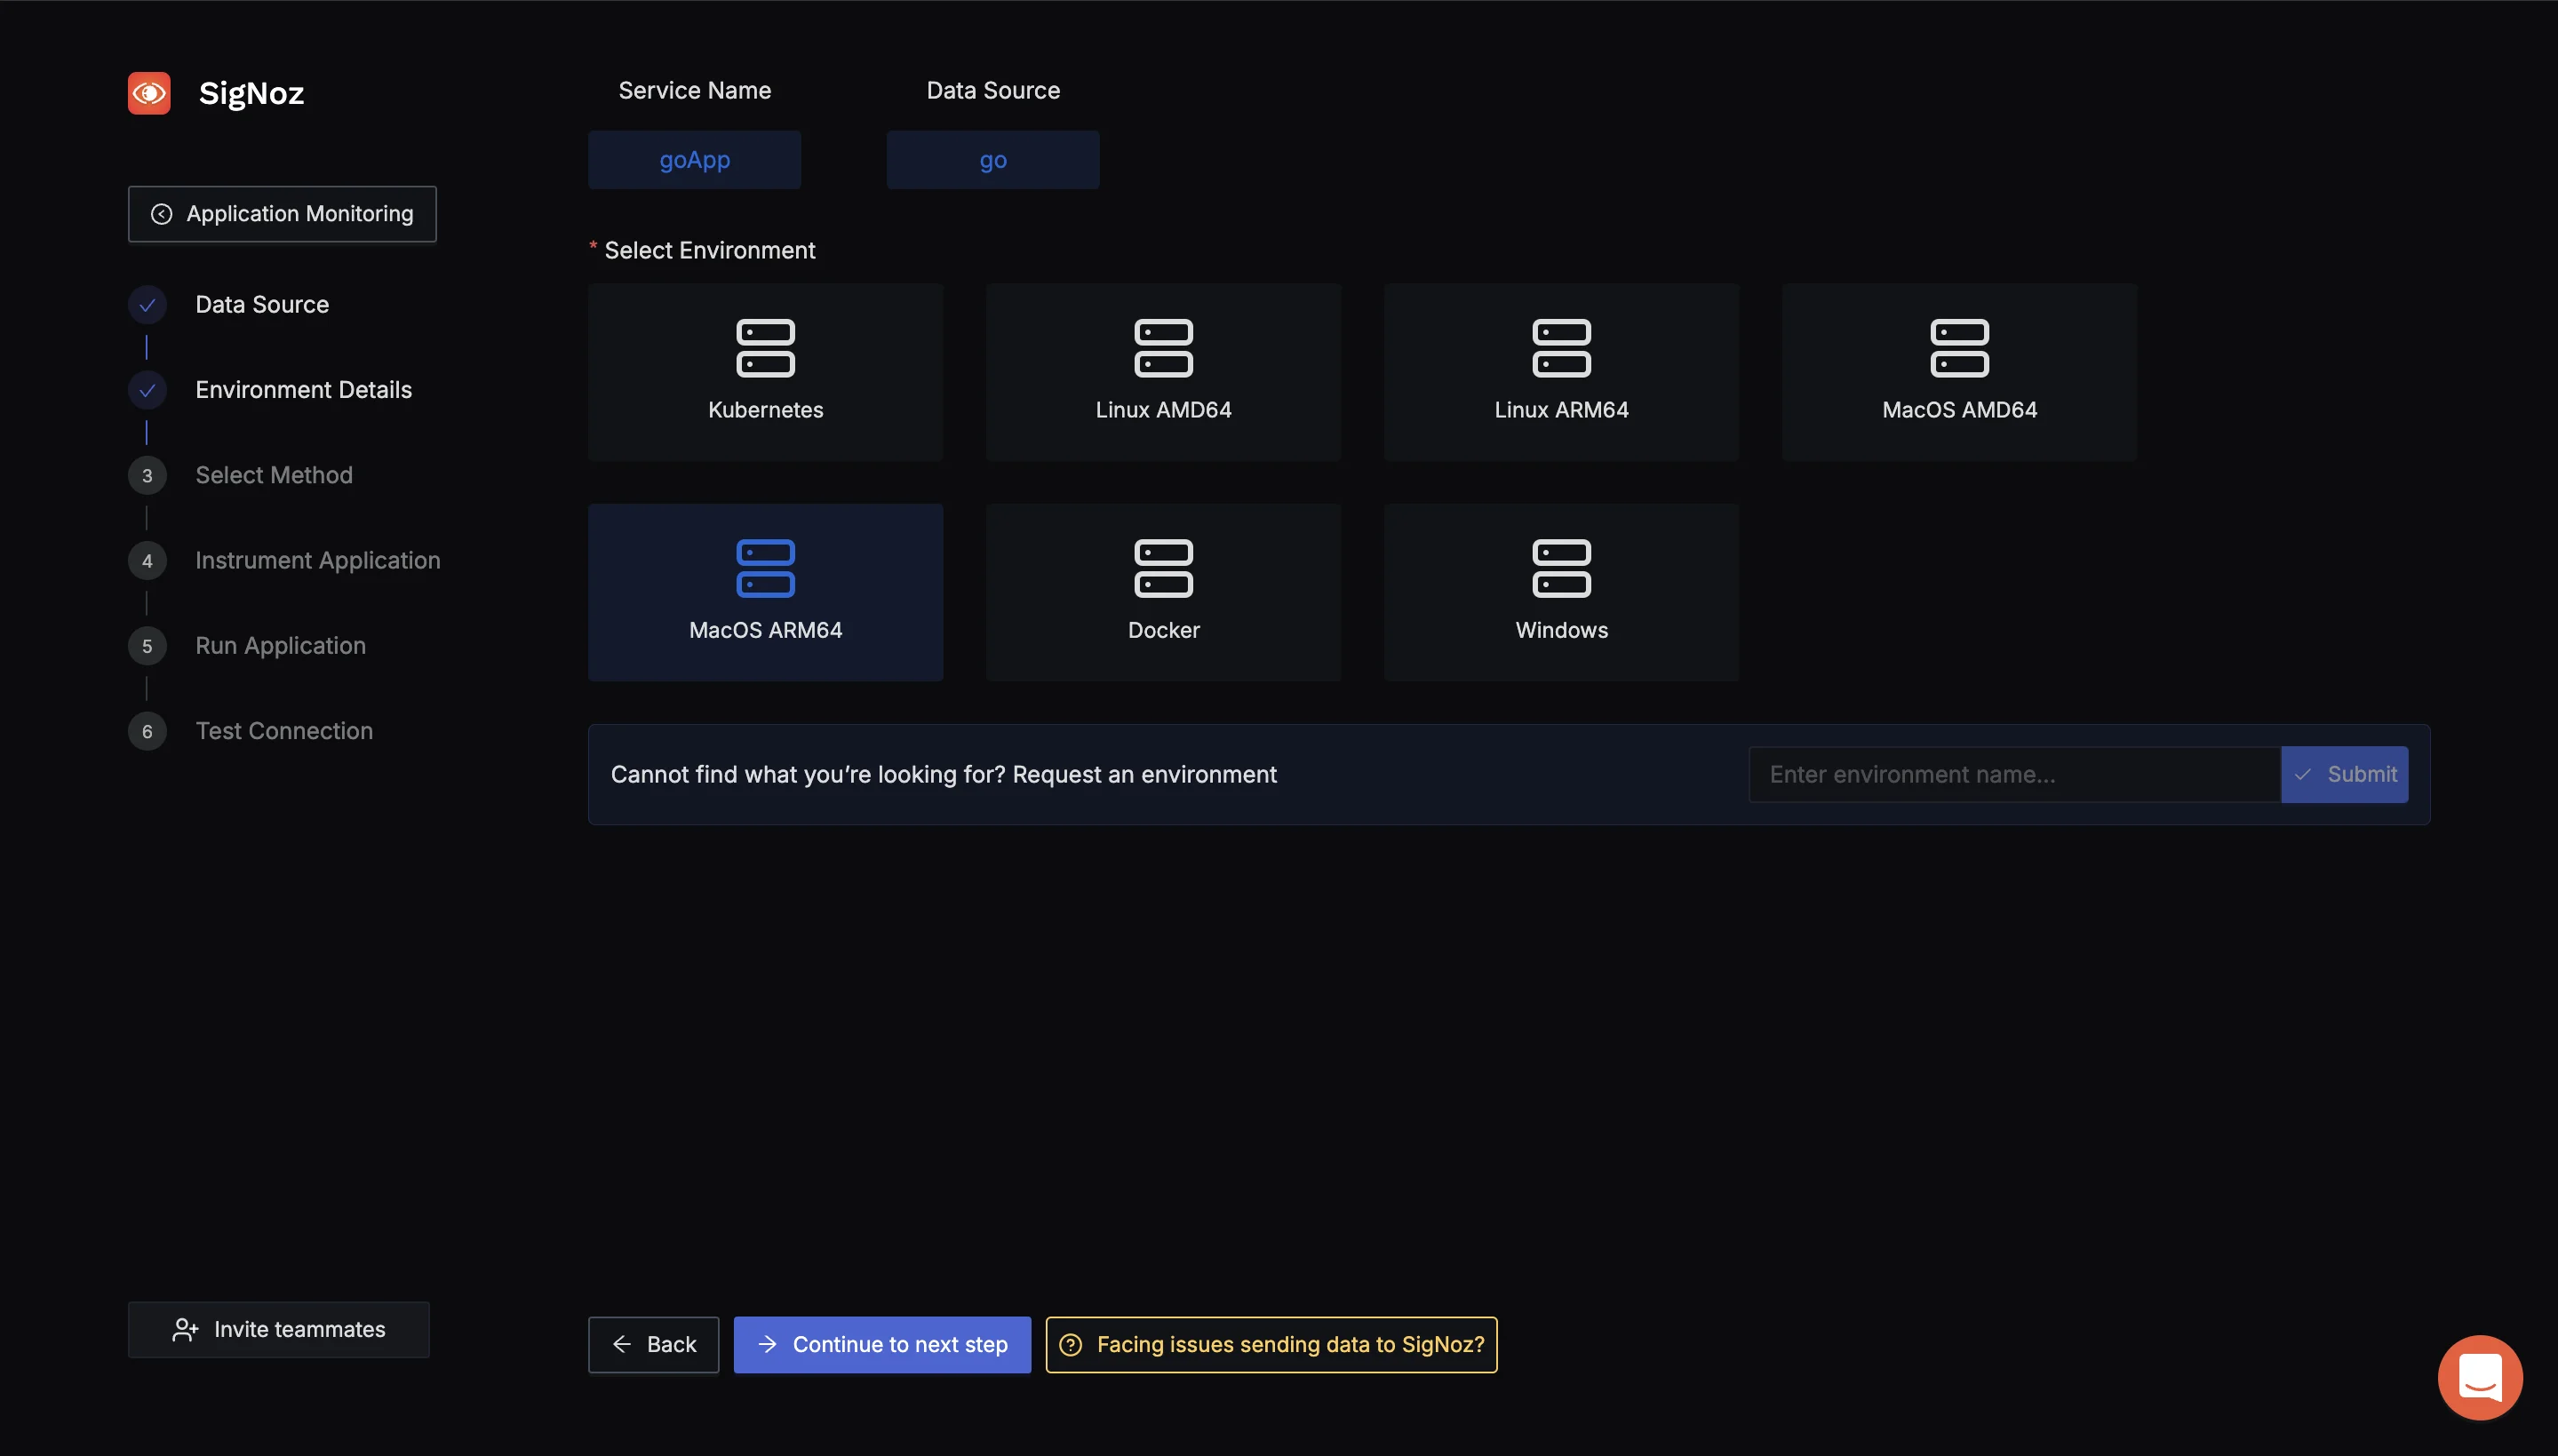
SigNoz Env Details Using OpenTelemtry SDK or Collector to send data to SigNoz : To send data to SigNoz, we will use the OpenTelemetry Collector. The OpenTelemetry Collector is a vendor-agnostic service that receives, processes, and exports telemetry data (metrics, logs, and traces) from various sources to various destinations. For more details, visit OpenTelemetry Collector Guide.

Select the method using to send data to SigNoz OTEL SDK or OTEL Collector to send data. Start Your Application with SigNoz To begin sending telemetry data from your application to SigNoz, use the following command to start your app. This command specifies key configuration details like the service name, access token, and the endpoint for the OpenTelemetry collector.
SERVICE_NAME=goApp
INSECURE_MODE=false
OTEL_EXPORTER_OTLP_HEADERS=signoz-ingestion-key=<SIGNOZ-ACCESS_TOKEN-HERE>
OTEL_EXPORTER_OTLP_ENDPOINT=ingest.{region}.signoz.cloud:443 go run main.go
Verify Your Application in the SigNoz Dashboard: Once your application is running, navigate to the Services tab in the SigNoz dashboard. If everything is set up correctly, you should see your app listed here. From this tab, you can monitor your app's performance metrics, including latency, error rates, and throughput, gaining valuable insights into how your application is performing in real time
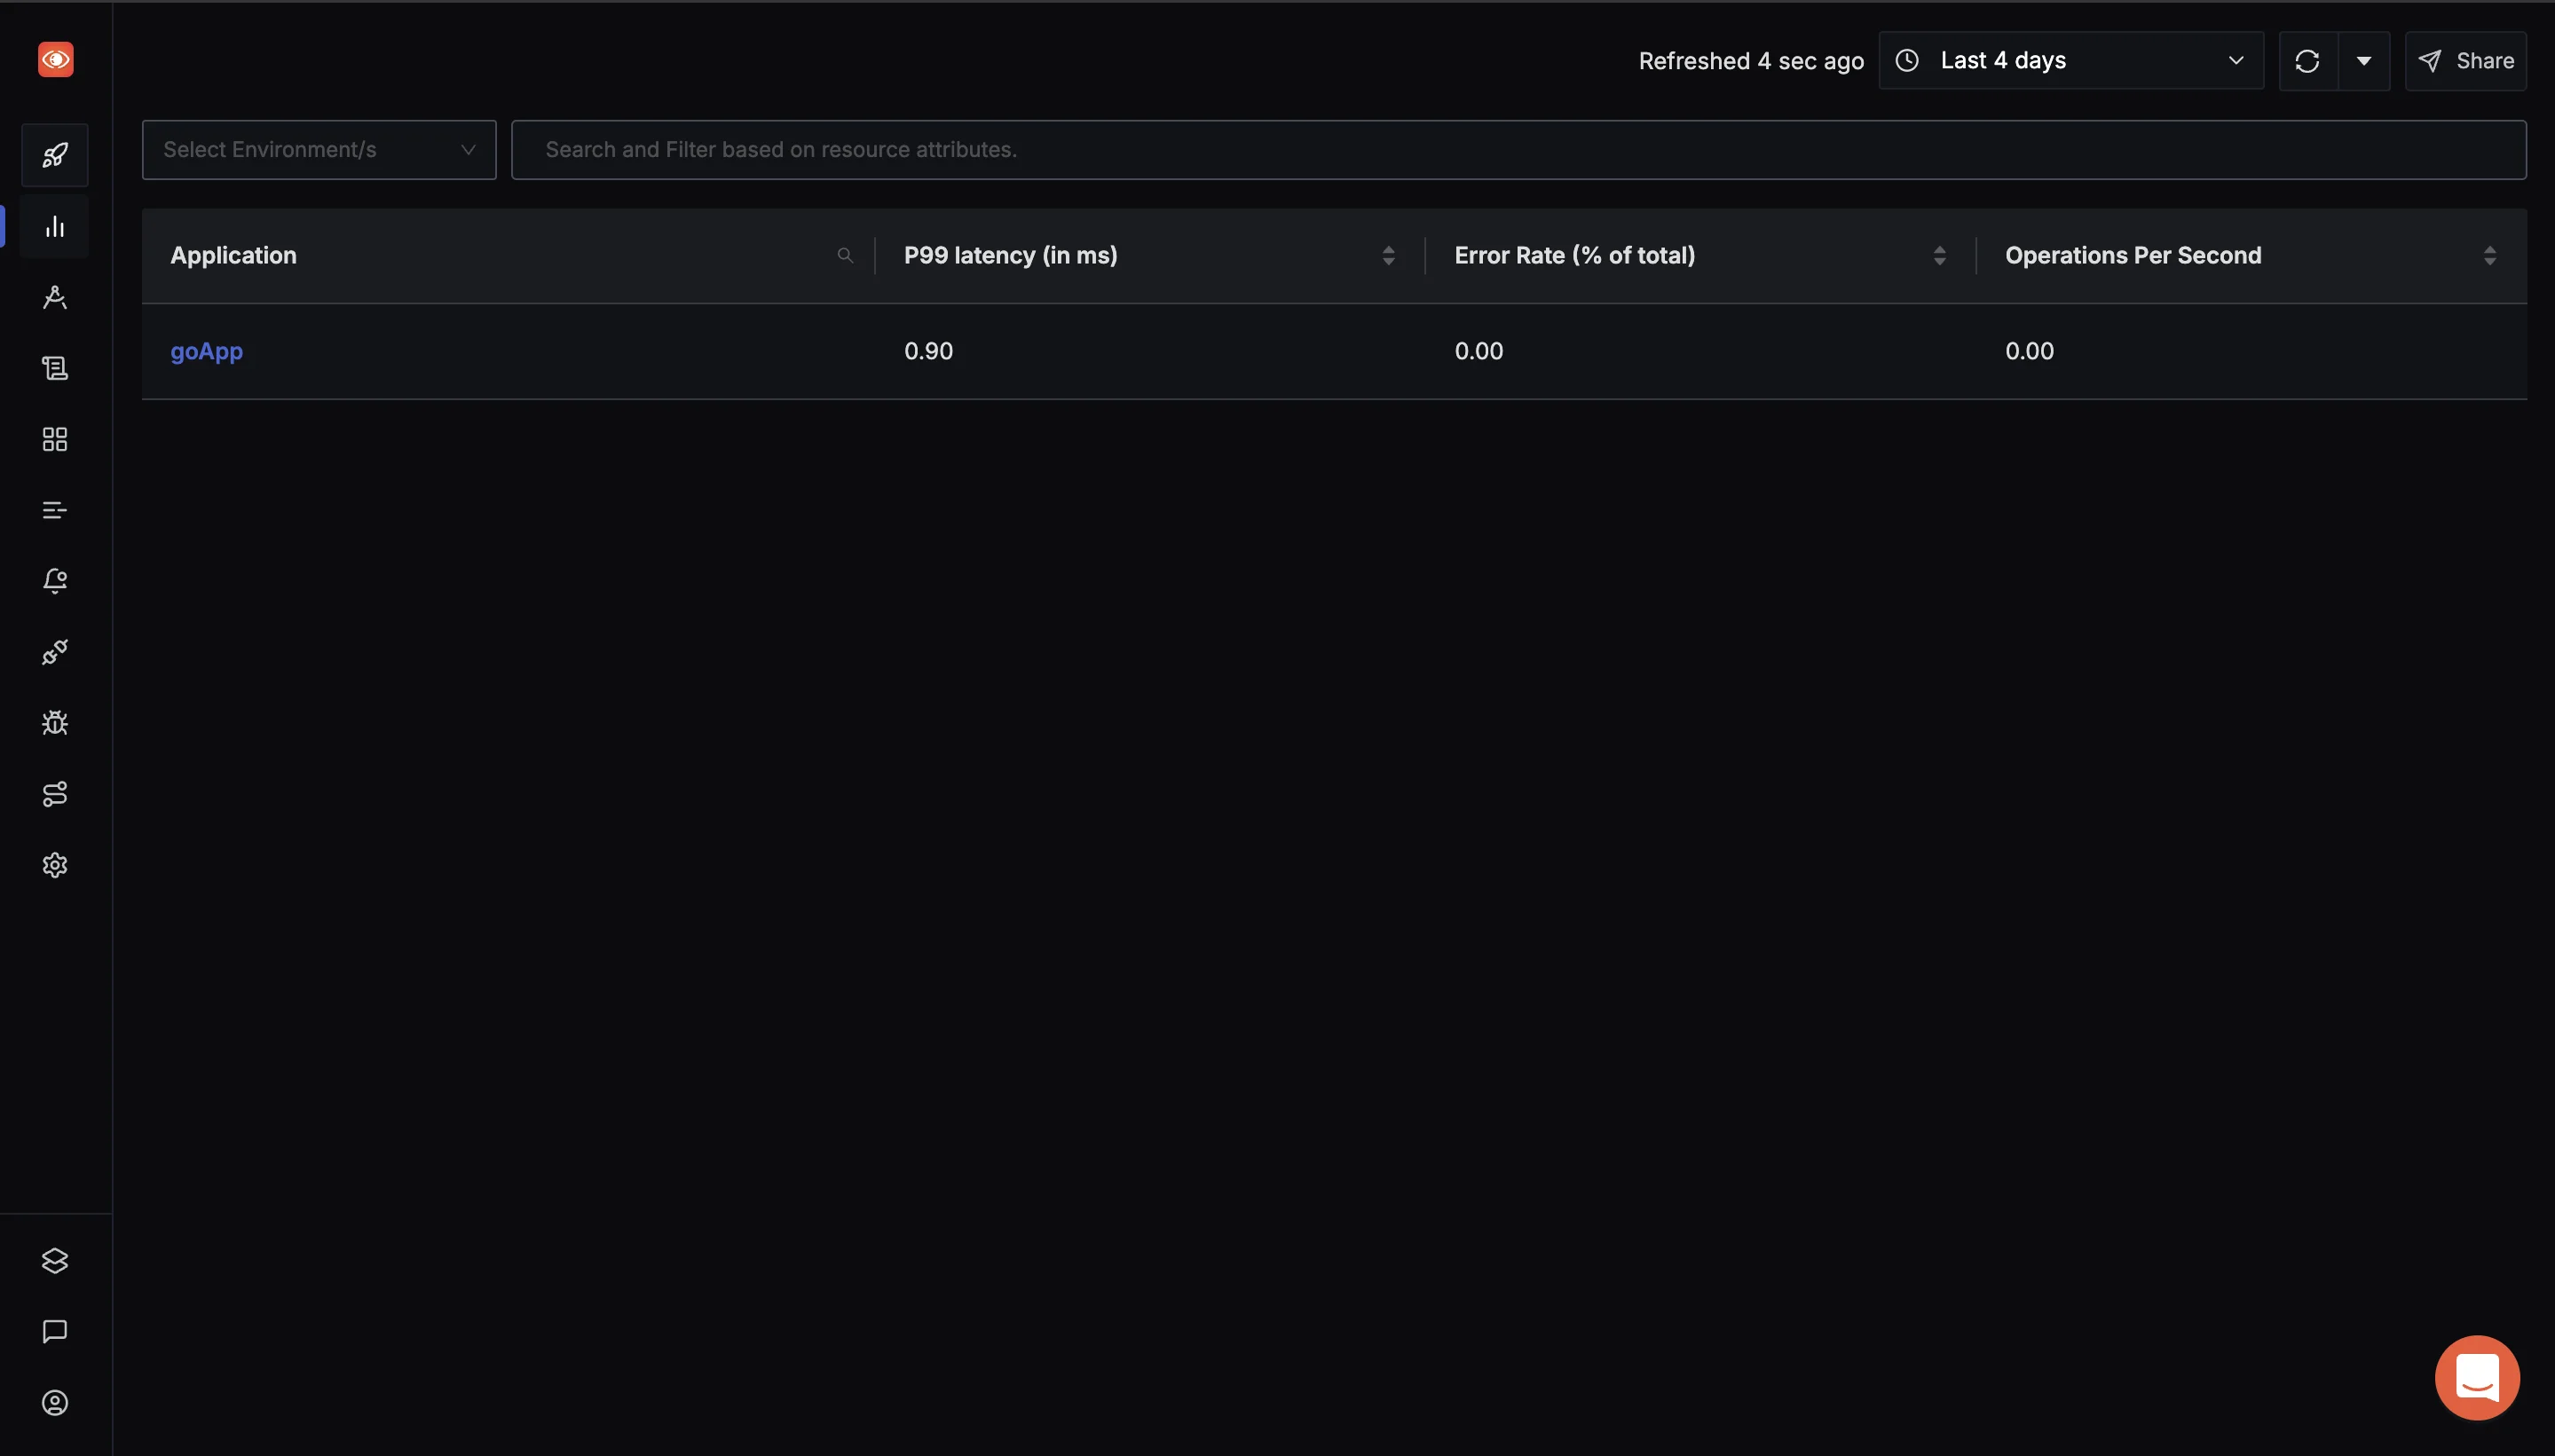
SigNoz Services tab Use Range Vector Queries to Analyze Metrics: Navigate to the Traces section via the sidebar menu in the SigNoz dashboard. In the Search Filter section, input the necessary query expressions. This allows you to filter and analyze specific metrics.
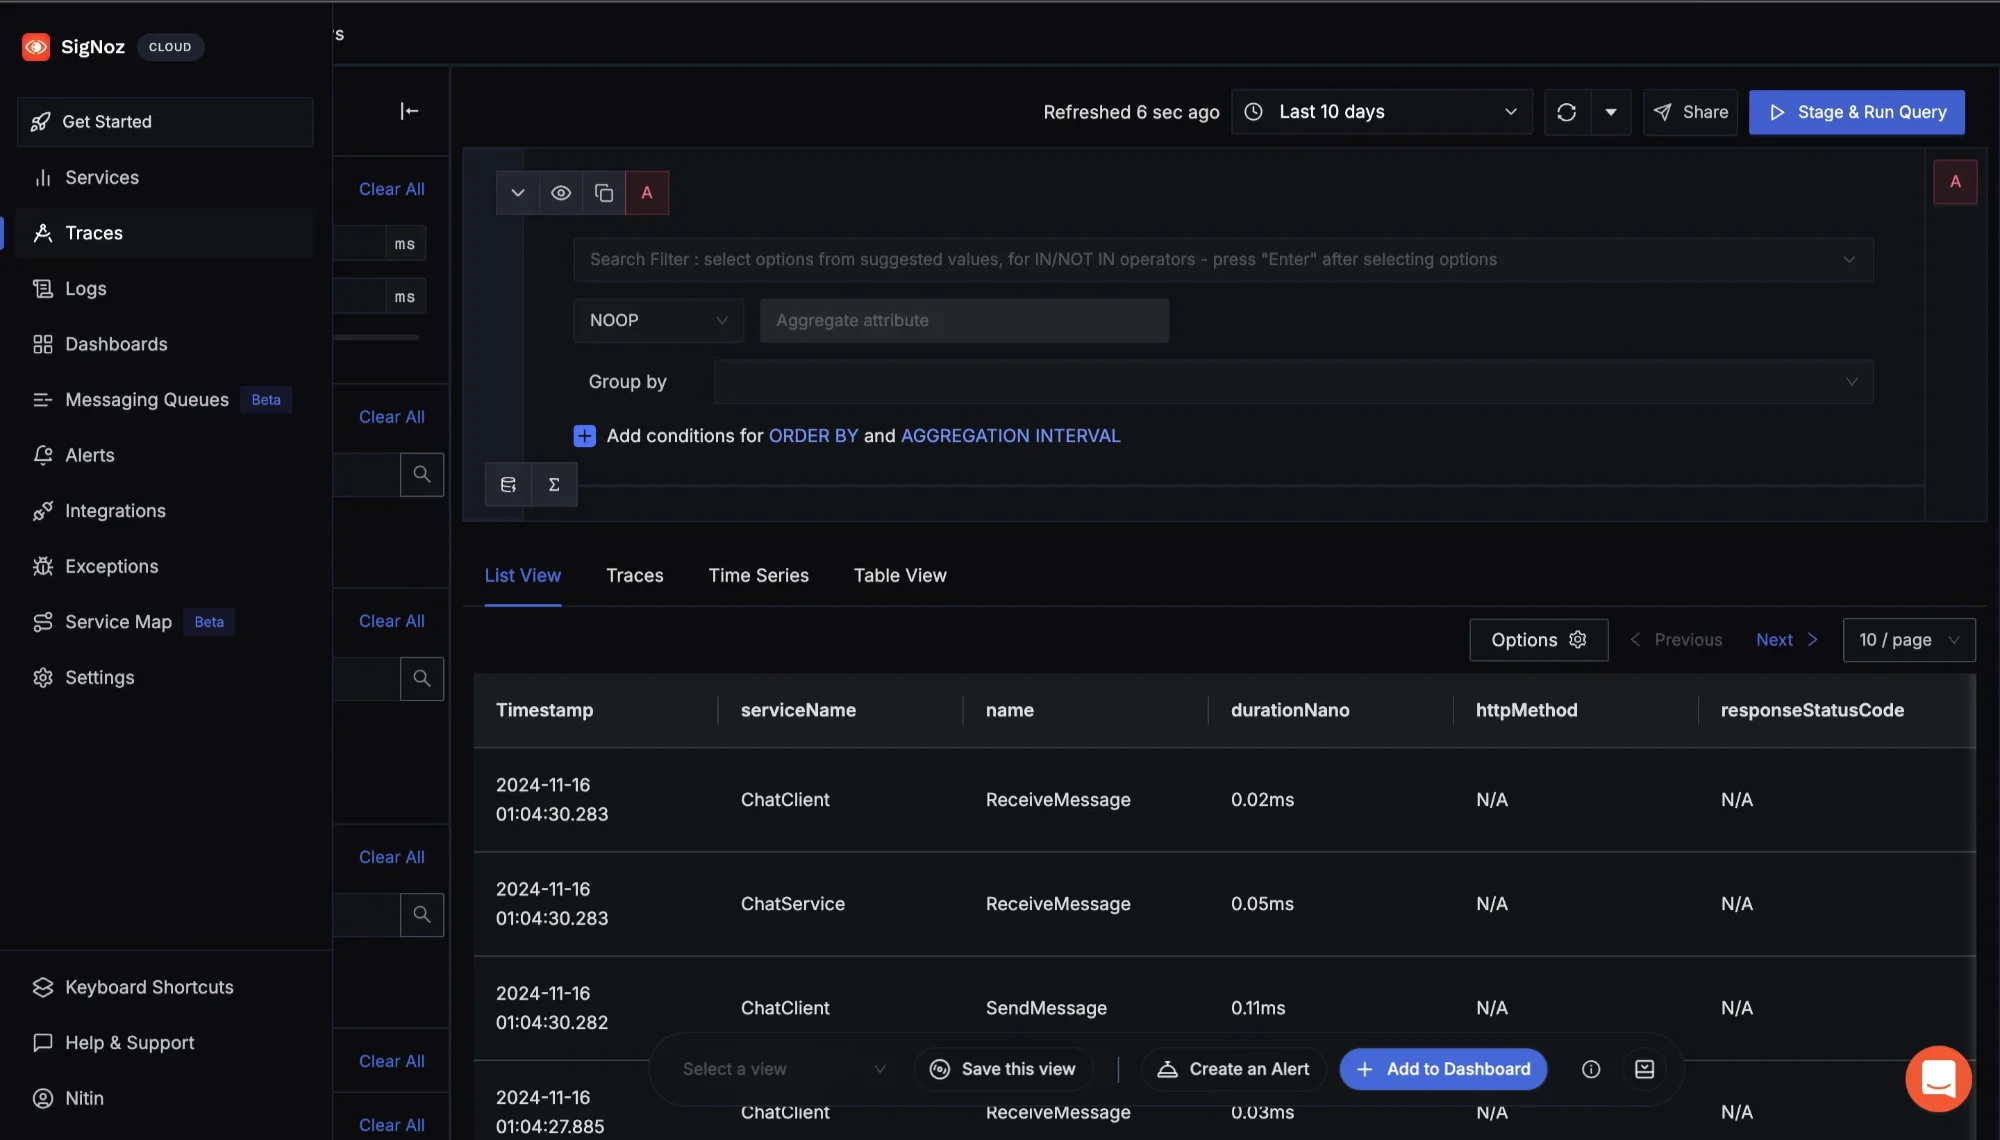
Navigate to Traces to use the Search Filter For instance, to analyze the room temperature over the last 10 minutes, you can use the following range vector query in the SigNoz Metrics Explorer:
room_temperature[10m]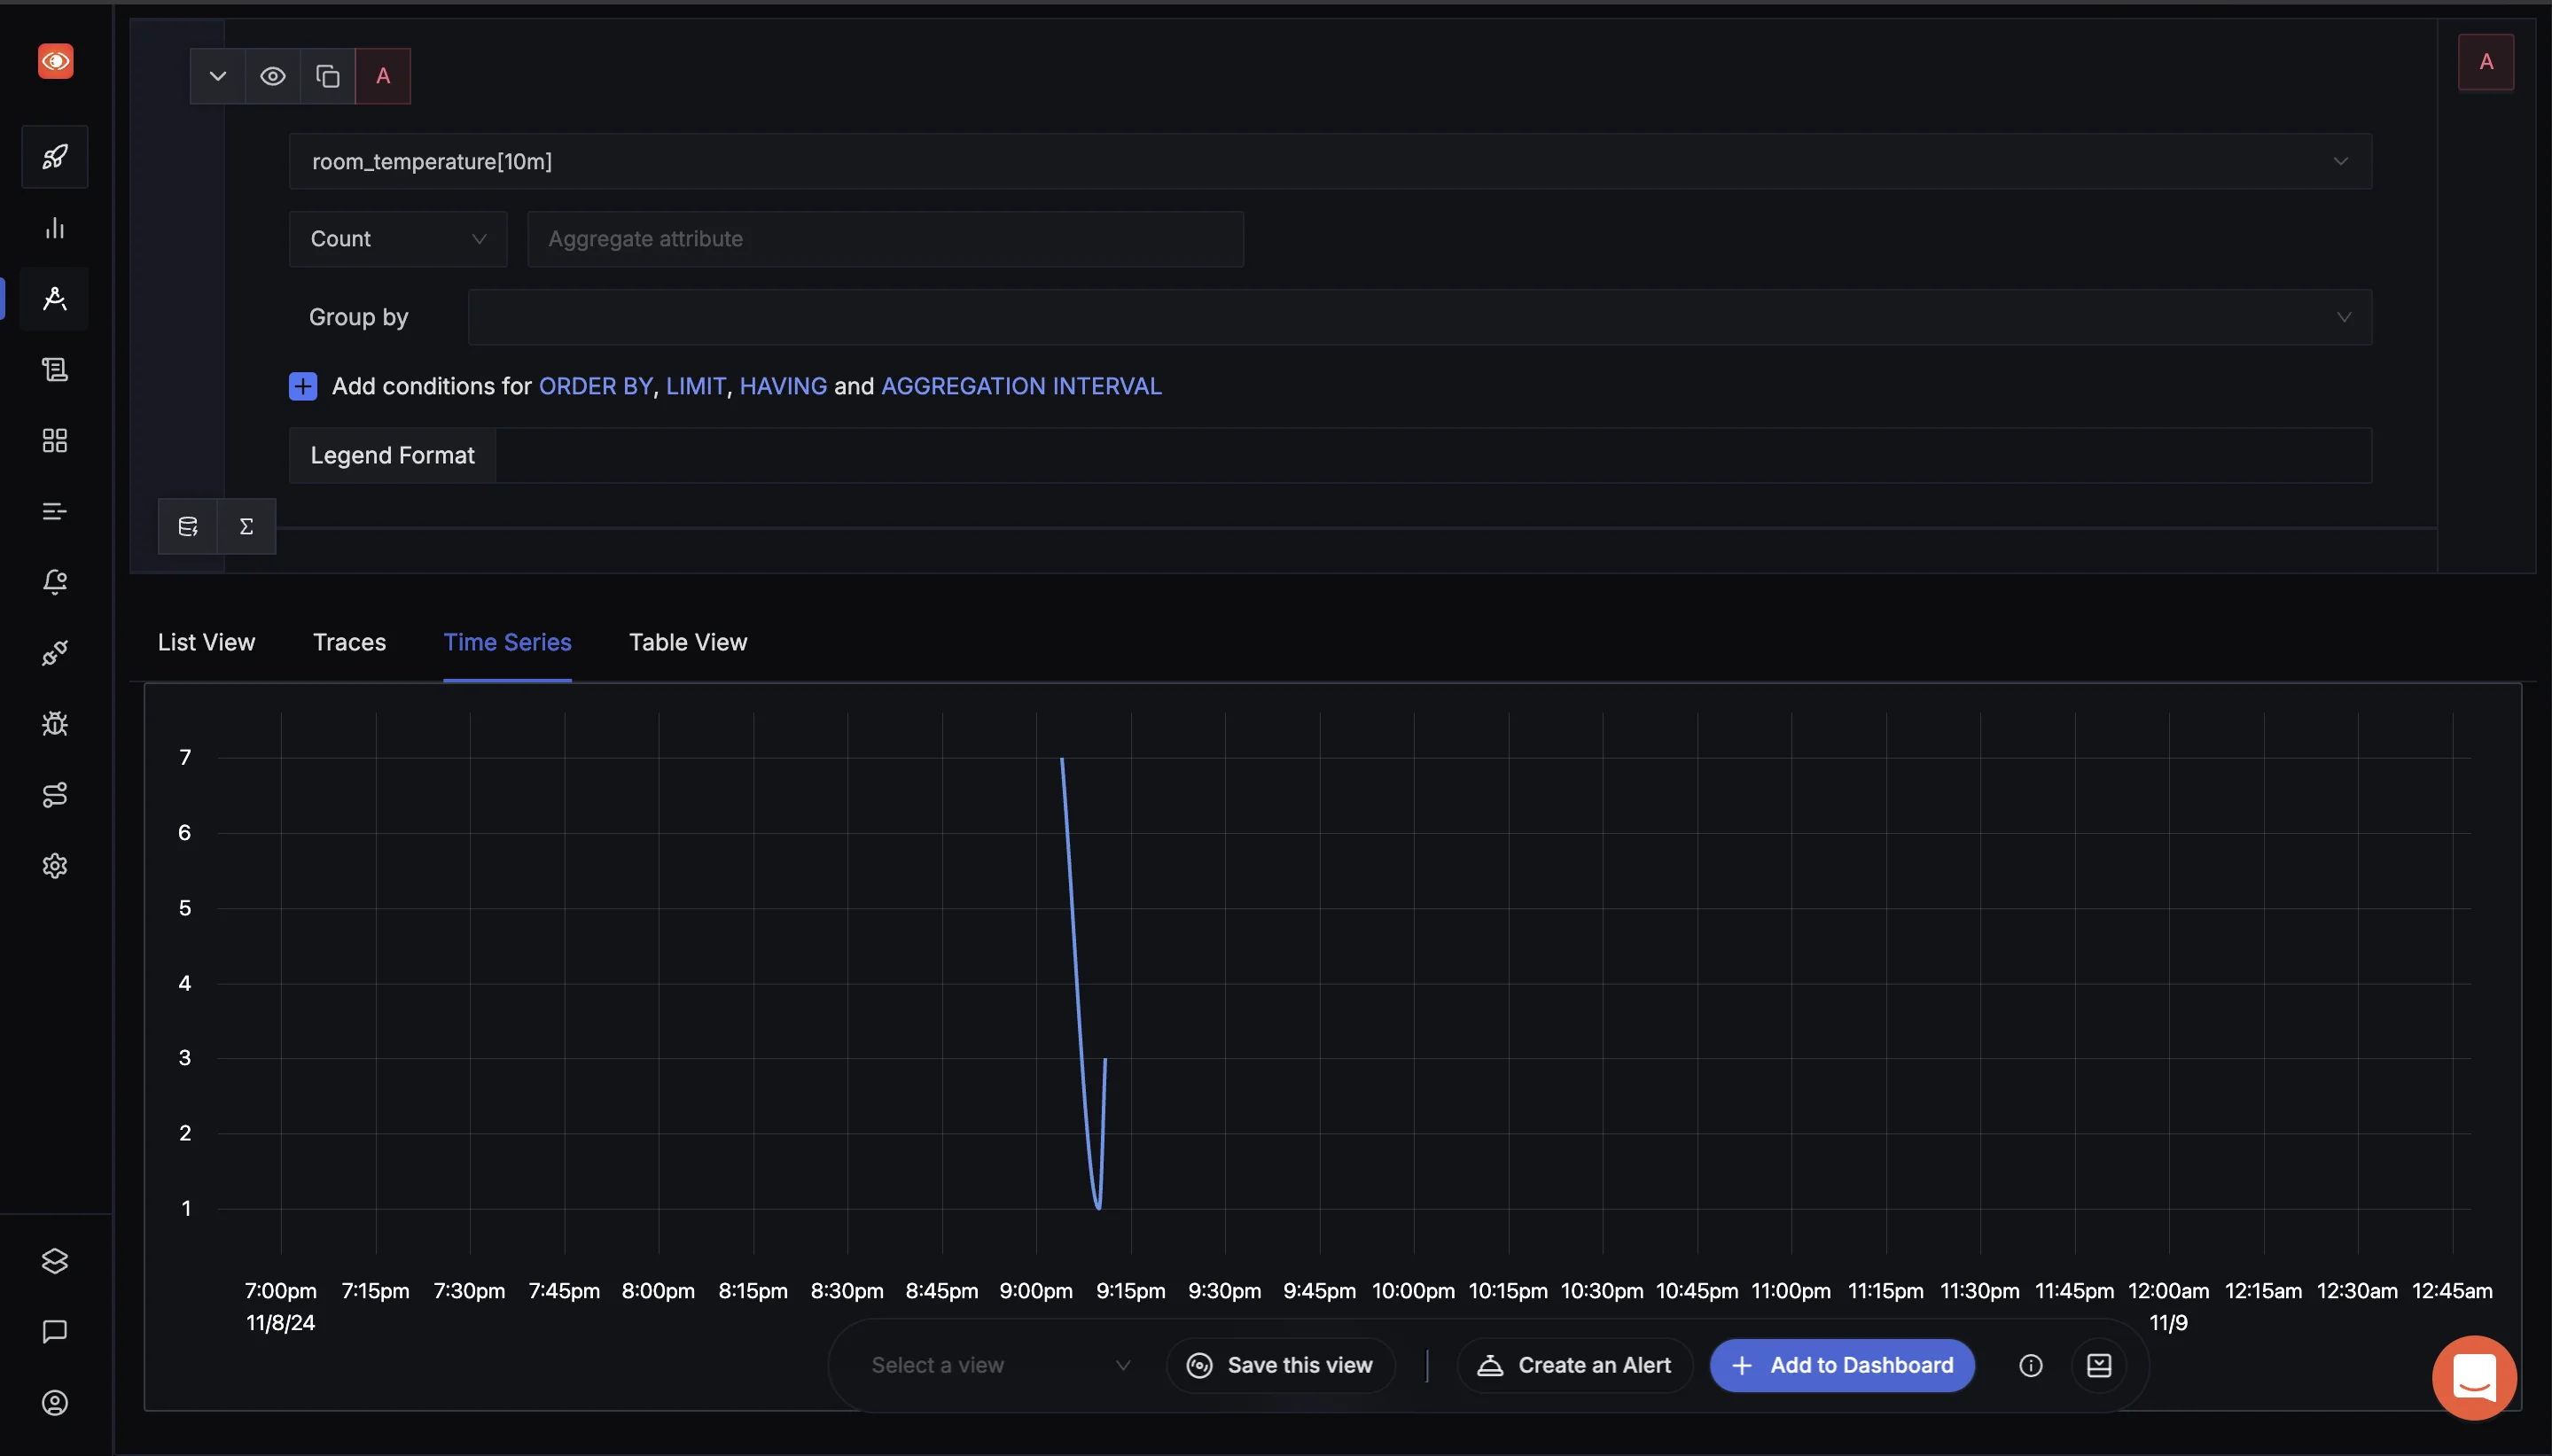
SigNoz Explorers tab This query retrieves the room temperature data for the last 10 minutes, allowing you to monitor any fluctuations or patterns in the temperature during that time period. You can modify the duration (e.g.,
5m,30m) based on the time window you wish to analyze.
By using such queries, you can effectively analyze time-based metrics and gain deeper insights into how your application's performance or environmental factors (like room temperature) evolve over time.
SigNoz cloud is the easiest way to run SigNoz. Sign up for a free account and get 30 days of unlimited access to all features.
You can also install and self-host SigNoz yourself since it is open-source. With 19,000+ GitHub stars, open-source SigNoz is loved by developers. Find the instructions to self-host SigNoz.
Troubleshooting Range Vector Queries
Working with range vector queries in Prometheus can sometimes lead to unexpected results, especially for users new to time series data. Range vector queries allow users to retrieve multiple values over a specified time window, providing a more comprehensive view of metric changes over time. However, when issues arise, they can impact data visibility, performance, and accuracy. Here’s a breakdown of common issues and how to address them effectively.
Common Pitfalls and How to Avoid Them
- No Data Points Returned
- Problem: Sometimes, a query returns no data points, which could be due to mismatched time ranges or gaps in data.
- Solution:
- Ensure the time range in your query matches your data retention settings. Prometheus retains data for a specified duration, so if you query outside that range, you’ll get no results.
- Verify that the metric exists during the specified period. Use a simple
upquery to confirm that Prometheus was scraping data from the relevant target at that time.
- High Cardinality
Problem: High cardinality in queries, especially when grouping by labels with many unique values (like
user_id), can slow down queries and increase memory usage.Solution:
- Group by labels with fewer unique values. For example, instead of grouping by
user_id, consider usinguser_categoryor another higher-level grouping.
plaintext
Copy code
# High cardinality query (slower)
sum(rate(http_requests_total[5m])) by (user_id)

# Reduced cardinality query (faster)
sum(rate(http_requests_total[5m])) by (user_category)
Reducing cardinality not only improves query performance but also ensures your query remains within Prometheus’s memory limits.
- Group by labels with fewer unique values. For example, instead of grouping by
Debugging Query Performance Issues
If your range vector queries are slow, consider these techniques to improve performance:
- Reduce the Query Time Range: Shortening the time range for your query reduces the amount of data Prometheus needs to process, which speeds up execution. For instance, querying
[1m]instead of[5m]can make a noticeable difference. - Use Recording Rules: For complex or frequently used queries, consider setting up recording rules to precompute results. Recording rules store computed values as new time series, allowing you to reference them directly without recalculating each time. This approach is especially useful for queries involving heavy computations or multiple aggregations.
Understanding Staleness and Timestamp Handling
In time series data, “staleness” refers to when Prometheus stops receiving updates for a particular series. If a metric goes missing or stops reporting, Prometheus considers it “stale” and automatically marks it as inactive.
- Staleness Handling: Prometheus assumes a data point is stale if no updates are received within a certain timeframe. To manage this, ensure your scrape intervals and retention policies align with your data availability needs.
- Timestamp Handling: Range vector queries are particularly sensitive to timestamps, as they retrieve data over a specified interval. Ensure that your timestamps align with the scrape intervals and that you’re using consistent time ranges. For instance, querying over
[5m]provides data over a five-minute window, but if timestamps are misaligned, this can lead to empty or inaccurate results.
Best Practices for Query Optimization
To ensure efficient and accurate range vector queries, consider these best practices:
- Use Aggregation Judiciously: Avoid over-aggregation by limiting the number of labels you group by. For example, using
by (service)instead ofby (instance, job, service)can reduce query complexity and improve readability. - Limit Query Complexity: Try to keep queries simple and avoid deeply nested functions whenever possible. For instance, if your query involves multiple
sumandratefunctions, evaluate whether you can simplify the calculation. - Leverage Subqueries When Necessary: If you need to perform calculations over a longer interval but want to avoid excessive memory use, subqueries can be helpful. They allow you to precompute certain parts of a query to make the main query more manageable.
Key Takeaways
- Match Time Ranges with Collection Intervals: Always align your range vector time with the scrape interval to ensure the data is accurate. For example, if your scrape interval is 15 seconds, a range vector with 1-minute duration (e.g.,
metric_name[1m]) will ensure enough samples for reliable analysis. - Choose Functions Carefully: Use
rate()when you need a stable trend based on the average increase over a time range, andirate()when you’re looking for immediate rate changes based on the last two samples. This helps in choosing the right function for either long-term trends or real-time fluctuations. - Be Mindful of Query Performance: Using very long time ranges (e.g., 1 hour or more) can impact system performance, especially if the data volume is high. Optimize queries by selecting the shortest time range that still captures meaningful data for analysis.
- Use Recording Rules for Repeated Queries: If you frequently run the same complex queries, recording rules can store those results for quicker access, reducing the need to recompute them each time and improving dashboard and alert responsiveness.
- Watch for Data Staleness: Range vectors need at least two samples within the selected time range. Gaps larger than
scrape_interval * 5will result in stale data, which Prometheus ignores. Monitor data to avoid any gaps that might lead to incorrect or incomplete results. - Consider Modern Observability Tools: Tools like SigNoz simplify the use of range vectors by offering built-in visualizations and optimizations for Prometheus-compatible data. This can streamline the process, reduce manual configuration, and help manage larger-scale observability needs more effectively.
FAQs
What's the difference between rate() and irate() for range vectors?
rate() calculates the average change over a specified time range, providing a smoother view of trends. In contrast, irate() computes the rate based on the last two samples, making it suitable for volatile metrics. Use rate() for stable trends and irate() for metrics that change frequently.
How do I choose the optimal time range for my queries?
When selecting a time range, it's recommended to choose a range that is at least four times your scrape interval. For example, if your scrape interval is 15 seconds, a minimum time range of 1 minute (60 seconds) is ideal to ensure accurate data representation.
Can I use range vectors in alerting rules?
Yes, you can use range vectors in alerting rules. However, it's advisable to use longer time ranges (greater than 5 minutes) to avoid triggering false alerts from temporary spikes in the data.
How do range vectors handle missing data points?
Range vectors require at least two samples within the specified time range to function correctly. If there are gaps larger than five times the scrape interval, Prometheus will mark the data as stale, impacting the accuracy of your queries.

