Process memory usage plays a crucial role in system performance and application behavior. Visualizing this data through graphs provides invaluable insights for developers and system administrators. By graphing a process's memory usage, you can identify memory leaks, optimize resource allocation, and enhance overall system efficiency. This guide will walk you through the tools, techniques, and best practices for creating informative memory usage graphs across different operating systems.
Understanding Process Memory Usage and Its Importance
Process memory usage refers to the amount of computer memory (RAM) that a running program, or process, consumes. When you run a program or application on your computer, it needs memory (RAM) to operate.
Think of RAM as the workspace where your computer does its thinking—it's like a desk where all the tools and materials you need are spread out. Each project or task you work on is a process, and the space it occupies on your desk represents the process memory usage. If you have a big desk (more RAM), you can spread out more papers and tools without feeling cramped, allowing you to work faster and more efficiently. However, if your desk gets too cluttered with too many projects (high process memory usage), it can become difficult to find space and manage tasks, which can slow you down. Similarly, when your computer’s memory is overused by processes, performance can degrade, making it harder to run additional programs efficiently.
Key Terms to Know
- Resident Set Size (RSS): This is the part of memory that a program is using right now—like the tools and papers currently spread out on your desk. It's the memory that's actively in use.
- Virtual Set Size (VSZ): This is all the memory that a program could use, including stuff that's been set aside for later—like a stack of papers you have stored in a drawer but might pull out when you need them. It's the total space the program has claimed, even if it's not using it all right now.
- Proportional Set Size (PSS): Sometimes, different programs share the same tools or files, like two people using the same book on their desks. PSS divides the memory based on how much each program is actually using. It gives you a better idea of how much memory a program is using when sharing with others.
Significance of Monitoring Memory Usage for System Performance
Monitoring memory usage is crucial for maintaining system efficiency and stability. It helps in:
- Performance optimization: When an application consumes too much memory, it might slow down your entire computer. By monitoring memory utilization, you may see which apps are creating issues and either close them or find a means to reduce memory usage.
- Resource allocation: Your computer has to divide its memory between all the programs you're running. If one program takes too much, others might not get enough, leading to slow performance. Monitoring memory helps you make sure everything is balanced.
- Memory leak detection: Sometimes, a program might keep using more and more memory without letting go of what it no longer needs. This is called a "memory leak," and it can eventually cause your computer to crash. By watching memory usage over time, you can catch these issues before they get out of hand.
- Capacity planning: If you notice that your programs are regularly using up most of your memory, it might be time to consider upgrading your computer's RAM. Monitoring memory usage helps you figure out if you need more resources as your needs grow.
Benefits of Visualizing Memory Usage through Graphs
Utilizing Graphs to visualize memory usage provides several benefits, which include:
- Trend analysis: You can spot patterns by looking at memory usage over time. If your computer uses more memory at certain times of the day, or if a particular program is always using more than others, a graph makes these patterns easy to see.
- Anomaly detection: Sometimes, memory usage might suddenly spike or drop. These surprises could be signs of a problem, like a memory leak or a sudden increase in workload. A graph helps you spot these changes quickly.
- Comparative analysis: If you're trying to decide which of two programs is better for your computer, a graph can show you which one uses memory more efficiently. It's like comparing how much space each one takes up on your desk.
- Communication tool: If you need to show someone else (like a boss or a client) that there's a memory issue, a graph is an easy way to do it. Instead of explaining numbers, you can just show them the graph and let them see the problem for themselves.
Tools for Graphing Process Memory Usage
Understanding which tools are available for graphing process memory usage is essential, especially when managing system resources. Different tools are suited to different operating systems, and each comes with its own strengths and challenges. Below, we’ll explore some commonly used tools, breaking down what makes each one useful.
Linux-Specific Tools
top and htop:
topandhtopare essential tools for real-time monitoring of system performance, including memory usage. These utilities display live updates of how much memory each process is consuming.- Pros: They are built-in to most Linux distributions and are straightforward to use, making them accessible even for those new to Linux. The visual interface of
htopprovides an easier-to-read output compared totop. - Cons: The primary limitation of these tools is their lack of advanced graphing features. They display memory usage data in a text format, which is useful for immediate analysis but not ideal for long-term monitoring or trend visualization.
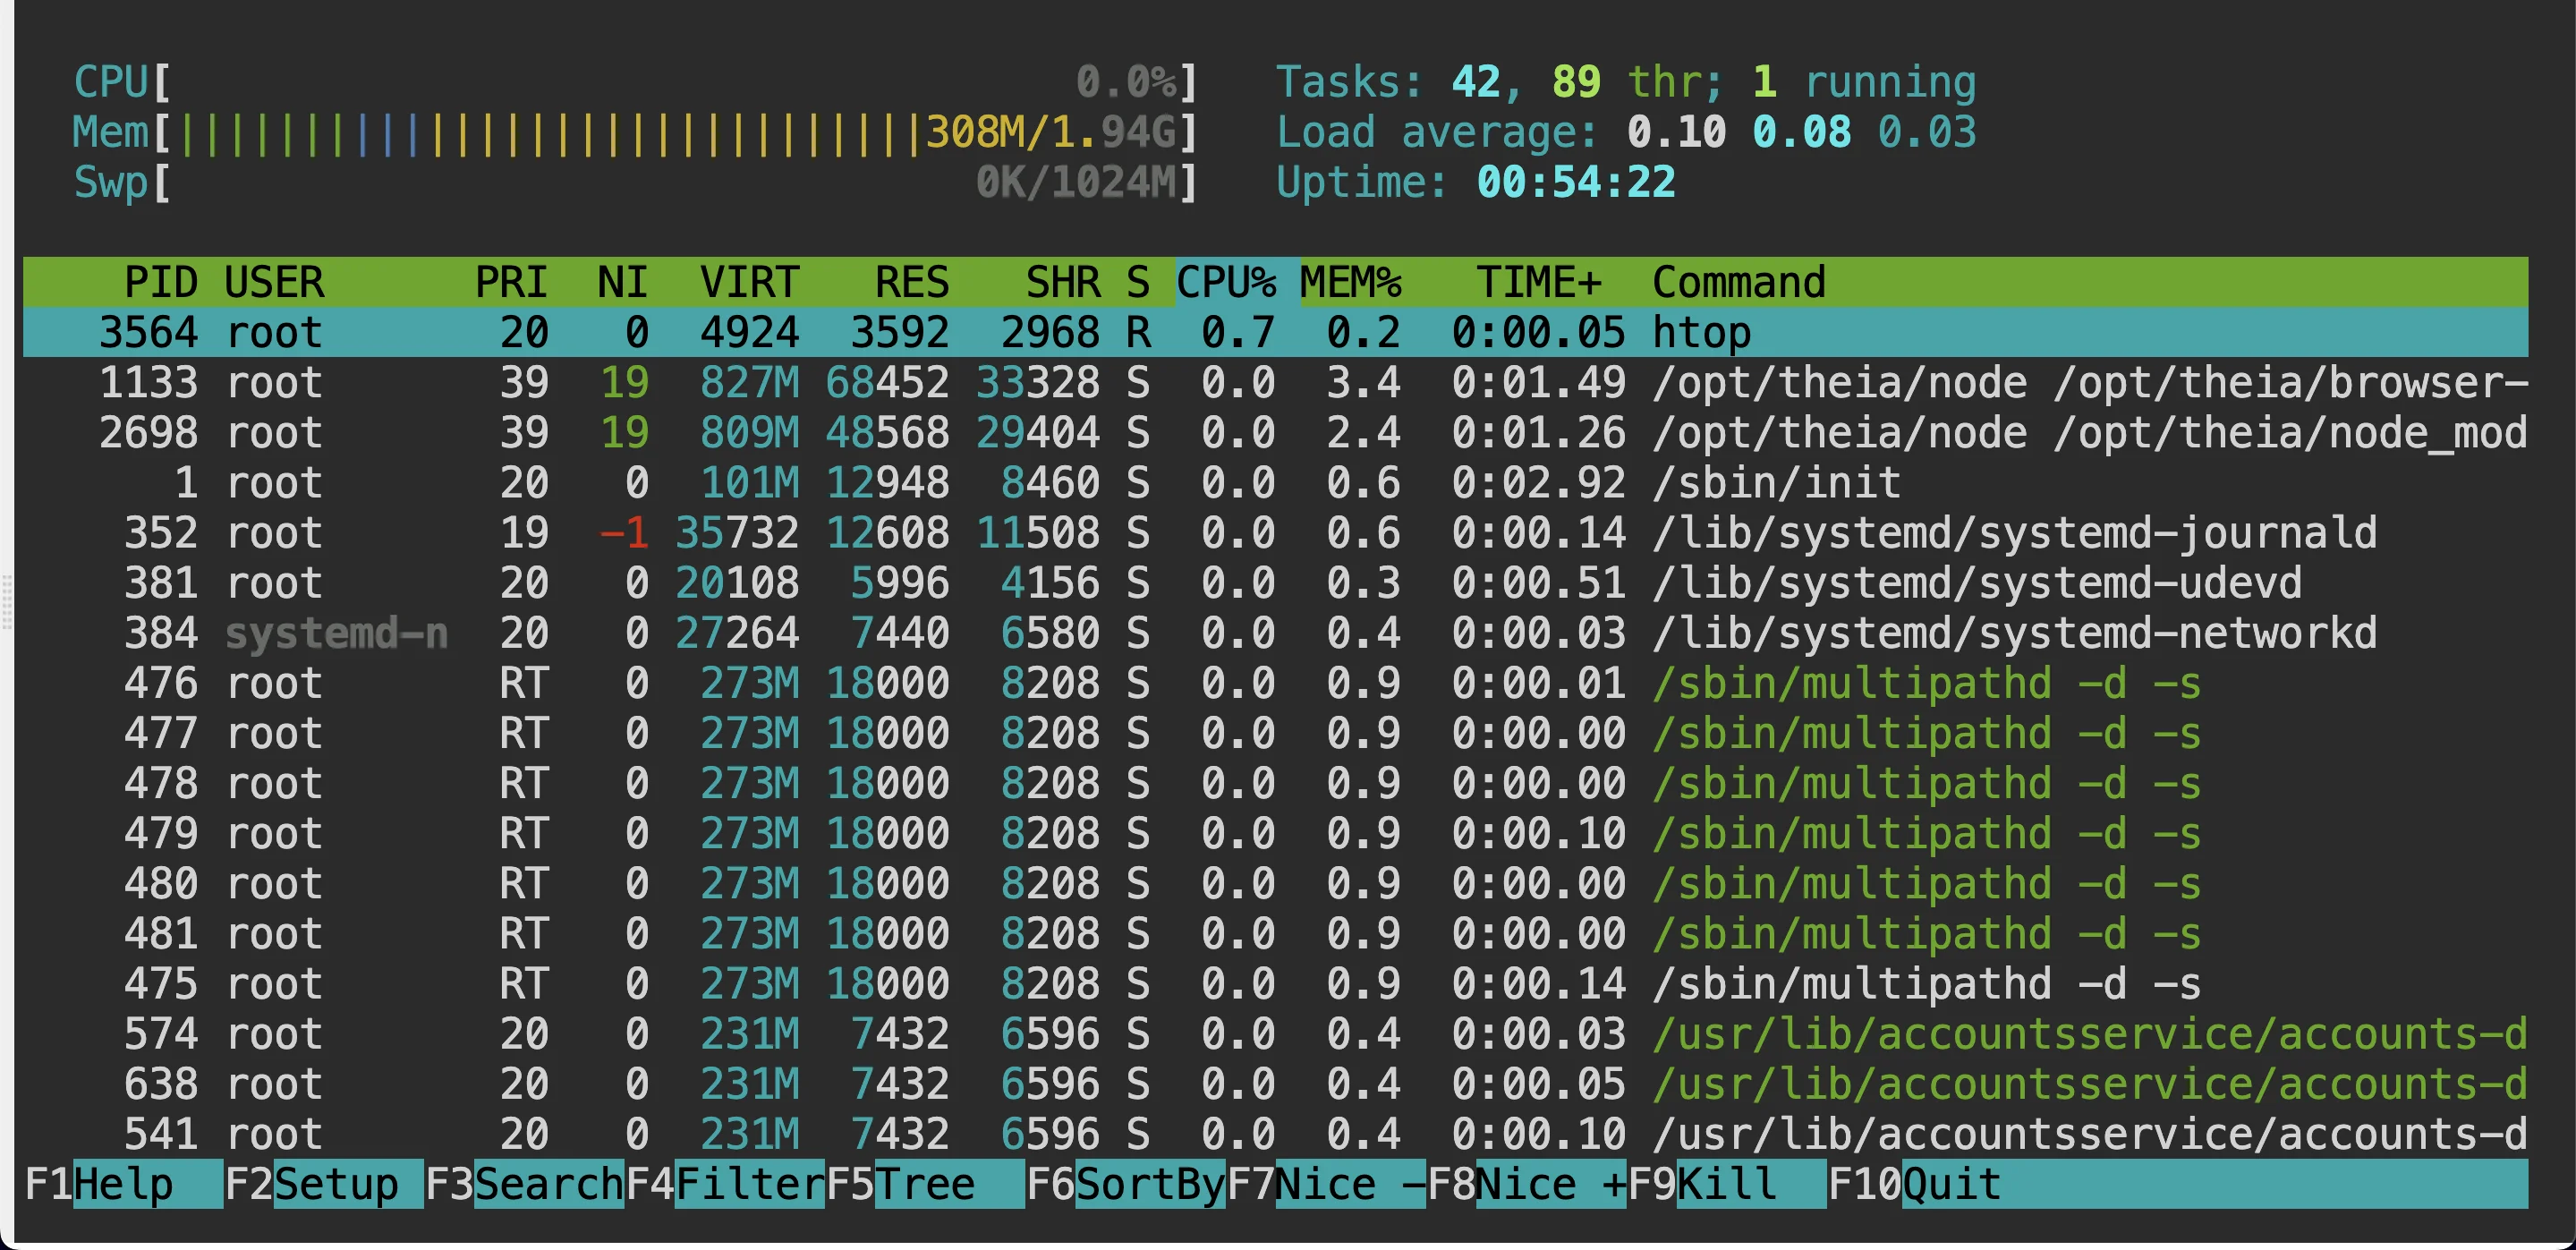
htop command output - Pros: They are built-in to most Linux distributions and are straightforward to use, making them accessible even for those new to Linux. The visual interface of
ps command with custom scripts: The
pscommand is a versatile tool that lists running processes along with their memory usage. By combiningpswith custom scripts, you can automate the collection of memory data and even generate graphs using other tools.- Pros: This method offers significant flexibility, allowing you to tailor the data collection process to meet specific requirements. You can create detailed and customized reports on memory usage.
- Cons: This approach requires some knowledge of scripting, which might be challenging for beginners. It involves writing and maintaining scripts, which can be a hurdle if you're not familiar with the command line or programming.
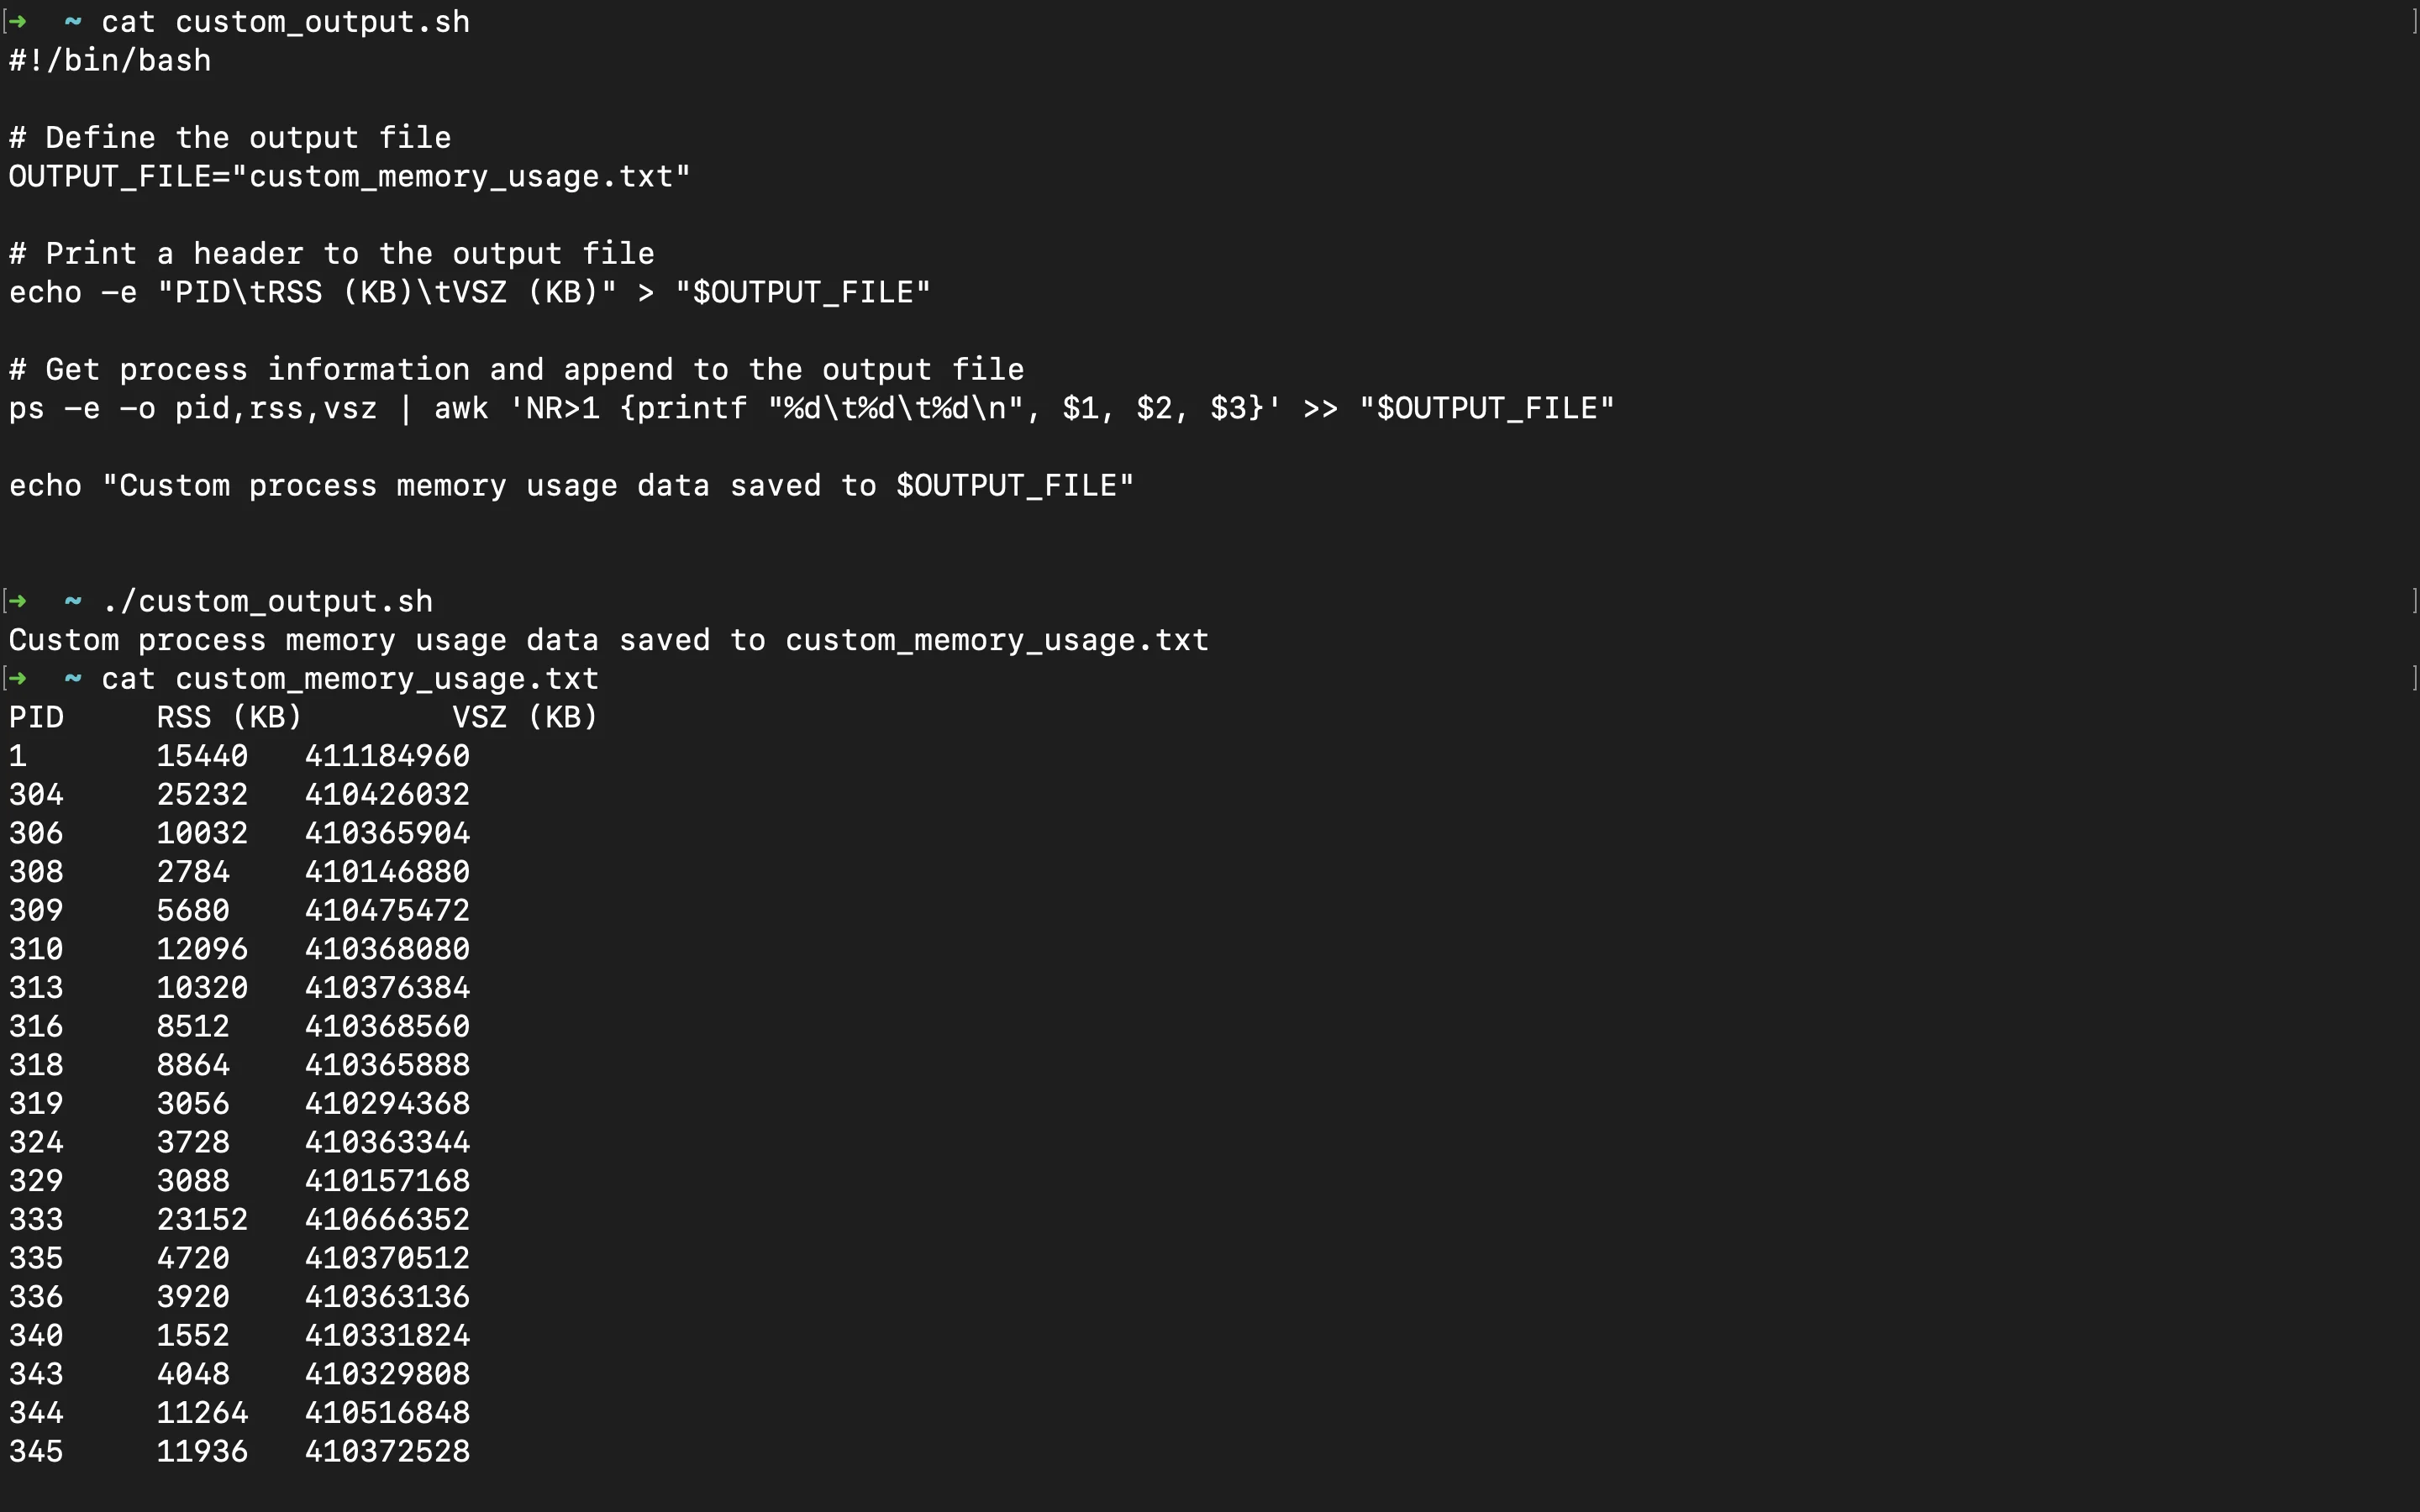
ps command custom script output sar (System Activity Reporter):
saris a powerful tool used to collect and report on various system activities, including memory usage over time. It allows you to gather historical data, making it easier to track trends and diagnose issues.- Pros:
saris excellent for historical data collection and is included in many Linux distributions. It provides detailed reports that are invaluable for long-term system monitoring and analysis. - Cons: The tool comes with a learning curve, especially if you're not familiar with command-line tools. Understanding and interpreting the output can be challenging for beginners.

sar output - Pros:
gnuplot:
gnuplotis a specialized graphing tool that can create detailed and customized memory usage graphs from the data you collect using other tools likepsorsar.- Pros: It offers extensive customization options, supporting various types of graphs, making it suitable for both simple and complex visualizations.
gnuplotis highly flexible and can be used to generate professional-grade charts. - Cons: To use
gnuploteffectively, you need command-line expertise and some programming knowledge. Setting up and generating graphs requires a good understanding of both the tool and the data you want to visualize.
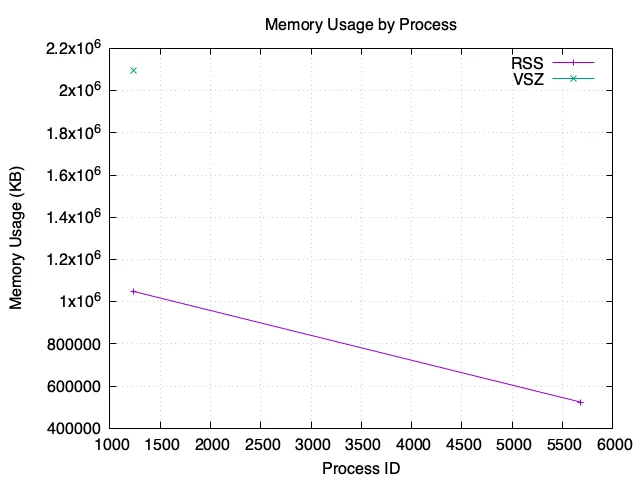
gnuplot graph - Pros: It offers extensive customization options, supporting various types of graphs, making it suitable for both simple and complex visualizations.
Windows-Specific Tools
Windows Performance Monitor: Windows Performance Monitor is a built-in program that tracks and displays a variety of performance data, including memory utilization. It offers real-time monitoring, which is important for identifying urgent faults or patterns in system resource utilization.
- Pros: Since it is included with Windows, no additional installation is required. The tool provides real-time data, which is helpful for diagnosing problems as they happen. It also offers the ability to log data over time, enabling you to create historical records of memory usage.
- Cons: The main limitation is its customization options. While you can track and log a variety of metrics, the interface for creating and viewing graphs is not as flexible as some third-party tools. Advanced users may find the graphing features limited in scope.
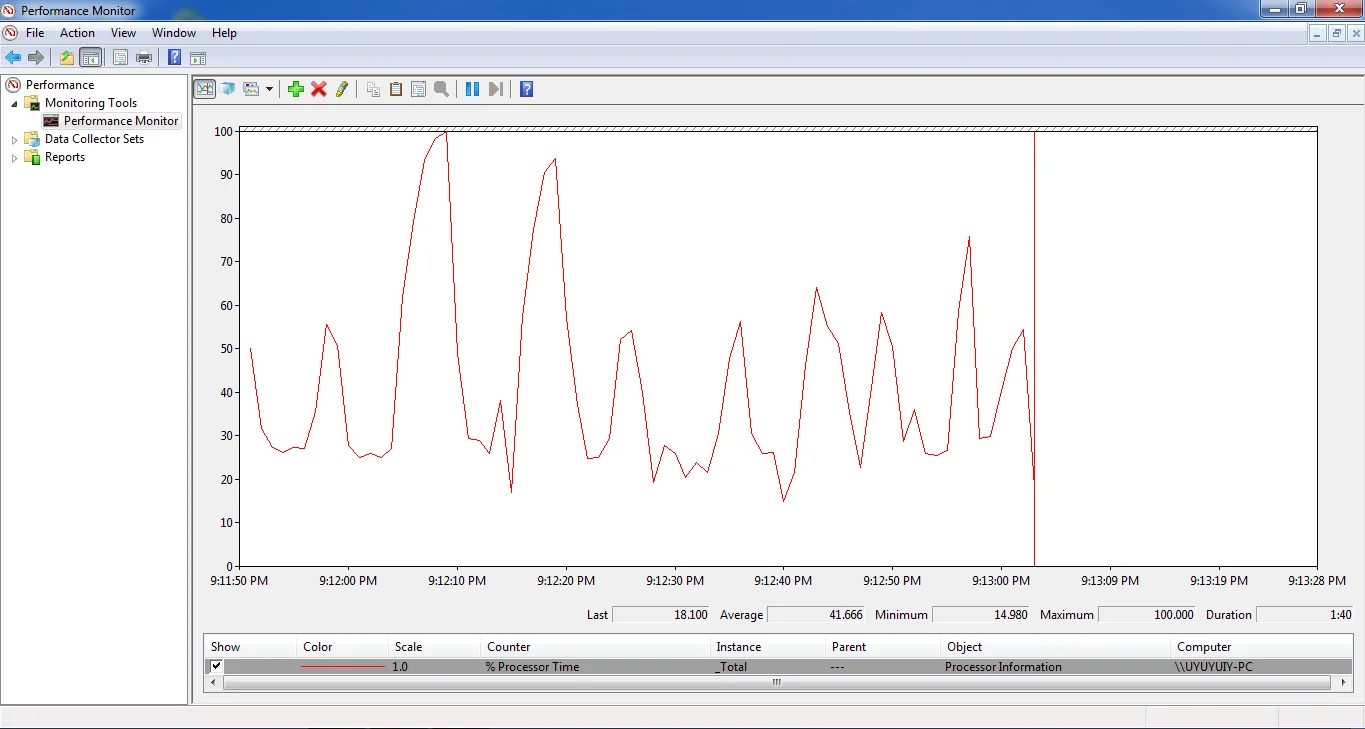
Windows Performance Monitor Process Explorer: Process Explorer is a powerful task manager replacement developed by Microsoft. It provides detailed insights into processes running on your system, including in-depth memory usage analysis. You can see which processes are using the most memory and get detailed breakdowns of each process's memory consumption.
- Pros: The interface is user-friendly, making it accessible even to those new to memory management. It provides far more detailed information than the standard Task Manager, including the ability to see handles, DLLs, and memory mappings. This makes it an excellent tool for diagnosing memory issues.
- Cons: While Process Explorer excels at providing detailed information, it does not offer advanced graphing capabilities. If you need to create detailed visual representations of memory usage over time, you may need to export the data and use another tool for graphing.
](Article%20Content%2053492cfedb8847f39457f180ab830dc4/9554c358-df71-4ebb-86d9-63246a43885b.webp)Windows Process Explorer[Windows Process Explorer PowerShell: PowerShell is a powerful scripting language built into Windows, allowing you to automate tasks and create custom solutions for monitoring memory usage. With PowerShell, you can write scripts that collect memory data at specified intervals and even generate basic graphs or export data for use in more advanced graphing tools.
- Pros: The flexibility of PowerShell is its greatest strength. You can tailor scripts to collect exactly the data you need and integrate it with other Windows tools. It’s a great option if you have specific requirements that off-the-shelf tools can’t meet.
- Cons: PowerShell requires a learning curve, especially if you are new to scripting. Writing and maintaining scripts can be challenging, particularly for beginners. However, once mastered, it provides a level of control that is unmatched by more user-friendly tools.
Windows Admin Center: Windows Admin Center is a web-based tool designed for managing Windows servers and PCs. It includes features for monitoring memory usage, making it particularly useful for IT professionals managing multiple machines or servers in a network.
- Pros: It offers a modern, centralized interface that simplifies the management of multiple systems. You can monitor memory usage across all your servers or PCs from a single dashboard, making it ideal for enterprise environments.
- Cons: The tool is primarily designed for server environments, so it may be overkill if you’re only monitoring a single PC or a small network. Additionally, it requires setup and configuration, which might be more complex than necessary for basic monitoring tasks.
](Article%20Content%2053492cfedb8847f39457f180ab830dc4/image.webp)Managing Windows Server using [Windows Admin Center Managing Windows Server using Windows Admin Center
Selecting a Tool for Graphing Process Memory Usage
When selecting a tool for graphing process memory usage on Windows, consider the following factors:
- Ease of use: If you’re new to monitoring and graphing memory usage, starting with built-in tools like Windows Performance Monitor may be more straightforward.
- Graphing capabilities: If visualizing data is a priority, you may need to combine tools or use PowerShell scripts to generate the detailed graphs you need.
- Data collection frequency: Some tools are better suited for real-time monitoring, while others excel at collecting and storing data over longer periods. Choose based on whether you need immediate insights or long-term trends.
- Historical data retention: If tracking memory usage over time is important, make sure the tool you choose supports logging and data retention.
- Cross-platform compatibility: If you are managing a mixed environment with both Windows and Linux systems, consider how well your chosen tools will integrate across different platforms.
Step-by-Step Guide to Graph Process Memory Usage
Before you can collect memory usage data, it's essential to identify the Process ID (PID) of the specific process you want to monitor. The PID is a unique identifier that the operating system assigns to each running process, and you'll need this number to track the memory usage accurately. The steps to identify the PID vary slightly depending on whether you're using a Linux or Windows system.
Identify the target process:
On Linux: Start by launching your terminal application. To find the PID of the process, use the
pscommand combined withgrepto search for the specific process name.ps aux | grep process_nameps aux: This command lists all running processes along with their details, such as the user running the process, the PID, memory usage, CPU usage, etc.grep process_name: This part filters the output ofps auxto display only the lines that contain the specified process name.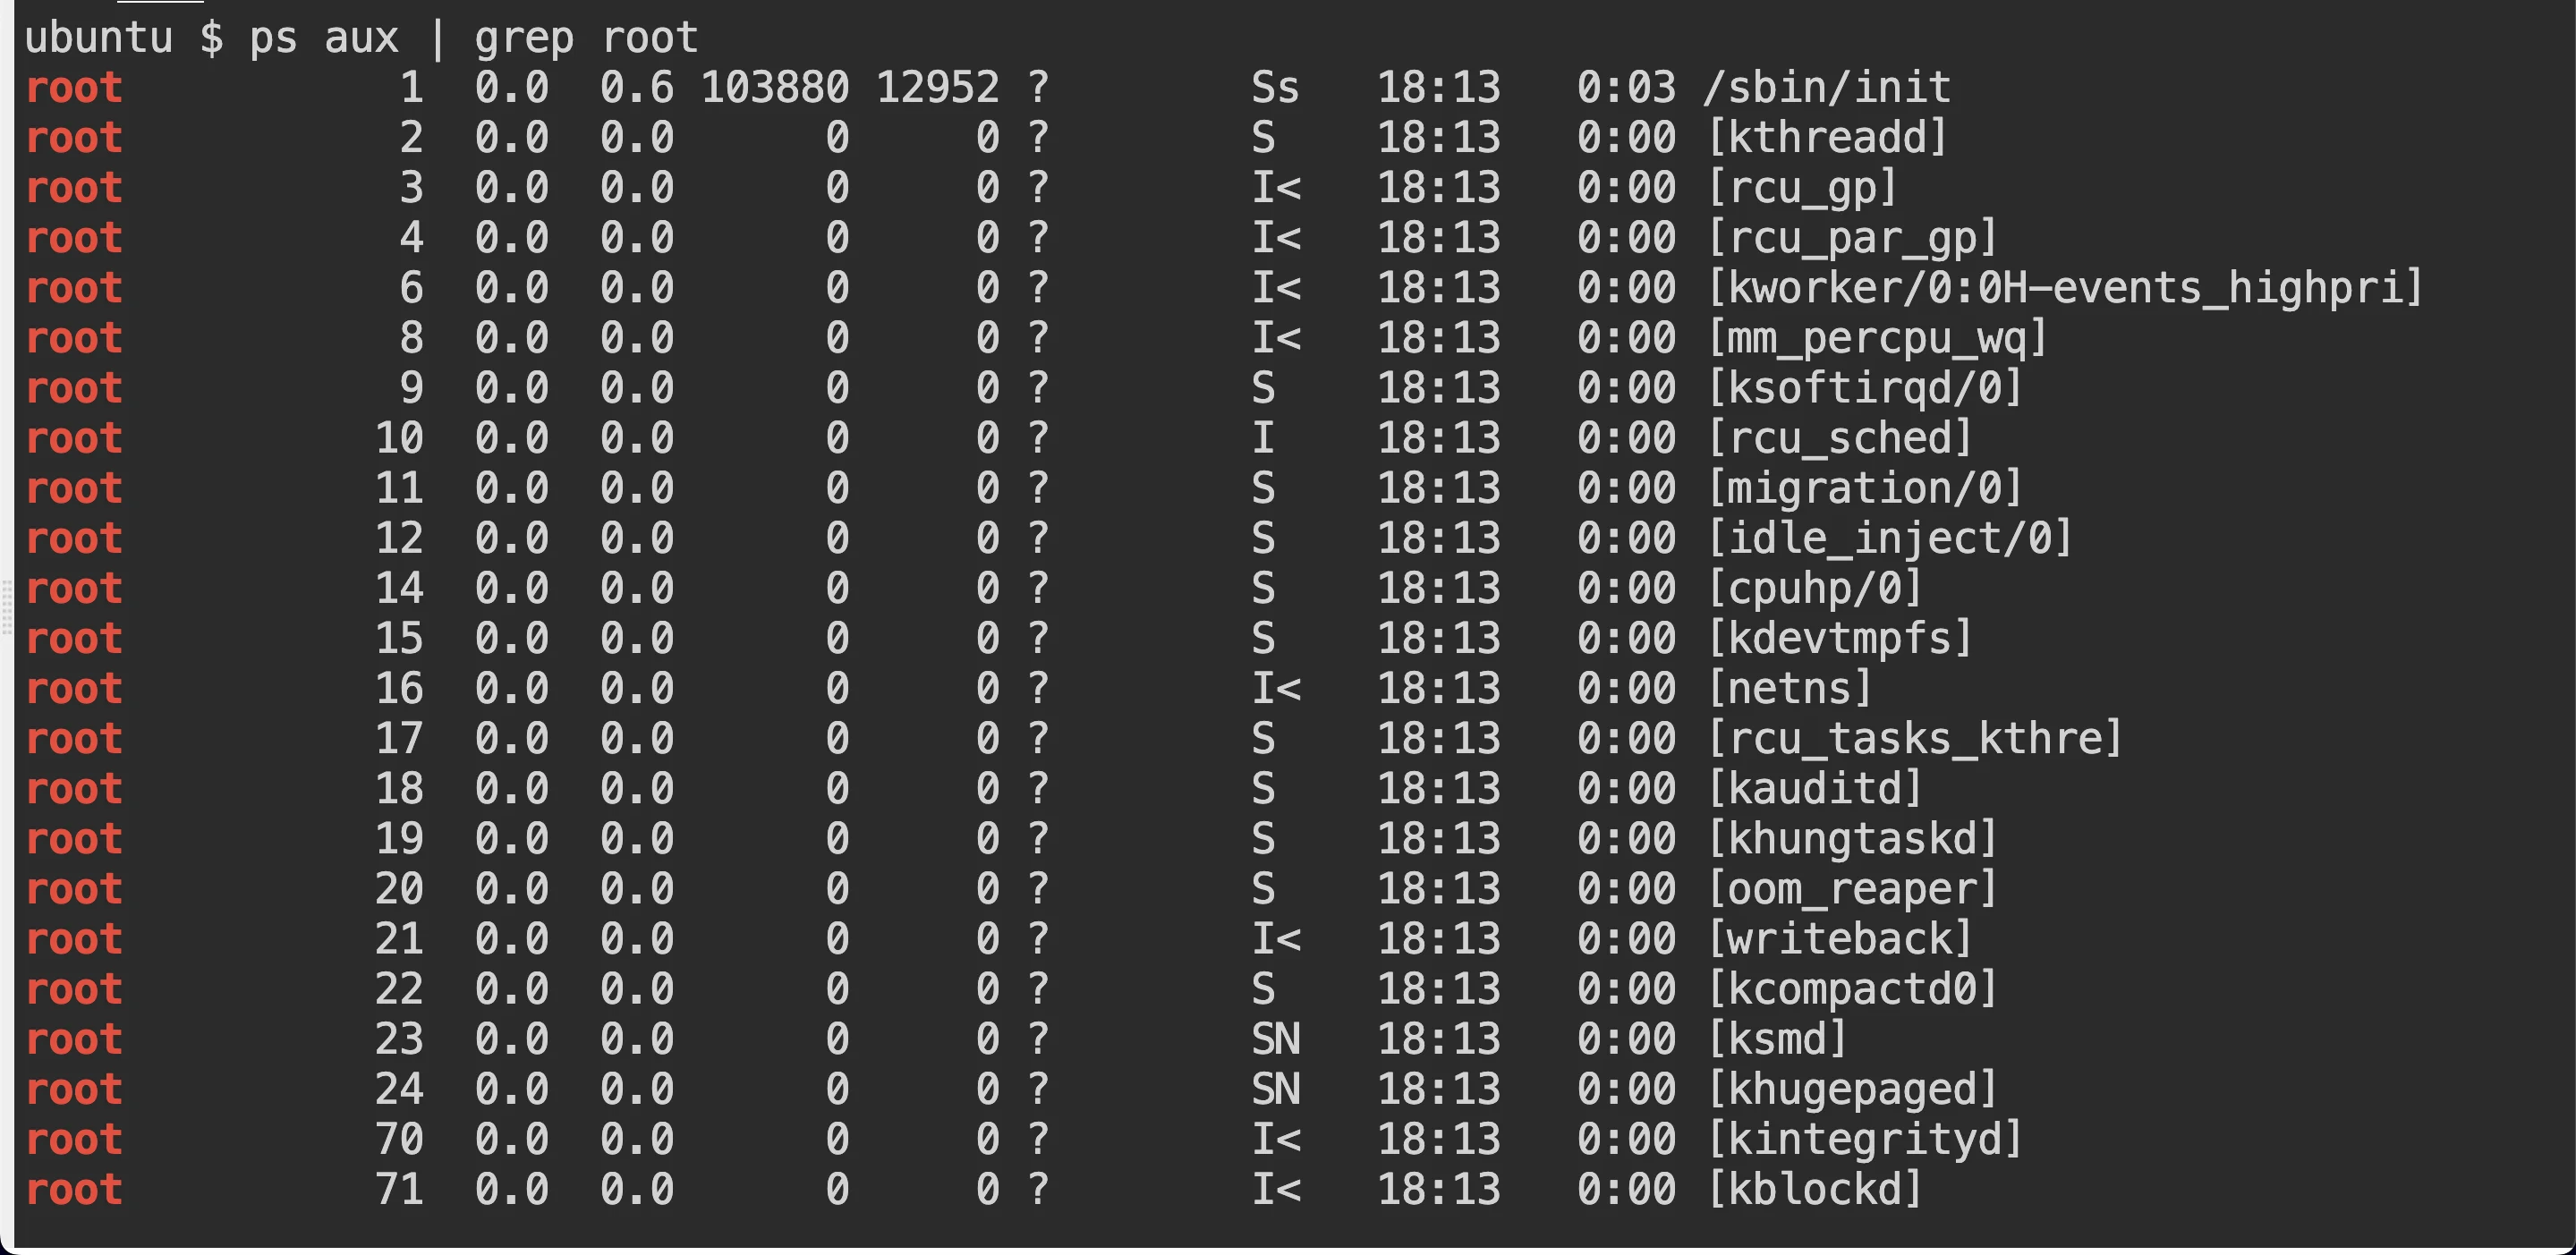
Search for Process ID On Windows: Press
Win + R, typecmd, and hit Enter to open the Command Prompt. To find the PID, use thetasklistcommand combined withfindstrto filter by the process name.tasklist | findstr process_nametasklist: This command displays a list of all running processes on the system along with their PIDs, memory usage, and other details.findstr process_name: This filters the list to show only the lines containing the specified process name.
Collect memory usage data: Once you have the PID, you can start collecting memory usage data. This data will be used later to create the graph.
On Linux: In the terminal, run the following command:
ps -p <PID> -o pid,rss,vsz >> memory_data.txtReplace
PIDwith the actual Process ID. This command appends the memory data (RSS and VSZ) to a file namedmemory_data.txt. Run this command at regular intervals to collect data over time (using a loop or cron job).On Windows: In a PowerShell window, use the following command:
Get-Process -Id PID | Select-Object Id, WorkingSet, VirtualMemorySize | Out-File memory_data.txt -AppendReplace
PIDwith the actual Process ID. This command appends the memory data (Working Set and Virtual Memory Size) tomemory_data.txt. Run this command at regular intervals to collect data over time (using a loop or Task Scheduler).
Choose graphing software: For this example, we'll use Python's
matplotliblibrary to create the graph. Ensure you have Python installed on your system, along with the necessary libraries.Install Python: Download from python.org.
Install the required libraries by running:
pip install matplotlib pandas
Create the graph: Once you have collected enough data, you can create a graph to visualize the memory usage over time.
- Prepare Your Data Ensure your
memory_data.txtfile is formatted correctly with columns forPID,RSS, andVSZ(orWorkingSetandVirtualMemorySizeon Windows). - Write the Python Script: Create a new Python script and include the following code:
import matplotlib.pyplot as plt
import pandas as pd

# Load the data with the correct separator
data = pd.read_csv('memory_data.txt', sep='\s+', header=0)

# Print the first few rows and column names to understand the structure
print("Columns:", data.columns)
print("First few rows of data:\n", data.head())

# Rename columns based on the actual structure
data.columns = ['PID', 'RSS (KB)', 'VSZ (KB)', 'Extra1', 'Extra2']

# Drop extra columns that are not needed
data = data[['PID', 'RSS (KB)', 'VSZ (KB)']]

# Convert RSS and VSZ from KB to MB
data['RSS (KB)'] = pd.to_numeric(data['RSS (KB)'], errors='coerce') / 1024
data['VSZ (KB)'] = pd.to_numeric(data['VSZ (KB)'], errors='coerce') / 1024

# Drop rows with NaN values in RSS or VSZ columns
data.dropna(subset=['RSS (KB)', 'VSZ (KB)'], inplace=True)

# Create the graph
plt.figure(figsize=(12, 8))
plt.plot(data.index, data['RSS (KB)'], label='RSS (MB)', color='blue', marker='o')
plt.plot(data.index, data['VSZ (KB)'], label='VSZ (MB)', color='orange', marker='x')
plt.xlabel('Time (samples)')
plt.ylabel('Memory Usage (MB)')
plt.title('Process Memory Usage Over Time')
plt.legend()
plt.grid(True)
plt.tight_layout()  # Adjust layout to prevent clipping
plt.savefig('memory_usage_graph.webp')
plt.show()
This script reads the memory data, processes it, and generates a graph showing RSS and VSZ (or WorkingSet and VirtualMemorySize) memory usage over time.
- Prepare Your Data Ensure your
Run the Script: Save the script as
memory_usage_graph.pyand run it in your terminal or command prompt:python memory_usage_graph.pyThe script will generate a graph (
memory_usage_graph.webp) and display it, showing how memory usage has changed over time.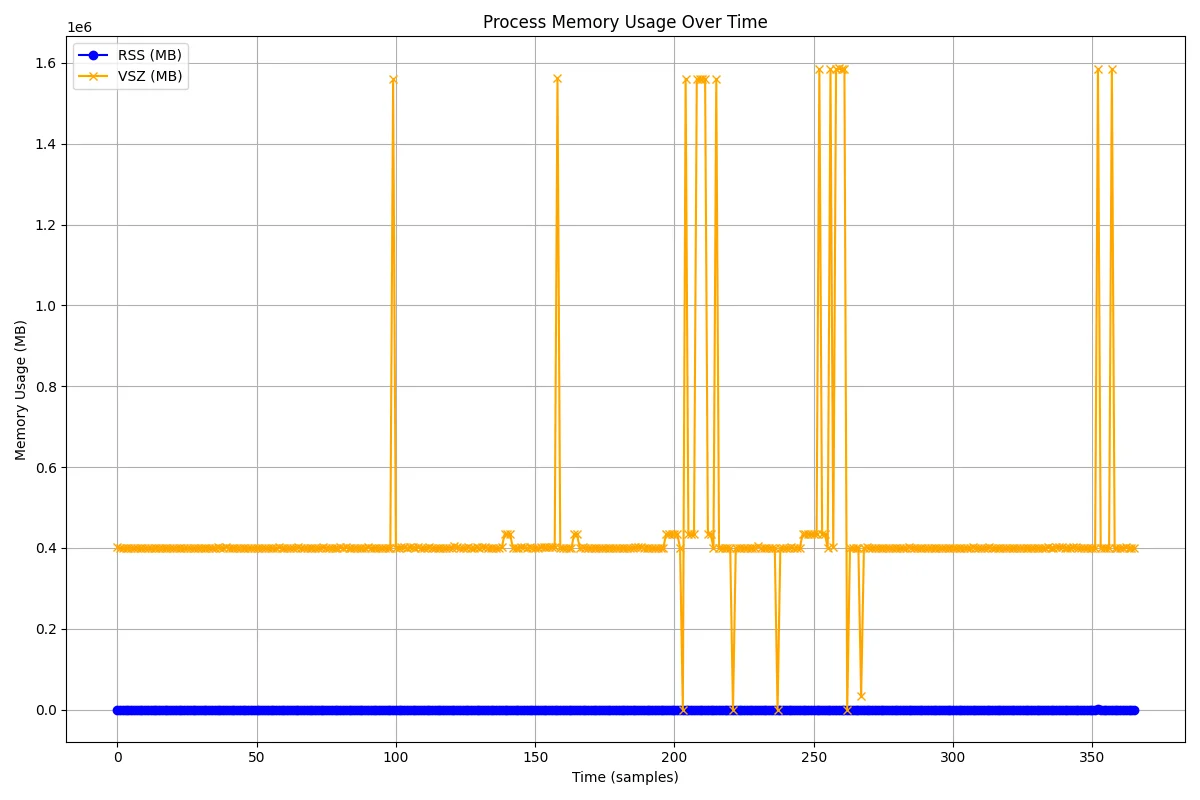
memory graph using matplotlib and panda
Data Collection Techniques
Collecting memory usage data effectively is essential for accurate monitoring and analysis. Here are some detailed techniques to help you streamline the process:
Automate data gathering: Automating the collection of memory usage data ensures that you consistently capture information without manual intervention.
For Linux: You can write a shell script that runs commands to get information from memory. For instance, a script may track memory usage and send the output to a file by using the
pscommand:#!/bin/bash while true do ps aux --sort=-%mem | head -n 10 >> /path/to/memory_data.txt sleep 300 # Wait for 5 minutes before collecting data again doneFor Windows: Use a batch file or PowerShell script to collect data. A PowerShell script could look like this:
while ($true) {
    Get-Process | Sort-Object -Property WorkingSet -Descending | Select-Object -First 10 | Out-File -Append -FilePath C:\path\to\memory_data.txt
    Start-Sleep -Seconds 300  # Wait for 5 minutes before collecting data again
}
Implement scheduled tasks: To ensure data collection happens regularly without manual effort, you can set up scheduled tasks:
On Linux: Use
cron, a time-based job scheduler. You can edit your crontab file (crontab -e) to add a job that runs your data collection script at specified intervals. For example, to run a script every 5 minutes:*/5 * * * * /path/to/your_script.shOn Windows: Use Task Scheduler to create a task that runs your data collection script at regular intervals. You can configure triggers and actions to specify how often and when your script should execute.
Leverage system APIs: For more advanced data collection, you can use system-specific APIs to programmatically retrieve memory data.
- Linux: Tools like
libprocpsprovide APIs to interact with system processes and retrieve memory usage information programmatically. - Windows: Use Windows Management Instrumentation (WMI) to gather memory data through scripts or applications. PowerShell provides cmdlets like
Get-WmiObjectto query system performance metrics:
Get-WmiObject -Class Win32_Process | Select-Object Name, WorkingSetSize, VirtualSize- Linux: Tools like
Store data efficiently: For large-scale or long-term data storage, consider using specialized databases designed for time-series data:
- Time-Series Databases: Tools like InfluxDB or Prometheus are optimized for storing and querying time-series data. They can handle high volumes of data efficiently and provide powerful querying capabilities for historical data analysis.
- Database Management: Ensure your data storage solution is well-organized, with appropriate indexing and retention policies to manage storage space and maintain performance.
Graphing Techniques and Best Practices
Creating effective graphs to visualize memory usage is crucial for clear analysis and communication. Here are some key techniques and best practices to ensure your graphs are both informative and easy to understand:
Choose the right graph type: Selecting the appropriate type of graph is essential for effectively conveying your data:
- Line Graphs: Ideal for displaying changes over time, such as how memory usage evolves. They show trends and patterns clearly, making them suitable for time-series data.
- Bar Charts: Useful for comparing memory usage across different processes or applications at a specific point in time. They provide a clear comparison between categories.
Add context with annotations: Annotations help provide additional context and highlight significant events or thresholds on your graph:
- Important Events: Mark events such as application restarts, updates, or known performance issues directly on the graph.
- Thresholds: Draw lines or markers to indicate critical memory usage thresholds. This helps to quickly identify when memory usage exceeds normal limits.
Example: If your memory usage exceeds a certain threshold, annotating this on the graph helps in identifying potential performance issues.
Use color effectively: Colors can help differentiate between different data series or metrics:
- Contrast: Use contrasting colors to distinguish between various metrics (e.g., RSS vs. VSZ). This makes it easier to differentiate data at a glance.
- Consistency: Maintain consistent color schemes across multiple graphs or reports to avoid confusion.
Example: Use blue for RSS (Resident Set Size) and green for VSZ (Virtual Set Size) across all your graphs to ensure clarity and consistency.
Include a legend: A legend is crucial for explaining what each visual element on your graph represents:
- Labeling: Clearly label each line, bar, or section of the graph with its corresponding metric or category.
- Placement: Position the legend in a clear area of the graph where it does not obstruct the data.
Example: If your graph includes multiple lines for different metrics, include a legend that specifies what each line represents.
Scale appropriately: Proper scaling ensures that your graph is accurate and easy to interpret:
- Consistent Units: Use consistent units for measurements (e.g., MB or GB) throughout your graph to avoid confusion.
- Log Scales: For data with large ranges, consider using logarithmic scales to make trends more visible and manageable.
Example: If memory usage spans from a few megabytes to several gigabytes, using a logarithmic scale might make the graph more readable.
By following these techniques and best practices, you can create graphs that not only represent memory usage data effectively but also provide valuable insights and facilitate better decision-making. Clear and well-designed graphs are essential for monitoring system performance, identifying issues, and communicating findings to stakeholders.
Interpreting Memory Usage Graphs
Interpreting memory usage graphs effectively allows you to diagnose issues and optimize system performance. Here’s how to approach the analysis:
- Understand the metrics:
- RSS (Resident Set Size): Represents the actual physical memory that a process is using. This is crucial for understanding how much of your system’s RAM is being consumed by a specific process.
- VSZ (Virtual Set Size): Reflects the total amount of virtual memory allocated for a process, including memory that is not currently in use (e.g., memory that has been swapped out or reserved but not yet accessed). This helps gauge the total memory footprint of a process.
- PSS (Proportional Set Size): Provides a more accurate measure of memory usage in environments where memory is shared between processes. PSS accounts for shared memory by dividing it proportionally among the processes using it.
- Identify patterns:
- Gradual Increases: If you observe a steady, continuous increase in memory usage, this could be indicative of a memory leak, where memory is not being released back to the system after use.
- Sudden Spikes: Large, abrupt increases in memory usage often correspond to resource-intensive operations, such as loading large datasets or running complex algorithms. These spikes should be monitored to ensure they don’t cause system instability.
- Cyclical Patterns: Repetitive or cyclical patterns in memory usage might reflect normal application behavior, such as scheduled tasks, periodic data processing, or regular garbage collection cycles.
- Correlate with other metrics: Memory utilization is not a stand-alone statistic. Correlate memory use with other important variables to obtain a more thorough knowledge of system performance:
- CPU Utilization: If your program is executing intense computations, it may be the case that both high memory utilization and high CPU usage are present.
- Disk I/O: If there is a rise in memory consumption together with a high disc I/O, this may indicate that data is being purged or swapped between RAM and the disc.
- Network Activity: In programs that use a lot of networks, spikes in memory utilization may correspond with periods of high network traffic, which might be an indication of data caching or buffer usage.
- Set baselines: Establishing baseline memory usage patterns is essential for effective monitoring. By understanding what normal memory usage looks like for your application:
- Quick Spot Deviations: Any significant deviation from the established baseline can be an early warning sign of potential issues, such as a memory leak or a misconfiguration.
- Performance Optimization: Baselines help in identifying areas where memory usage can be optimized, ensuring that resources are being utilized efficiently.
Advanced Memory Profiling with SigNoz
To effectively monitor the memory usage of your applications, using an advanced observability platform like SigNoz can be highly beneficial. SigNoz is an open-source observability tool that provides end-to-end monitoring, troubleshooting, and alerting capabilities for your applications and infrastructure.
Here's how you can leverage SigNoz for Advanced Memory Profiling:
- Create a SigNoz cloud account
SigNoz Cloud provides a 30-day free trial period. This demo uses SigNoz Cloud, but you can use the open-source version.
- Clone the provided sample SpringBoot repository
Open a terminal window and run the following command to clone the SigNoz Spring Pet Clinic repository:
git clone https://github.com/SigNoz/spring-petclinic.git
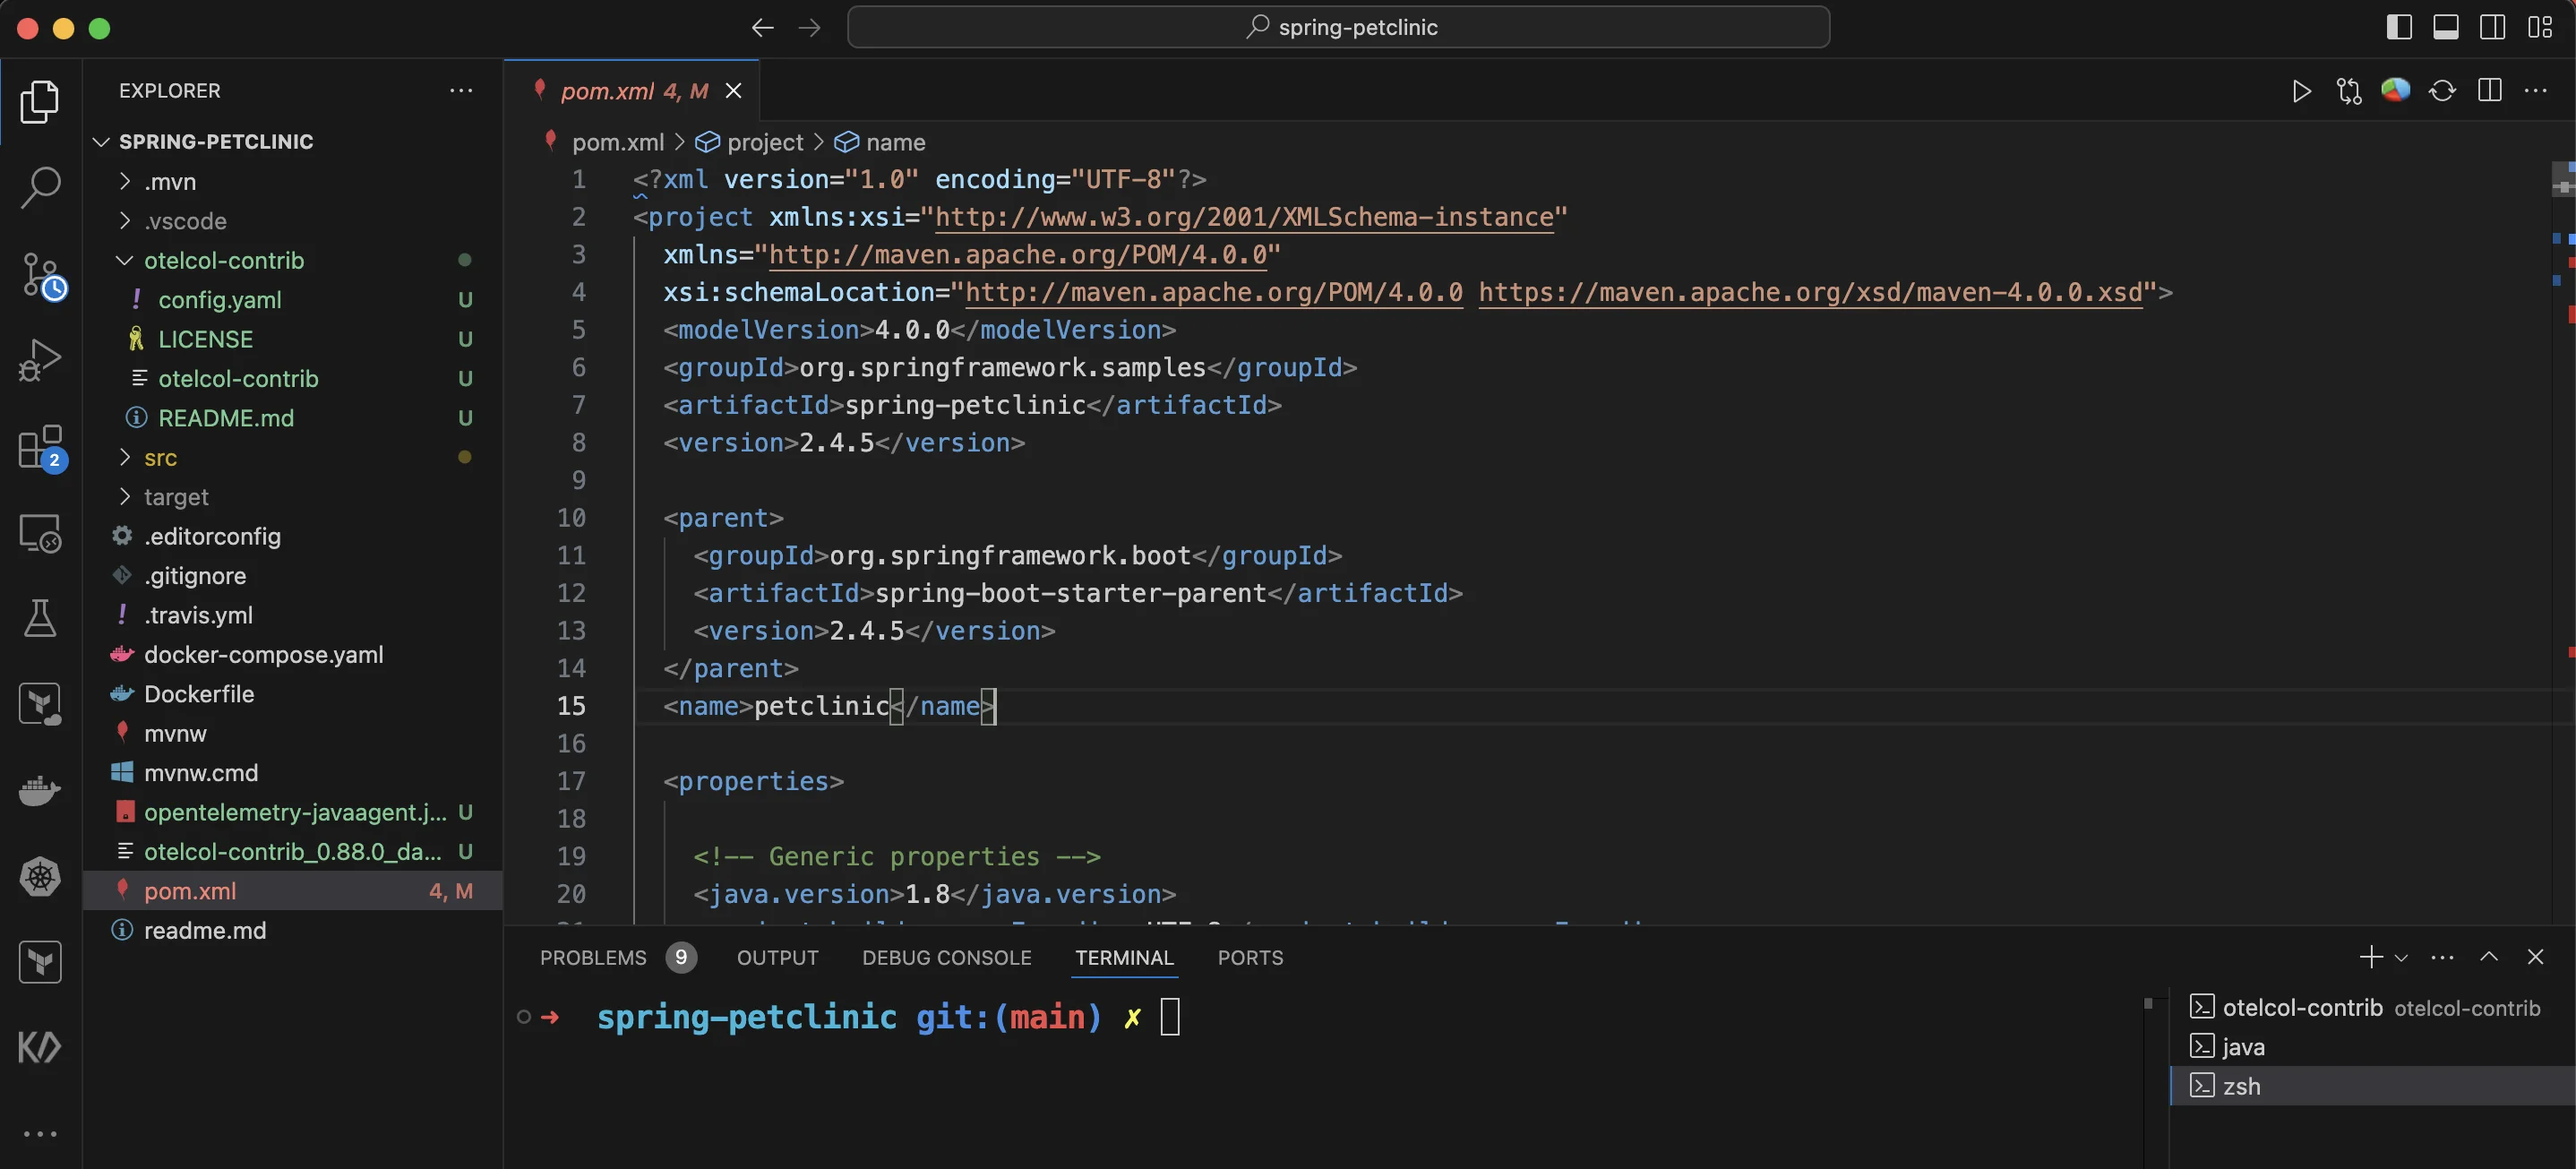
- Open the Project in your IDE: Open the cloned
spring-petclinicdirectory in your preferred code editor.
- Add a
.envfile to the root project folder In the root directory of your project folder, create a new file named.envand paste the below details into it:
OTEL_COLLECTOR_ENDPOINT=ingest.{region}.signoz.cloud:443
SIGNOZ_INGESTION_KEY=***
OTEL_COLLECTOR_ENDPOINT: Specifies the address of the SigNoz collector where your application will send its telemetry data.SIGNOZ_INGESTION_KEY: Authenticates your application with the SigNoz collector.Note: Replace
{region}with your SigNoz region andSIGNOZ_INGESTION_KEYwith your ingestion key.
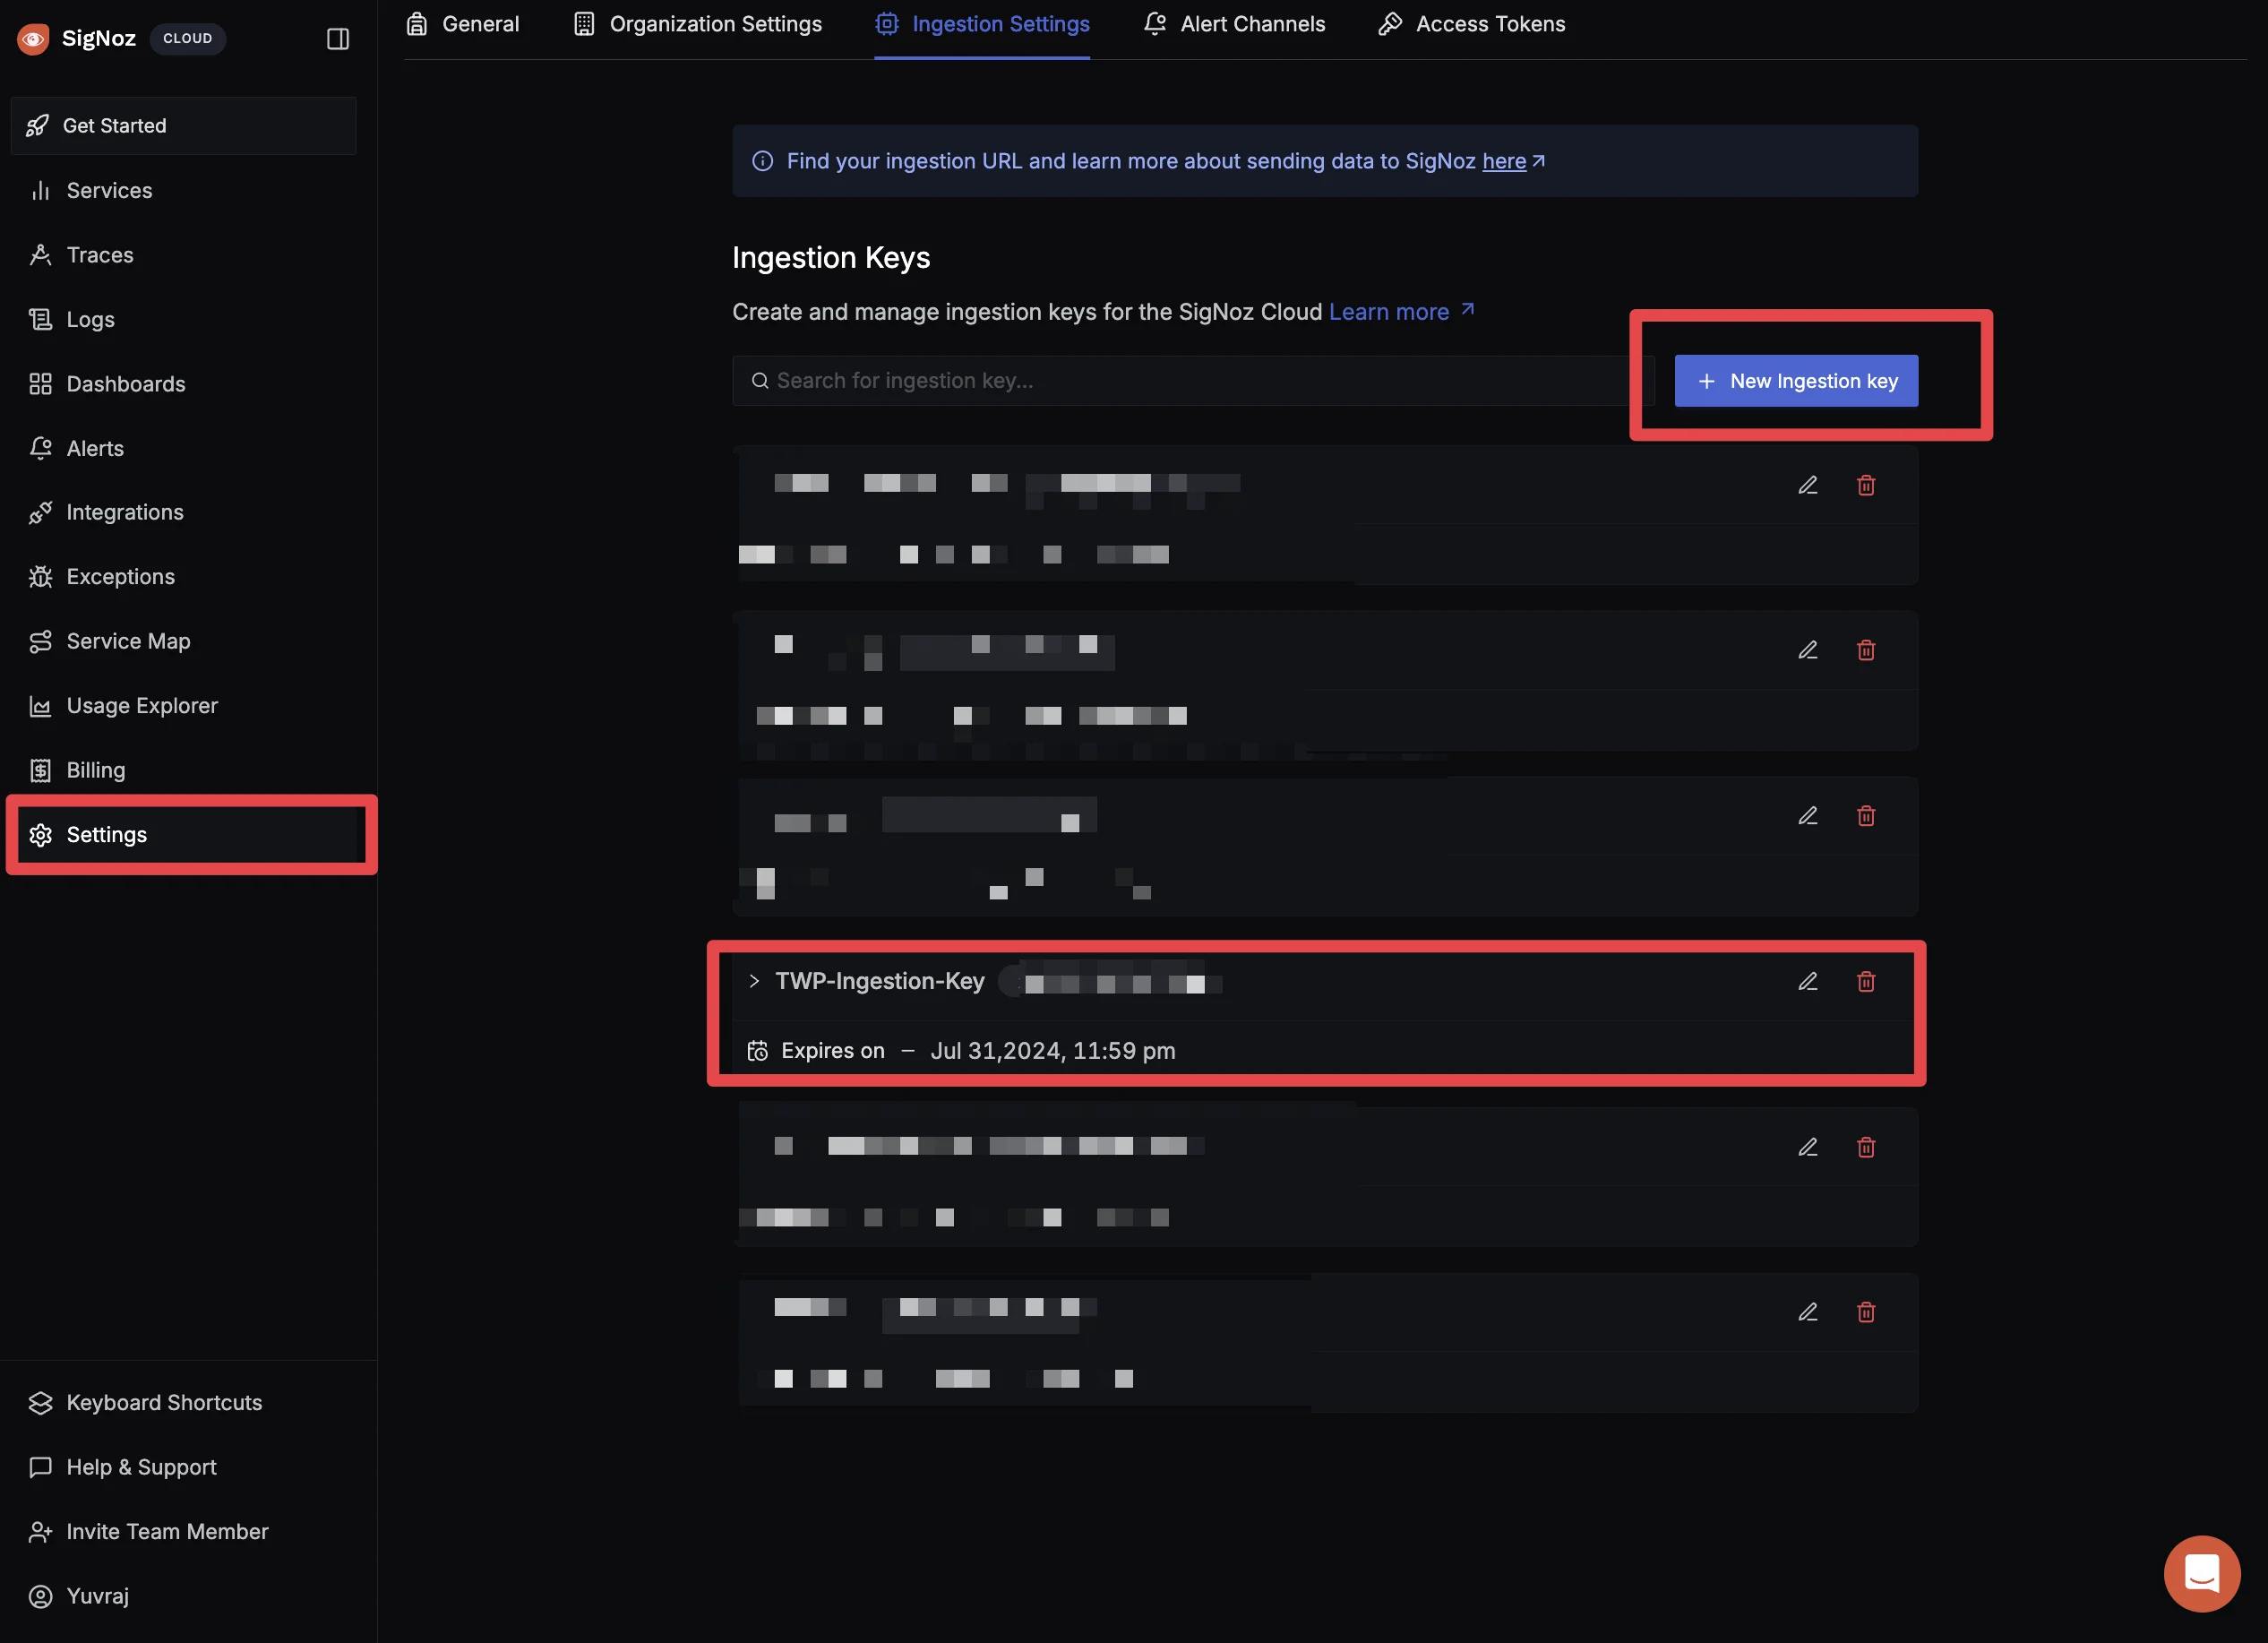
To obtain the SigNoz ingestion key and region, navigate to the “Settings” page in your SigNoz dashboard. You will find the ingestion key and region under the “Ingestion Settings” tab.
- Pre-Configured Changes in the Spring Boot Application:
In the cloned repository, the necessary configurations for Prometheus metrics and Micrometer have already been applied. This includes:
- Dependencies: Micrometer and Prometheus registry dependencies in
pom.xml. - Configurations: Actuator endpoints and metrics exposure in
application.properties.
To learn more about how these changes were made, you can follow the JVM Metrics Setup Guide on the SigNoz documentation.
Run the Spring Boot application: Navigate to the root directory of your Spring Boot project, and use the following Maven command to build the Spring Boot application:
mvn clean installThis command cleans the project's build directory and builds the Spring Boot application.
mvn spring-boot:runThis command runs the Spring Boot application, assuming a clean build is already available.
Configure SigNoz OTel Collector to scrape Prometheus metrics: To configure the OpenTelemetry Collector on your local or virtual machine, follow the steps outlined in the Documentation.
Add this as the updated
config.yamlfile in the otel-contrib folder.receivers: otlp: protocols: grpc: endpoint: 0.0.0.0:4317 http: endpoint: 0.0.0.0:4318 hostmetrics: collection_interval: 60s scrapers: cpu: {} disk: {} load: {} filesystem: {} memory: {} network: {} paging: {} process: mute_process_name_error: true mute_process_exe_error: true mute_process_io_error: true processes: {} prometheus: config: scrape_configs: - job_name: "otel-collector" scrape_interval: 60s static_configs: - targets: ["otel-collector:8889"] - job_name: "jvm-metrics" scrape_interval: 10s metrics_path: "/actuator/prometheus" static_configs: - targets: ["localhost:8090"] processors: batch: send_batch_size: 1000 timeout: 10s # Ref: https://github.com/open-telemetry/opentelemetry-collector-contrib/blob/main/processor/resourcedetectionprocessor/README.md resourcedetection: detectors: [env, system] # Before system detector, include ec2 for AWS, gcp for GCP and azure for Azure. # Using OTEL_RESOURCE_ATTRIBUTES envvar, env detector adds custom labels. timeout: 2s system: hostname_sources: [os] # alternatively, use [dns,os] for setting FQDN as host.name and os as fallback extensions: health_check: {} zpages: {} exporters: otlp: endpoint: "ingest.{region}.signoz.cloud:443" tls: insecure: false headers: "signoz-ingestion-key": "<-signoz-ingestion-key->" logging: verbosity: normal service: telemetry: metrics: address: 0.0.0.0:8888 extensions: [health_check, zpages] pipelines: metrics: receivers: [otlp] processors: [batch] exporters: [otlp] metrics/internal: receivers: [prometheus, hostmetrics] processors: [resourcedetection, batch] exporters: [otlp] traces: receivers: [otlp] processors: [batch] exporters: [otlp] logs: receivers: [otlp] processors: [batch] exporters: [otlp]
Replace {region} with your region and signoz-ingestion-key with your actual token, or if you have set up the .env variables, you can use those.
Download OTel Java binary: After setting up the Otel collector agent, follow the steps below to instrument your Java Application.
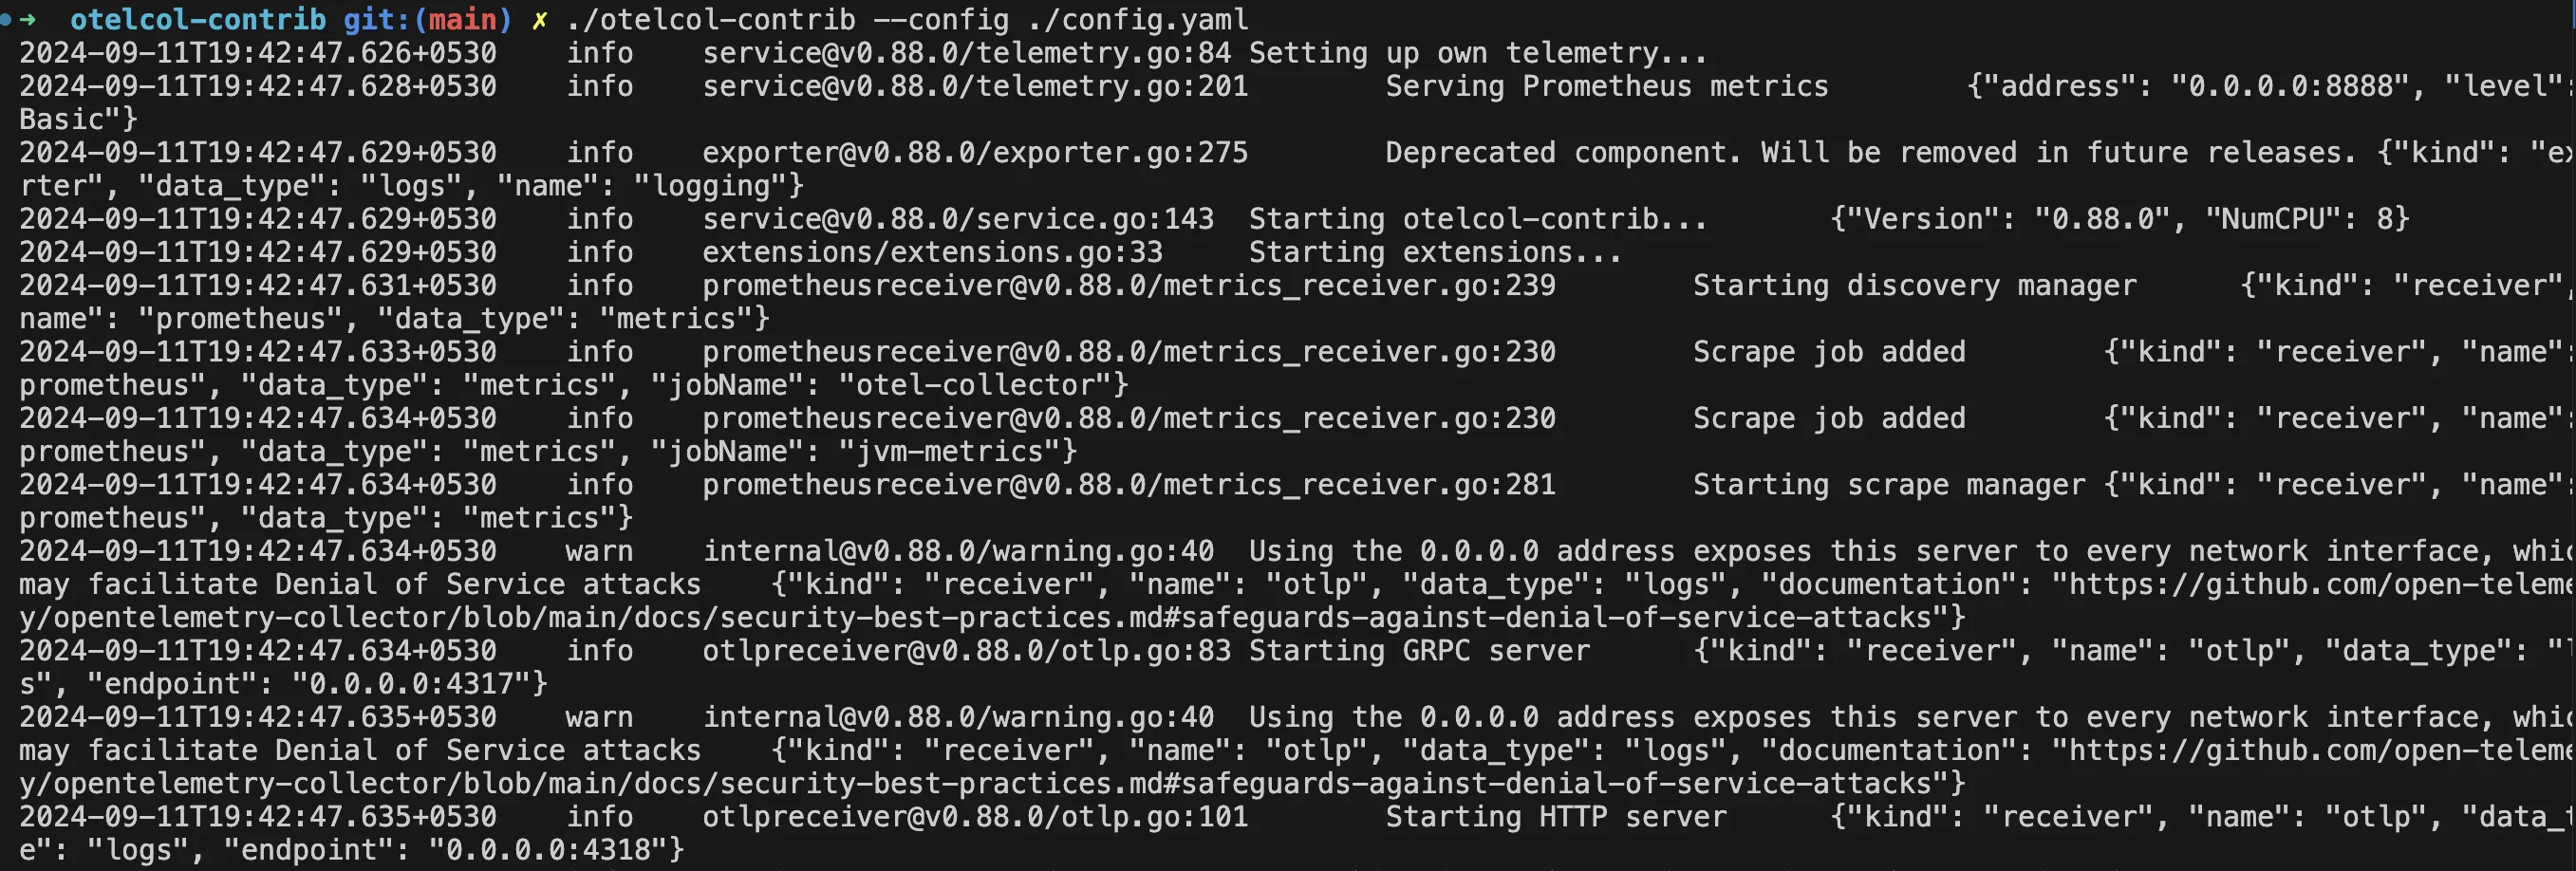
wget https://github.com/open-telemetry/opentelemetry-java-instrumentation/releases/latest/download/opentelemetry-javaagent.jarRun OTel Collector: Once you are done instrumenting your Java application, Run this command inside the
otelcol-contribdirectory that you created in the install Otel Collector step../otelcol-contrib --config ./config.yaml
- Run your application:
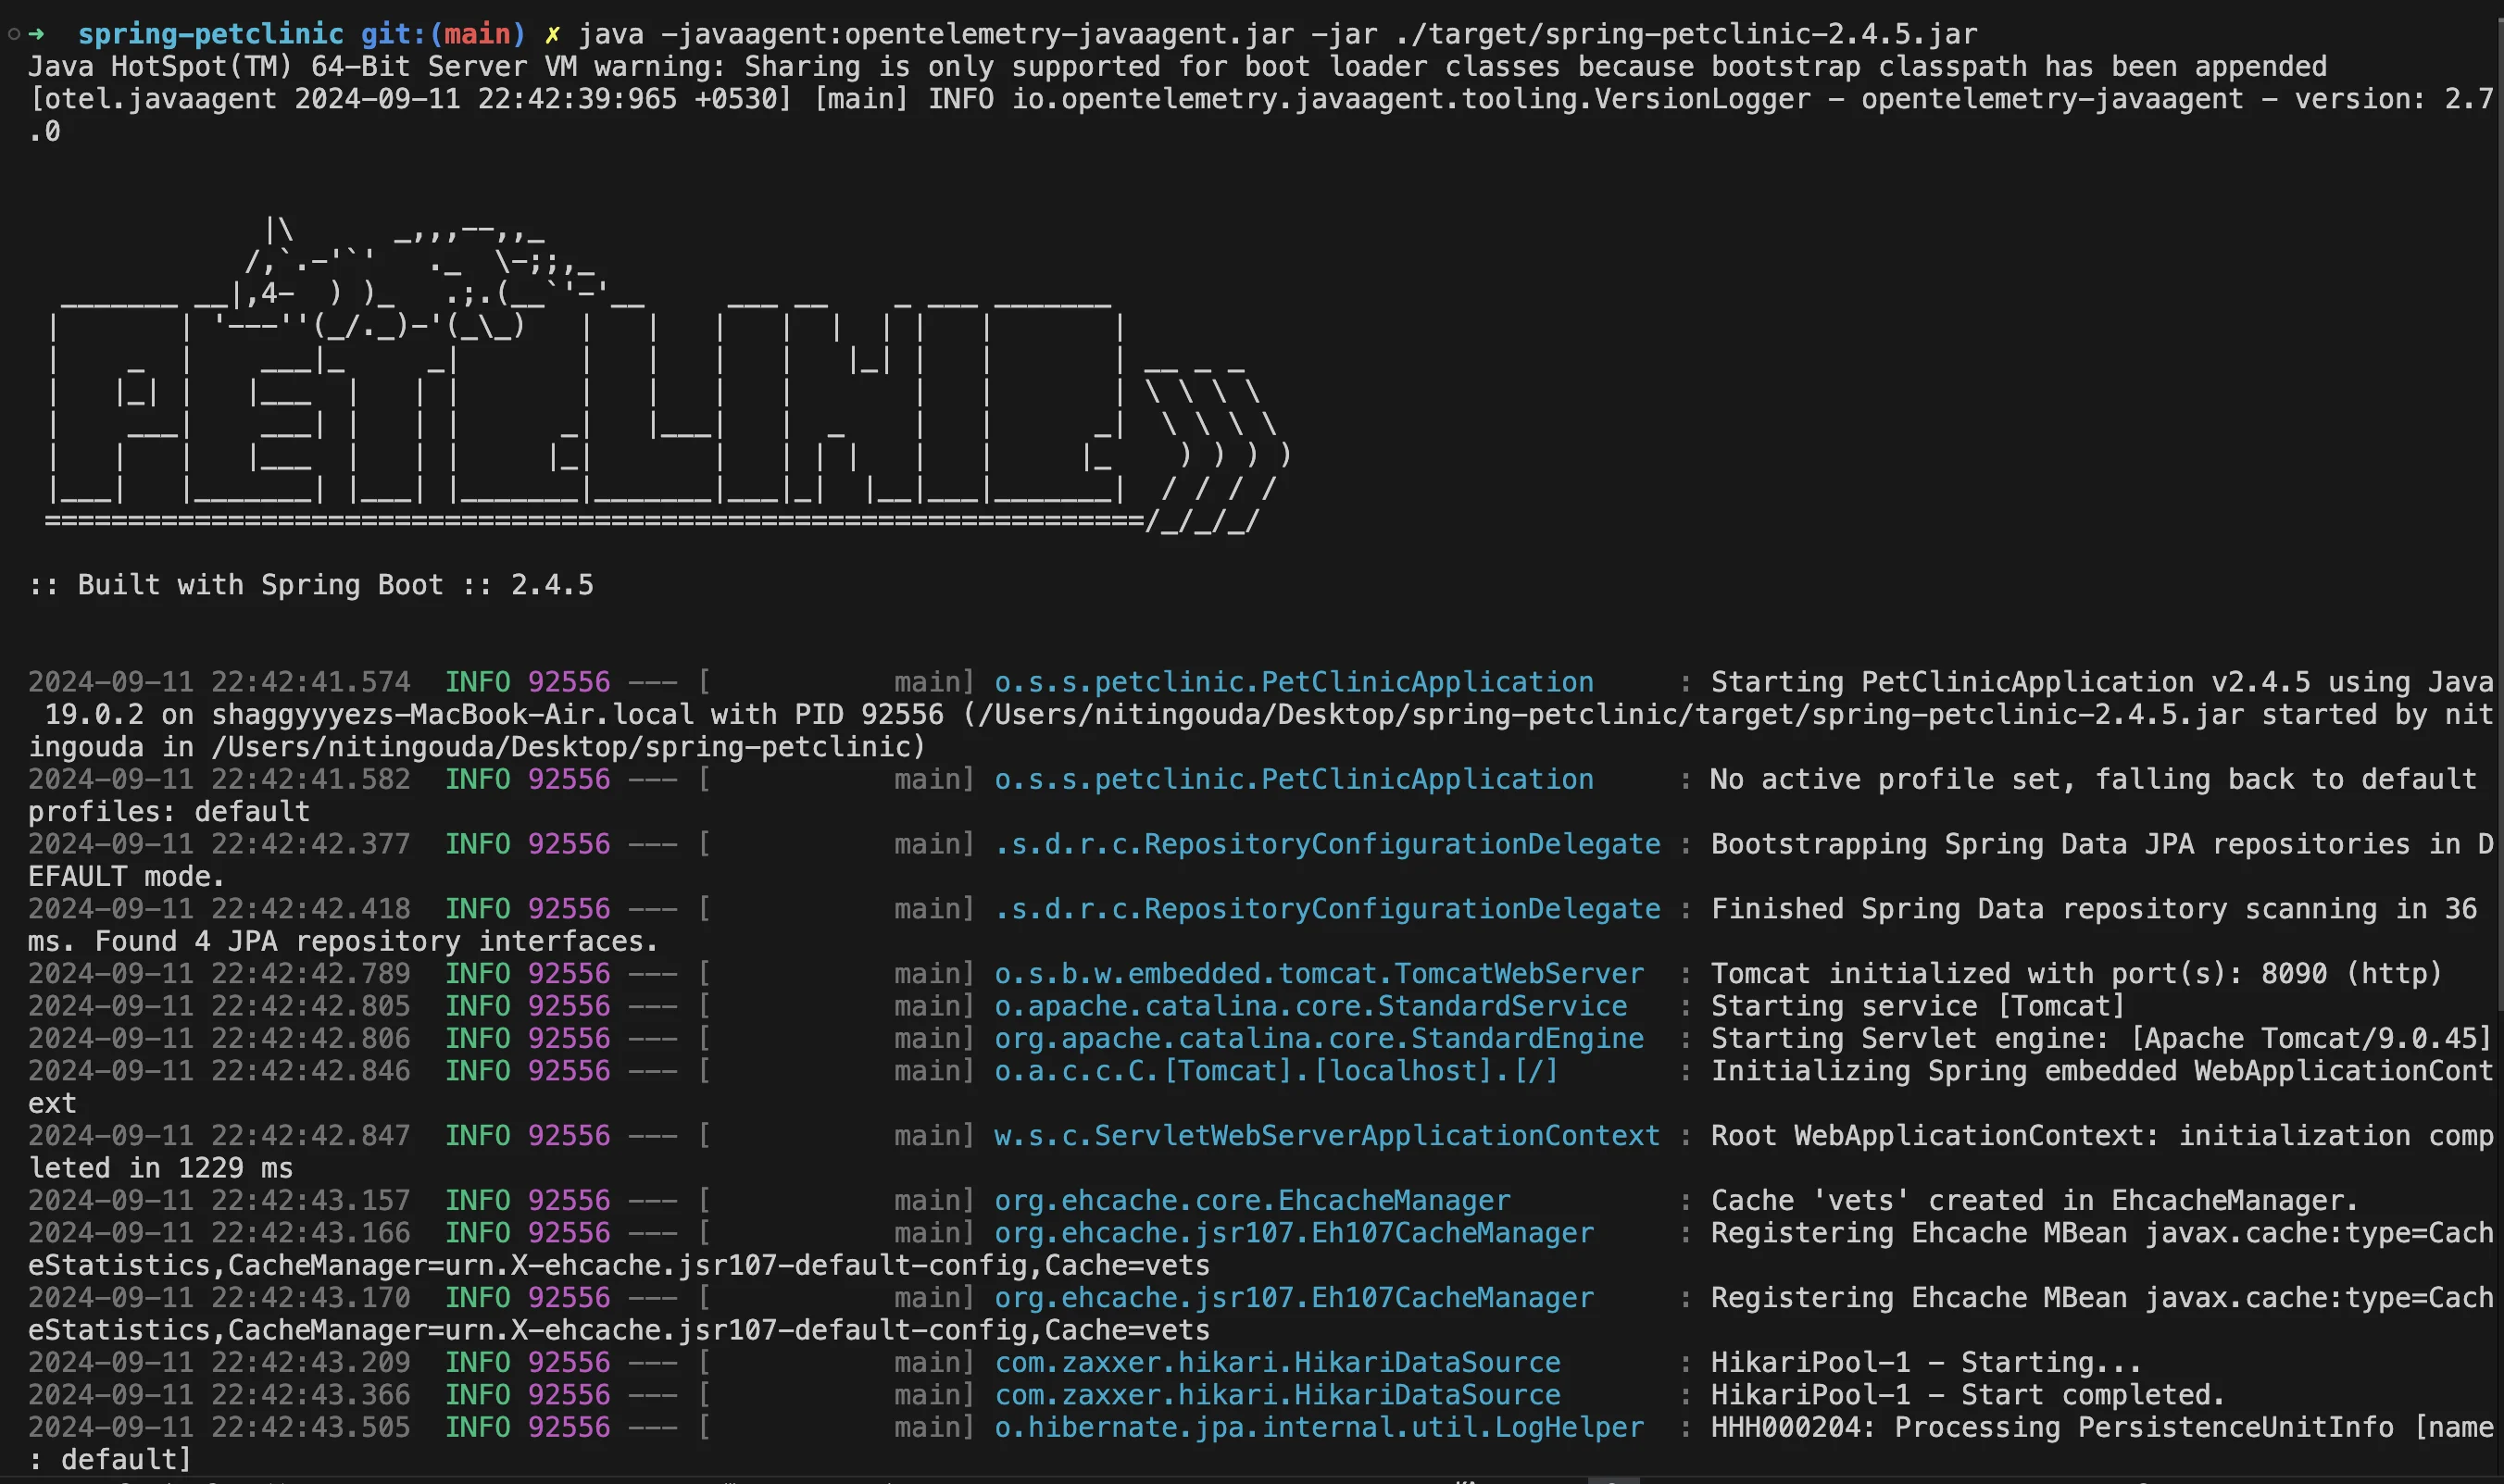
In a new terminal window, start your application using the Java agent.
java -javaagent:<path>/opentelemetry-javaagent.jar -jar <my-app>.jar
Update it to the path where you downloaded the Java JAR agent in the previous step. For example:
java -javaagent:opentelemetry-javaagent.jar -jar ./target/spring-petclinic-2.4.5.jar
Go to the SigNoz dashboard and plot metrics: If the app and otel-contrib ran without error, all your metrics would be sent to your SigNoz cloud. The next step is to create a dashboard to view the metrics data. For SigNoz, we have shared some commonly used dashboard JSON files here.
For this example, we will use the JVM Metrics By Service JSON file. To know more about how to import & customize Dashboards in SigNoz check our documentation here.
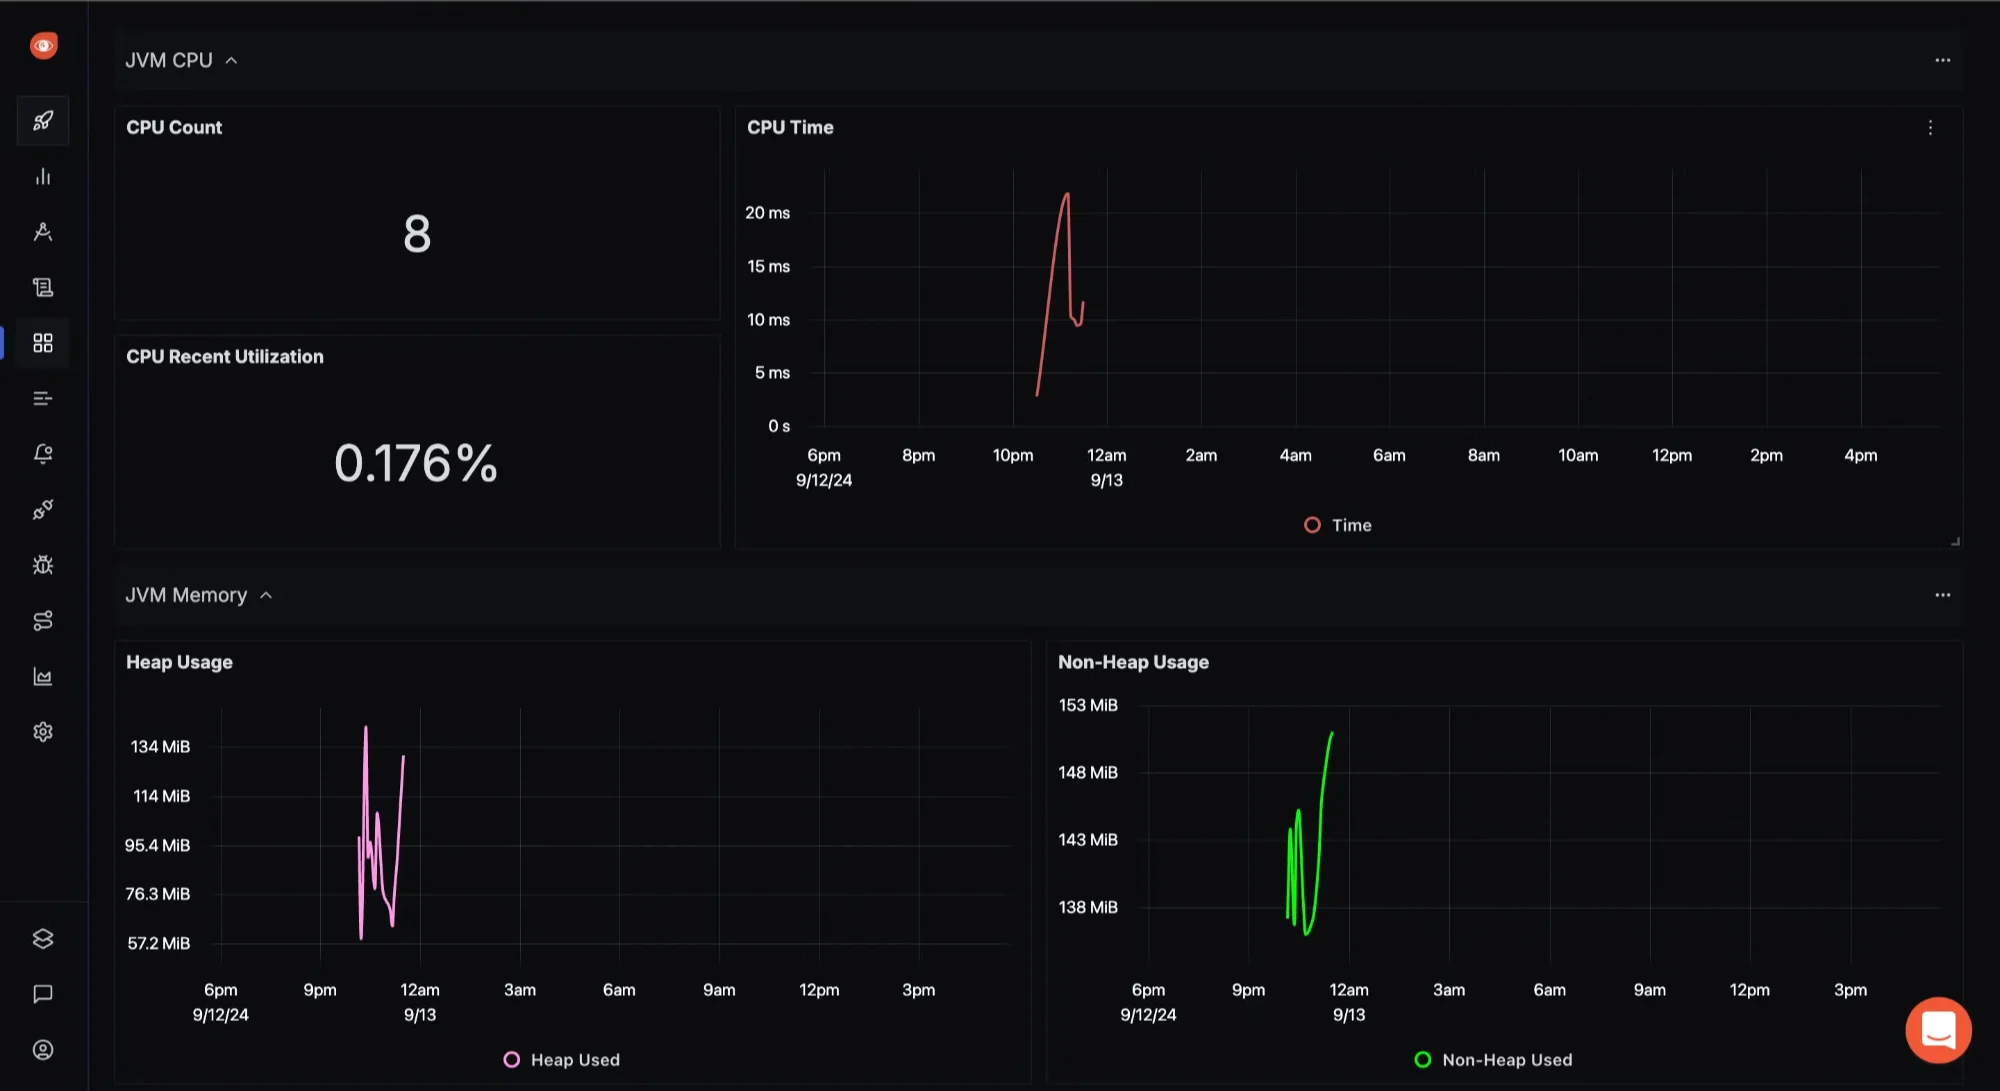
JVM CPU & Memory Metrics 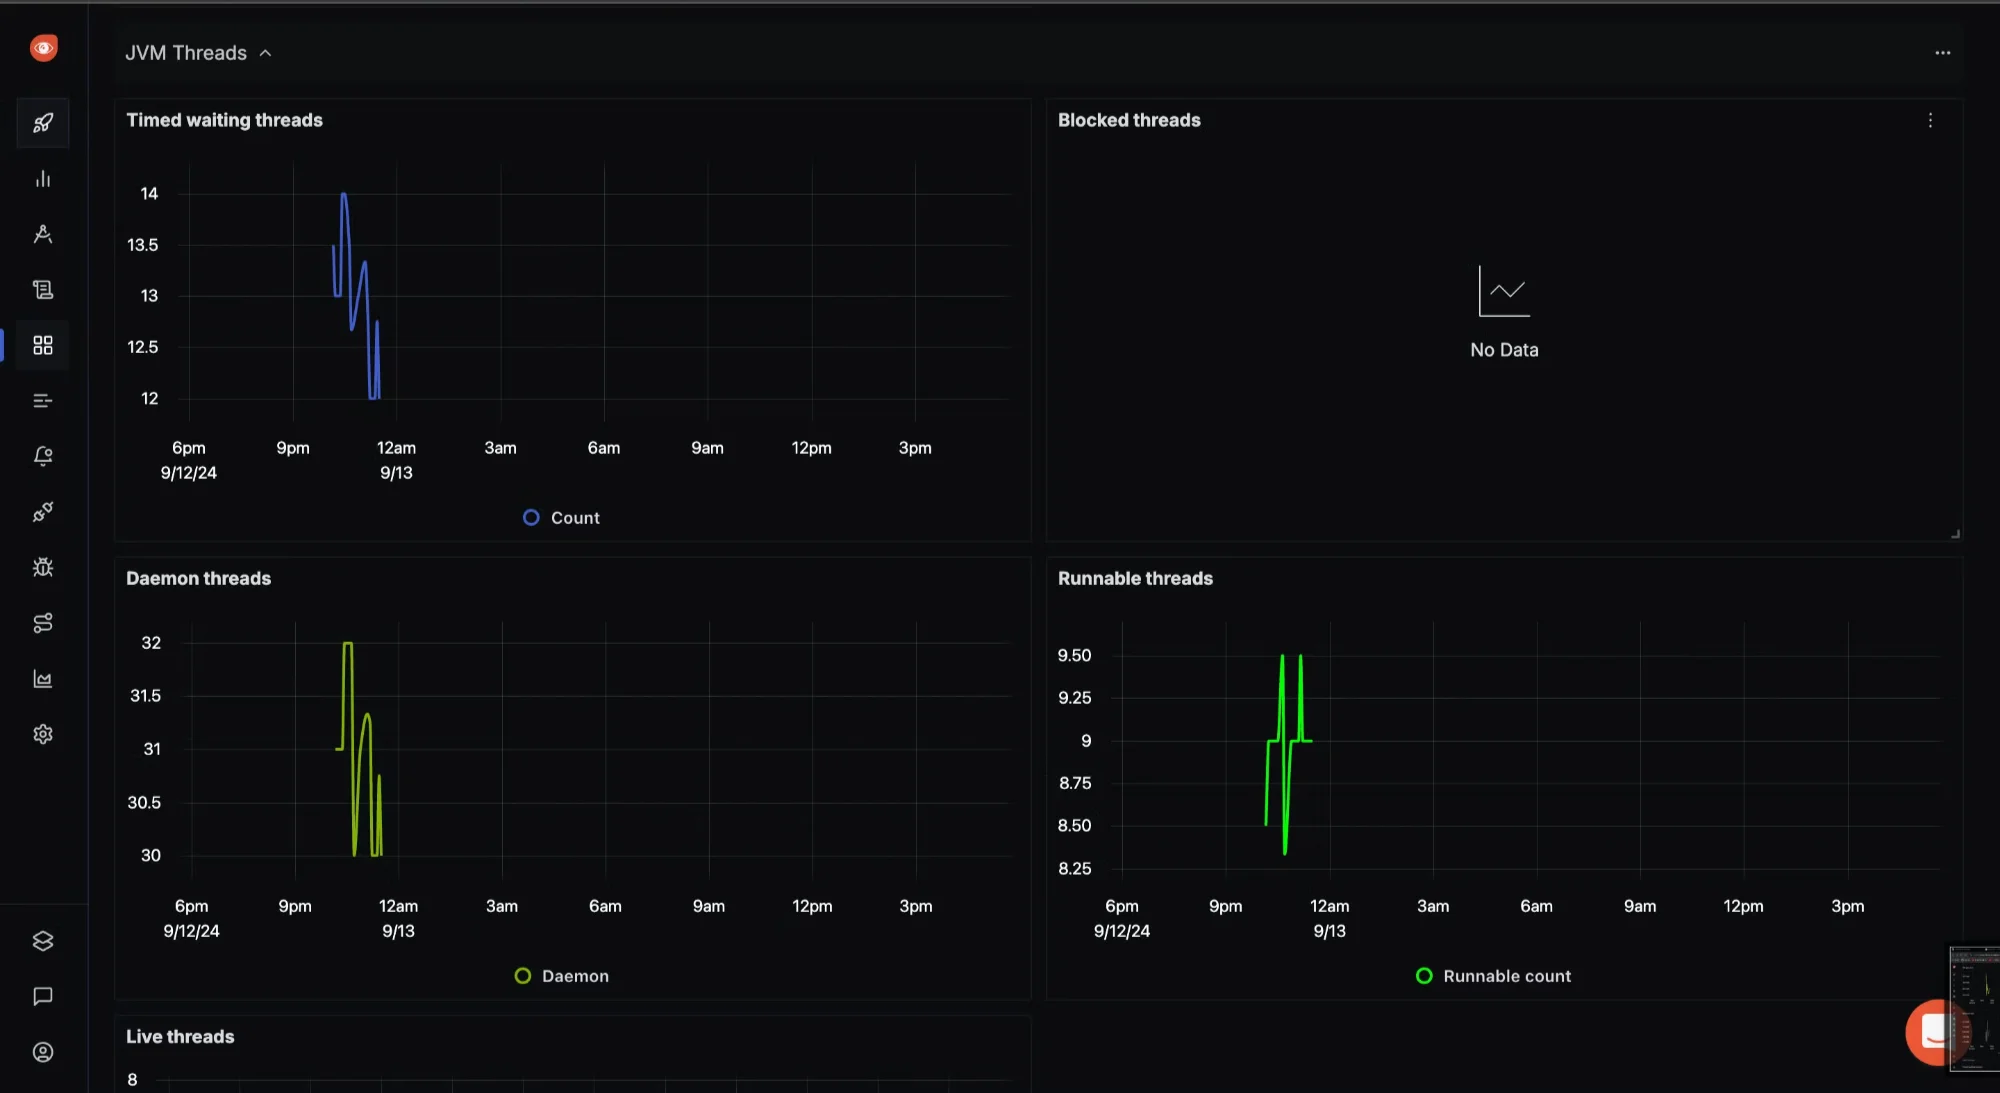
JVM Threads 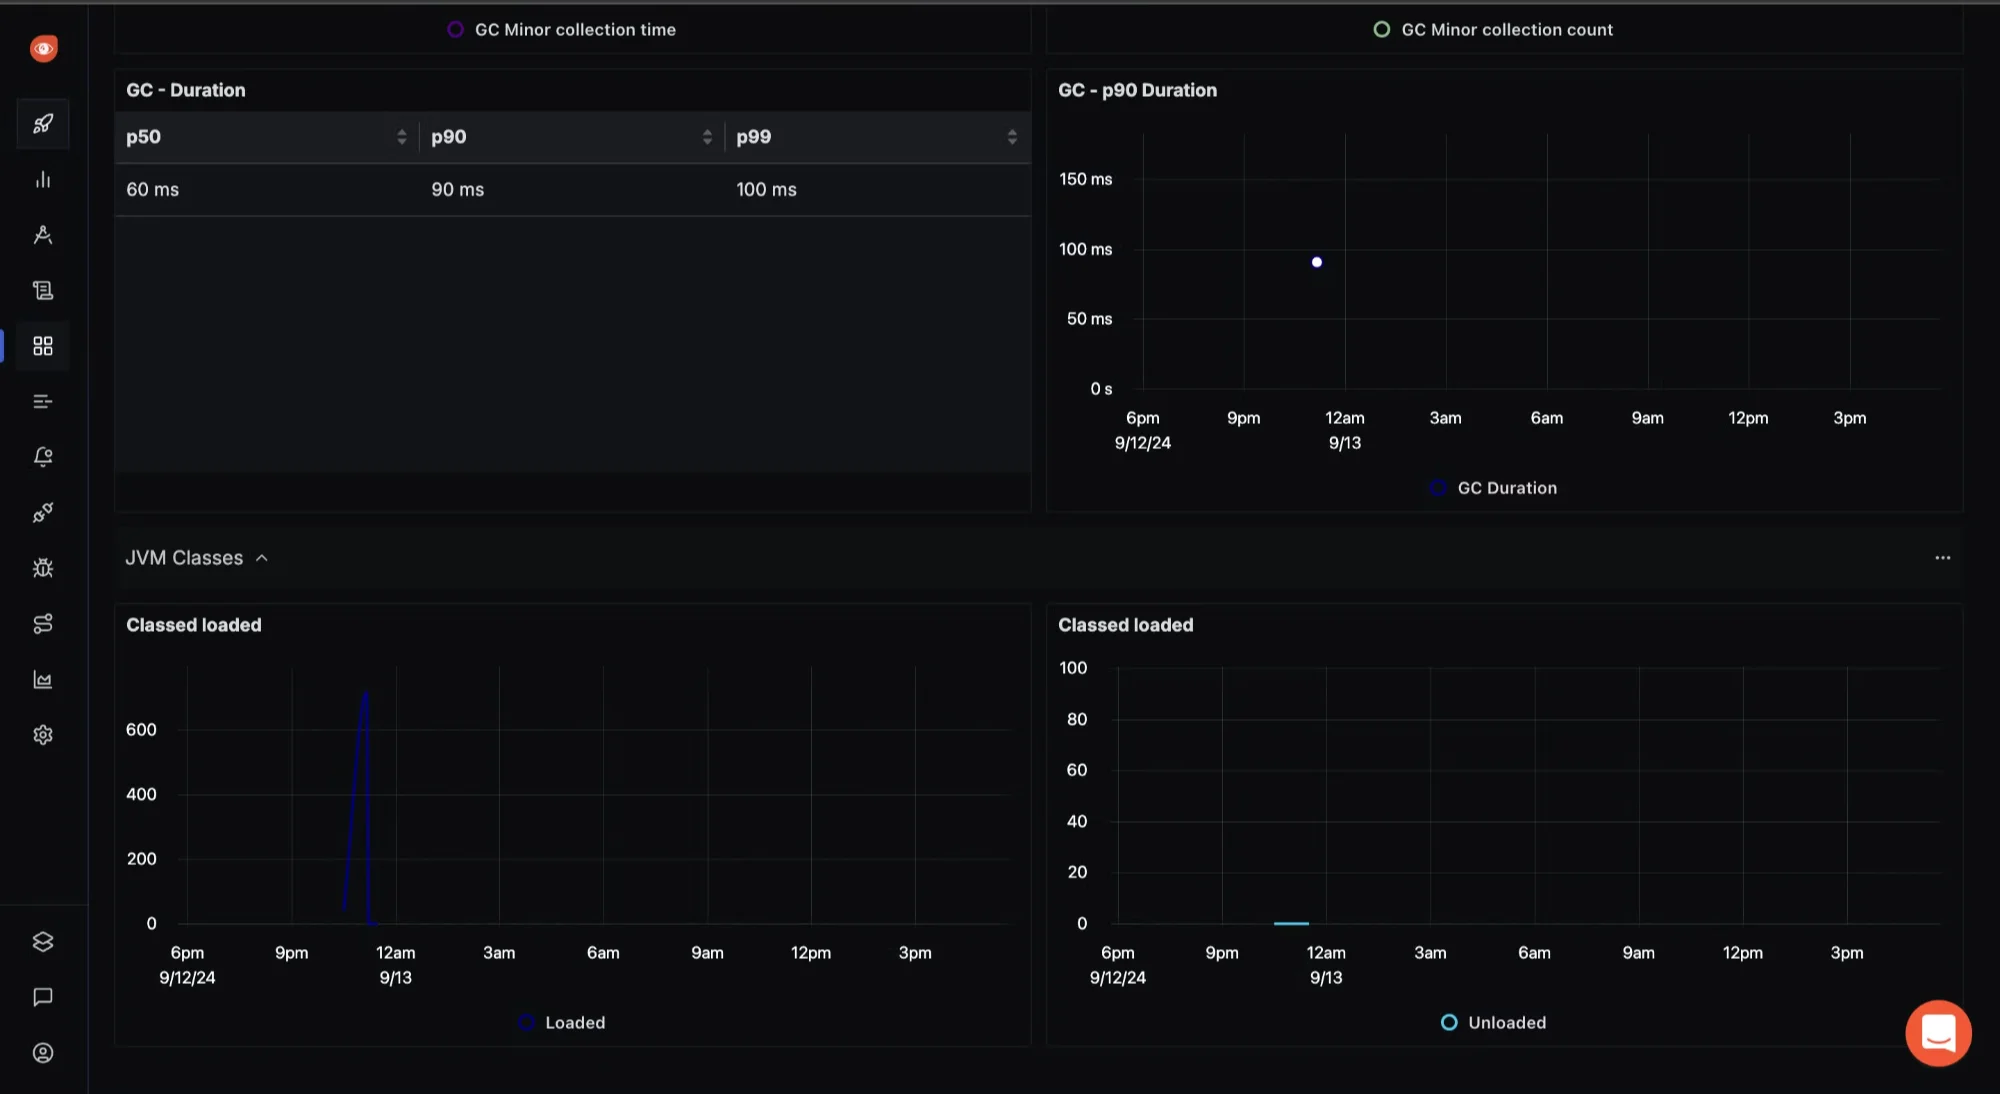
JVM Classes 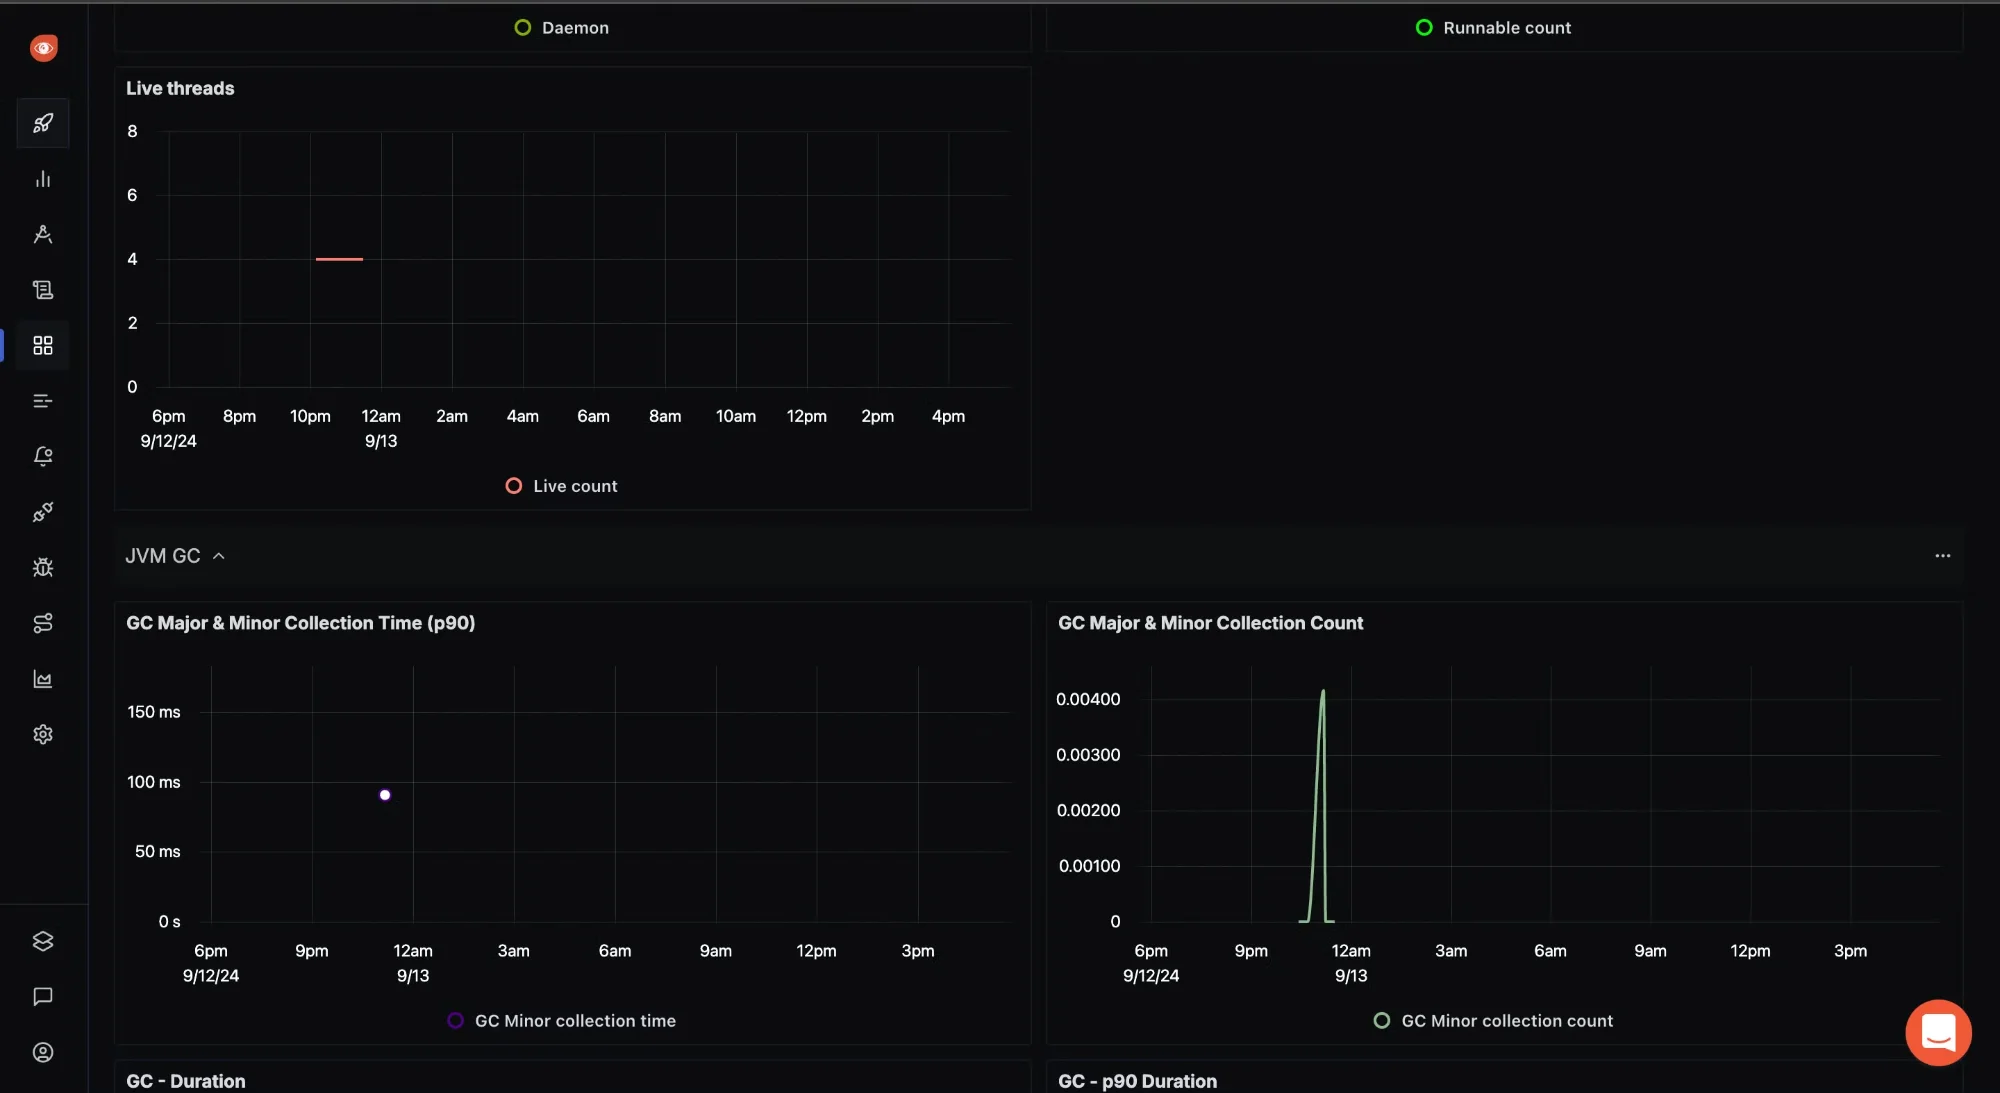
JVM GC
Troubleshooting Common Memory Issues
Use your memory usage graphs to identify and address common issues:
- Memory leaks:
- What to Look for: Even during periods of low activity, if you observe a steady, continuous increase in memory consumption over time without any corresponding decrease, it may indicate a potential issue.
- Solutions: Programs that neglect to release memory that is no longer required result in memory leaks. This may eventually result in excessive memory use and the depletion of available resources. To fix this:
- Utilise memory profiling utilities (such as Memory Profiler and Valgrind) to find objects or data structures that aren't being properly released or garbage collected.
- To make sure that appropriate memory management techniques are being implemented, such as releasing unneeded memory or preventing circular references, review and restructure the code.
- Memory fragmentation:
- What to Look For: Significant discrepancies between the allocated memory (VSZ) and the memory actually in use (RSS). This can indicate that memory is allocated in a fragmented manner, causing inefficient usage.
- Solution: Memory fragmentation can reduce the efficiency of memory usage and lead to poor performance. To mitigate this:
- Implement memory pooling techniques to allocate memory in large contiguous blocks, reducing fragmentation.
- Adjust memory allocation strategies, such as using custom allocators that minimize fragmentation by organizing memory more efficiently.
- Excessive memory usage:
- What to Look For: Processes that consume significantly more memory than expected, which strain system resources and affect overall performance.
- Solution: Excessive memory usage can be due to inefficient code or resource-intensive operations. To address this:
- Optimize algorithms to reduce their memory footprint. For example, switch from an O(n^2) to an O(n log n) algorithm if applicable.
- Use more efficient data structures that consume less memory.
- Implement lazy loading techniques to load data only when necessary, rather than all at once.
- Memory thrashing:
- What to Look For: Rapid and frequent increases and decreases in memory usage, often accompanied by high disk I/O. This is a sign of memory thrashing, where the system spends more time swapping data between RAM and disk than executing actual processes.
- Solution: Memory thrashing can severely degrade performance, as the CPU spends more time managing memory than performing useful work. To reduce thrashing:
- Adjust memory allocation policies to ensure that critical processes have sufficient memory without excessive swapping.
- Increase the amount of available RAM, if possible, to reduce reliance on disk swapping.
- Tune the system’s virtual memory settings to balance between performance and memory usage.
By regularly monitoring and analyzing your memory usage graphs, you can identify these issues early and take corrective action. Implementing the appropriate solutions ensures that your applications run efficiently, with minimal disruptions due to memory-related problems. Regular analysis also helps prevent potential issues from escalating, maintaining optimal system performance and stability.
Key Takeaways
- Graphing process memory usage is crucial for gaining insights into how your system and applications are performing. It helps you visualize memory consumption patterns, making it easier to detect issues.
- Choose tools that align with your operating system and the specific requirements of your task. Whether you're using built-in utilities or third-party applications, ensure they meet your needs for data collection and visualization.
- Regularly collect memory usage data to build a comprehensive view of how your processes are behaving over time. This consistency is key to creating accurate and reliable graphs.
- Learn to read and analyze memory usage graphs to identify trends, spot anomalies, and detect potential issues like memory leaks. This skill is essential for effective performance monitoring and troubleshooting.
- For more detailed memory analysis, consider using advanced tools like SigNoz. These tools offer deeper insights and allow you to correlate memory usage with other system metrics, providing a more complete picture.
- Analyze your memory consumption statistics regularly and address any issues that develop. By staying on top of possible issues, you can ensure optimal system performance and avoid future hassles.
FAQs
What is the difference between RSS and VSZ in memory usage?
RSS (Resident Set Size) refers to the actual physical memory that a process is using at a given time. In contrast, VSZ (Virtual Set Size) represents the total amount of virtual memory allocated to a process, including memory that may be swapped out or allocated but not currently in use.
How often should I collect memory usage data for graphing?
The frequency of data collection depends on your goals. For general system monitoring, collecting memory usage data every 5 to 15 minutes is usually adequate. If you’re troubleshooting issues or monitoring short-lived processes, more frequent data collection—such as every 30 seconds or even every second—might be necessary.
Can I graph the memory usage of multiple processes simultaneously?
Yes, you can graph multiple processes on the same chart to compare their memory usage, which is useful for understanding how different processes impact system resources.
What are some signs of a memory leak in a usage graph?
Signs of a memory leak in a usage graph include:
- Steady, Continuous Increase: A gradual, ongoing rise in memory usage without any reduction over time.
- Lack of Decrease After Peaks: Memory usage remains high even after a process has finished its peak activity, rather than dropping back to normal levels.
- Step-Like Patterns: Memory usage appears to jump in increments and never returns to previous levels, creating a stair-step effect.
If you notice these patterns, it's essential to conduct a thorough investigation using memory profiling tools to identify the leak and address the issue promptly.


