Docker-Compose healthchecks play a crucial role in maintaining the reliability and performance of containerized applications. As a developer or system administrator, you need to know how to view and interpret these logs to ensure your containers are running smoothly. This guide will walk you through the process of accessing Docker-Compose healthcheck logs, provide advanced techniques for log analysis, and offer best practices for implementing effective healthchecks.
Understanding Docker-Compose Healthchecks
Docker-Compose healthchecks are automated scripts or commands that continually monitor your containers' state and functioning. These healthchecks are scheduled to run at regular intervals to ensure that all containers in your application are running properly. These tests contribute to the general dependability and stability of your application by monitoring the health of your services on a regular basis.
- Early detection of issues: Healthchecks can catch potential problems at an early stage, often before they escalate into major issues that could impact users or other services in your application. By identifying issues in real-time, healthchecks allow for quick responses, minimizing downtime and preventing cascading failures.
- Automated recovery: When a healthcheck fails, Docker can be configured to automatically take corrective actions, such as restarting the container. This ensures that minor issues are resolved without manual intervention, maintaining service availability.
- Load balancing: In environments where load balancing is crucial, such as Docker Swarm, healthchecks ensure that traffic is only directed to containers that are confirmed to be healthy. This helps in maintaining optimal performance and avoids sending requests to malfunctioning containers.
- Dependency management: Healthchecks play a vital role in managing service dependencies, ensuring that services are started in the correct order. For example, a database service should be fully operational before a web service that depends on it is considered healthy and ready to serve requests.
Docker-Compose healthchecks are an essential tool for maintaining the operational integrity of containerized applications, providing both early warnings and automated recovery mechanisms to keep services running smoothly.
Quick Guide: Viewing Docker-Compose Healthcheck Logs (Add Image)
To effectively monitor and troubleshoot your Docker-Compose services, it's important to know how to access and interpret healthcheck logs. Here’s a step-by-step guide:
Use the
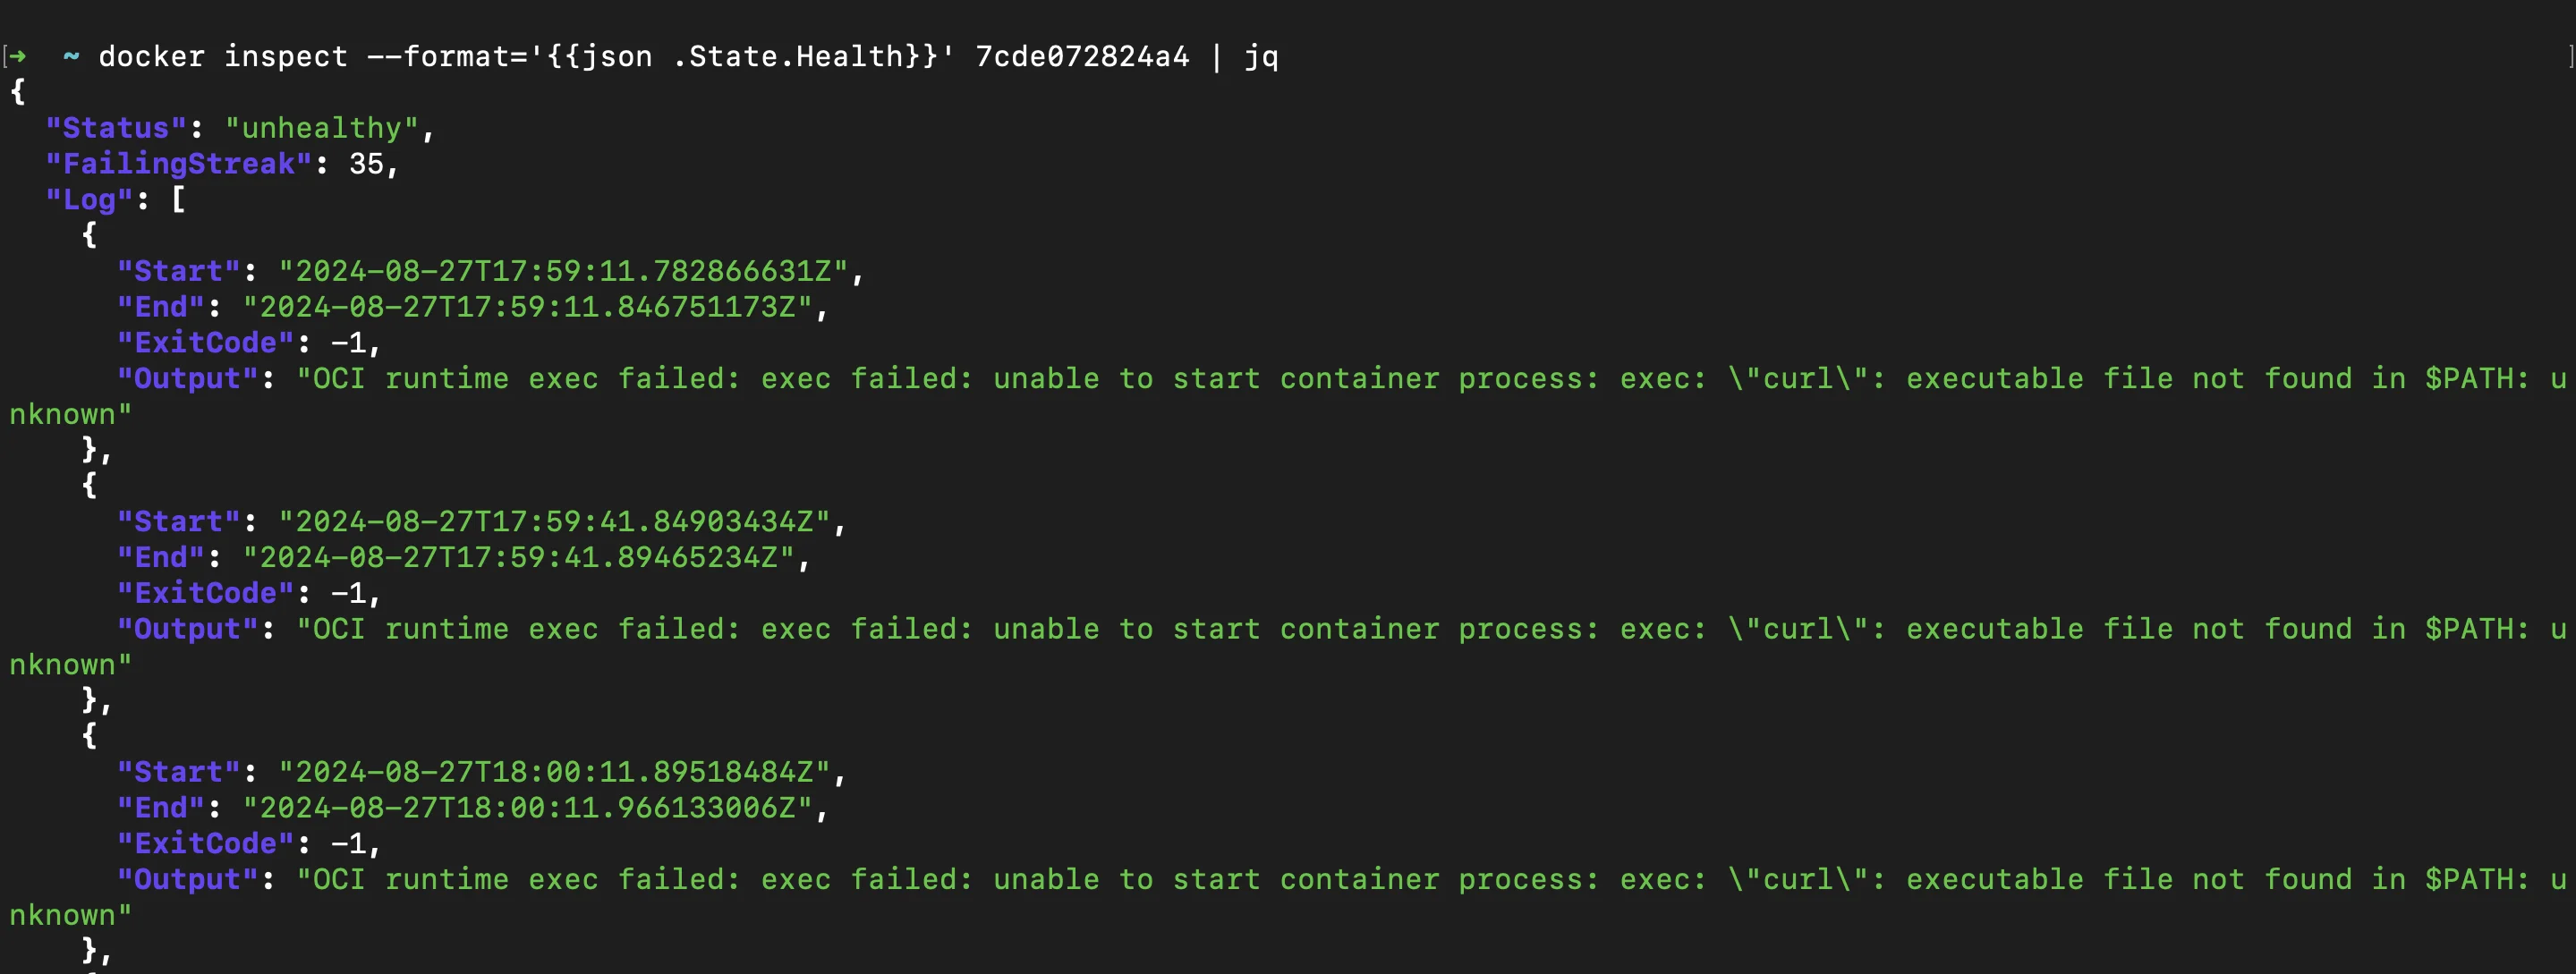
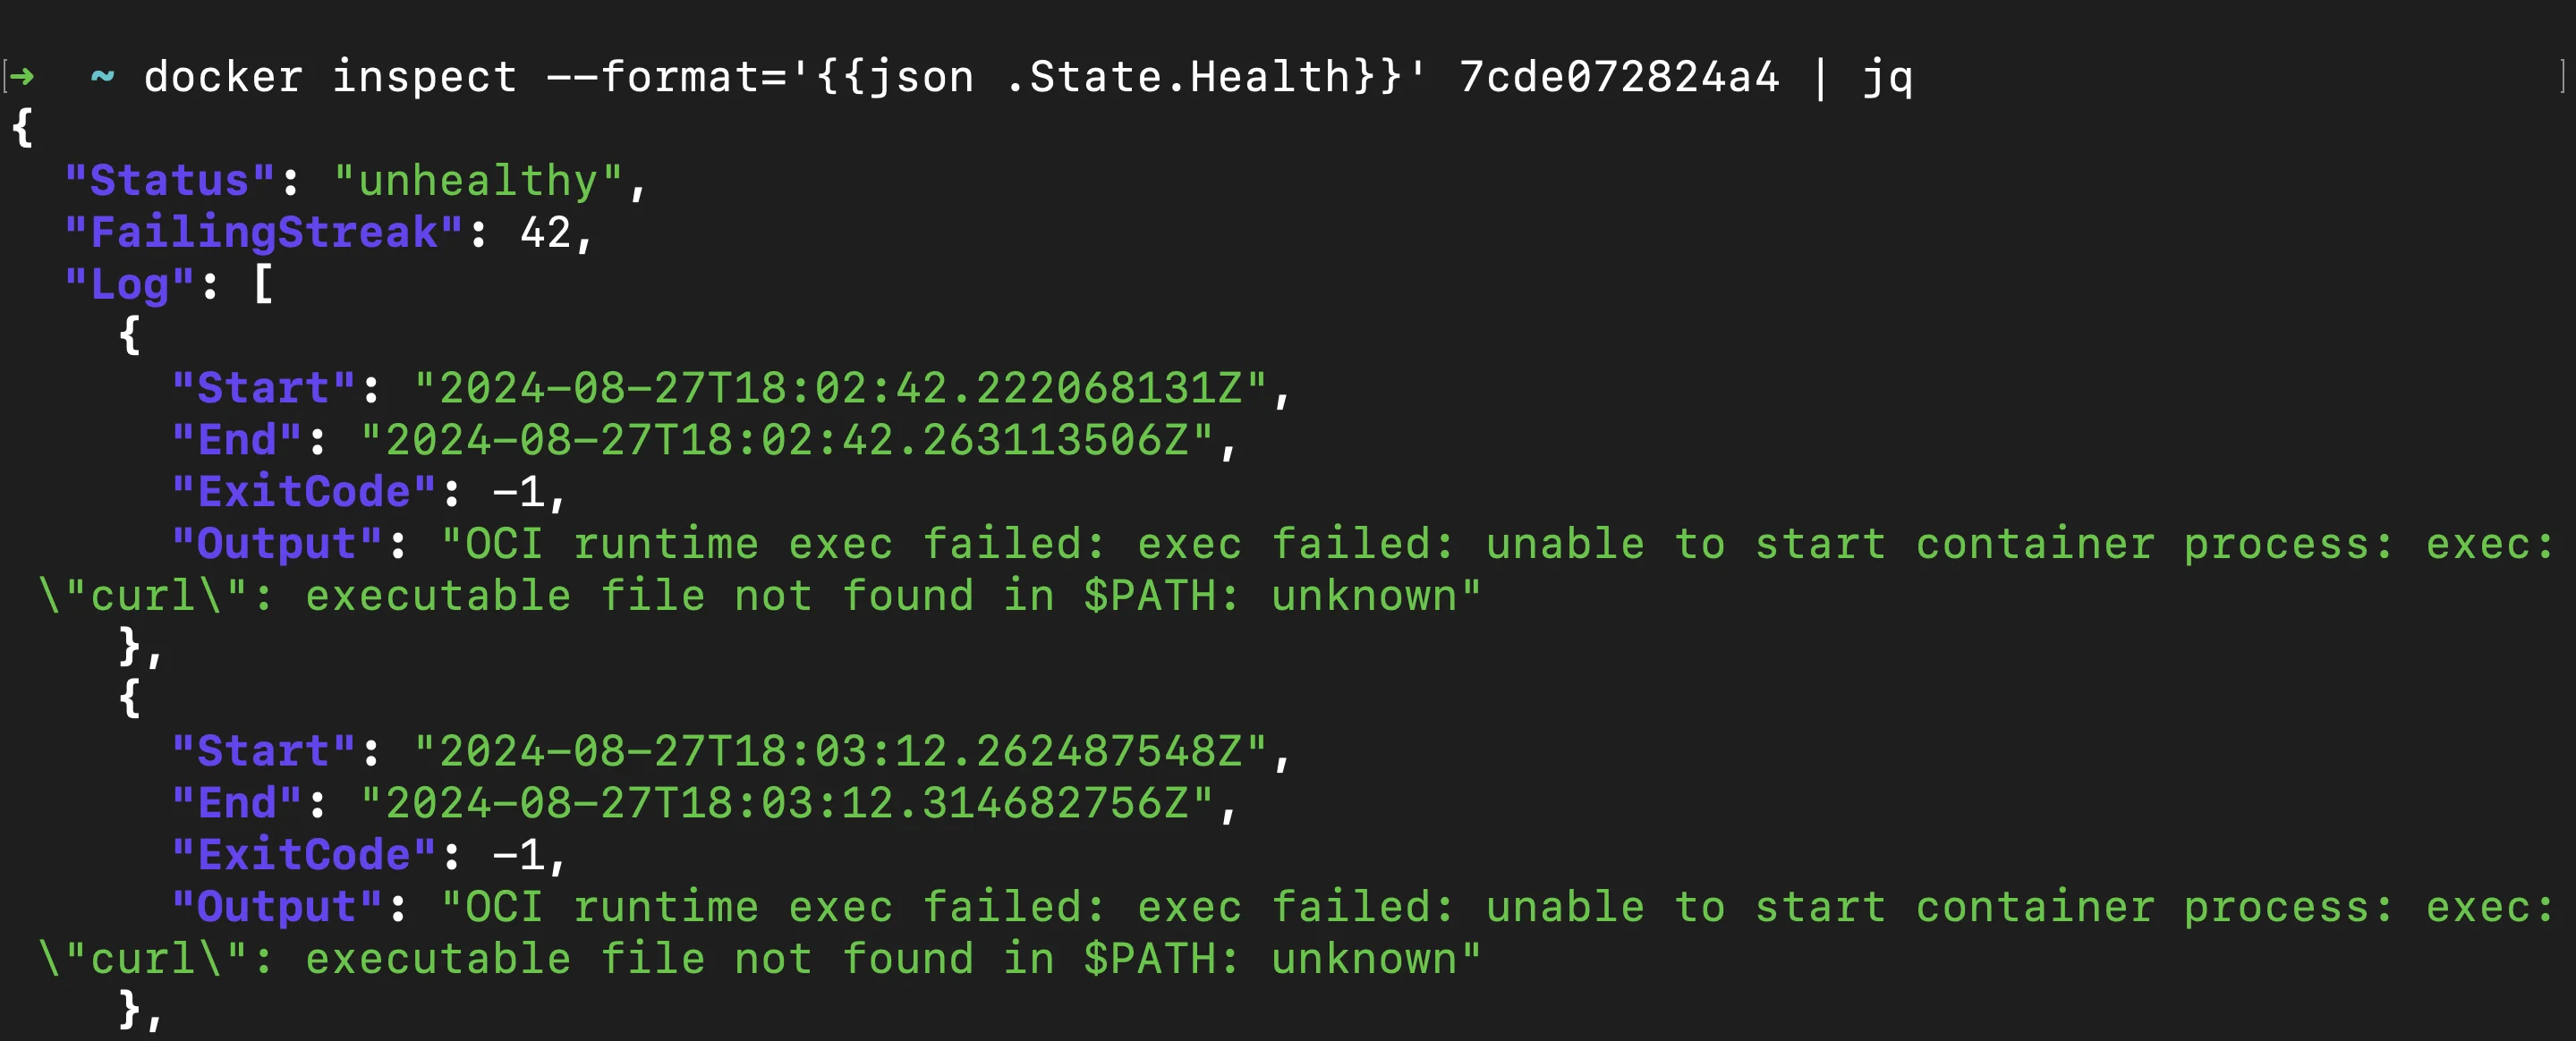
docker inspectcommand: This command allows you to retrieve detailed information about a container, including its health status.docker inspect --format='{{json .State.Health}}' <container_name> | jqReplace
<container_name>with the container-id or container-name.The command returns a JSON object that includes the current health status of the container and the results of recent healthchecks. This is useful for quickly checking the health of your container and seeing a history of its healthcheck results. If you have raw JSON output,
jqcan format it in a more readable way.
docker inspect logs Check the
Healthsection in the inspect output: Thedocker inspectoutput contains aHealthsection where you can find the current status of the container’s healthcheck.
docker inspect - health status Status: Indicates whether the container is "starting", "healthy", or "unhealthy".Log: Contains entries of recent healthchecks, including the output of the check command and its exit status.
This section helps you understand the current health state of your container and identify any recent failures or successes in the healthcheck process.
Use the
docker logscommand for detailed logs: Whiledocker inspectgives a summary of the health status,docker logsprovides a more detailed view by showing the container’s standard output (stdout) and standard error (stderr), where healthcheck results may be logged.docker logs <container_name>This command shows the container's stdout and stderr, which often include healthcheck results.

docker logs Interpret healthcheck status and results:
- "starting": Indicates that the container is still within its startup period, and healthchecks are not yet determining the overall health status.
- "healthy": The container has passed its most recent healthcheck, indicating it is functioning as expected.
- "unhealthy": The container has failed its healthcheck, signaling a potential problem that may require attention.
Understanding these statuses helps you quickly assess whether a container is operating normally or if there are issues that need to be addressed.
Advanced Techniques for Healthcheck Log Analysis
For more comprehensive Docker-Compose healthcheck logs, you can leverage several advanced techniques. These methods can help you gain deeper insights into the health and performance of your containers, manage log data efficiently, and monitor service health more effectively.
Utilize
docker service psfor swarm mode services: In Docker Swarm mode,docker service psprovides an overview of the tasks (containers) associated with a service, including their health status.docker service ps --format "{{.Name}}: {{.CurrentState}}" service_name
-format "{{.Name}}: {{.CurrentState}}": Customizes the output to show the name of each task and its current state.service_name: Replace with the name of your service.
This command shows the current state of all tasks in a service, including healthcheck status.
Implement custom logging drivers: Custom logging drivers can centralize and manage healthcheck logs more effectively. You can configure a logging driver like Fluentd or Logstash to collect and centralize healthcheck logs.
Use third-party monitoring tools: Tools like Prometheus with Grafana can provide visual insights into your healthcheck statuses over time. Third-party monitoring tools can offer advanced features for visualizing and analyzing healthcheck data.
Set up log rotation: Docker provides built-in options for configuring log rotation for containers using the
json-filelogging driver. Log rotation helps manage log file sizes and retention periods, preventing disk space issues. Here’s how you can set it up in yourdocker-compose.ymlfile:services: my_service: image: <image> logging: driver: "json-file" options: max-size: "10m" max-file: "3"
driver: Specifies the logging driver to use. For log rotation, thejson-filedriver is commonly used.max-size: Defines the maximum size of each log file before it gets rotated. For example,"10m"limits log files to 10 megabytes. Once this size is reached, the log file will be rotated.max-file: Specifies the number of rotated log files to keep. For instance,"3"keeps the latest three log files. Older files are deleted after reaching this limit.
Troubleshooting Common Healthcheck Issues
When dealing with healthcheck failures, consider these troubleshooting steps:
Identify failed healthchecks: Use the
docker eventscommand to observe healthcheck events as they occur. This command helps you track changes in container health status, enabling you to quickly pinpoint when and where issues arise.docker events --filter 'event=health_status'This command filters Docker events to display only those related to health status changes. You'll see real-time updates whenever a container's health status transitions, such as from "healthy" to "unhealthy."
Debug timing-related problems: Timing-related issues are common in Docker healthchecks, especially when the services inside your containers require more time to start up or respond than the healthcheck parameters allow. Misconfigured timing can lead to unnecessary healthcheck failures, causing containers to be marked as unhealthy or even restarted prematurely.
healthcheck: test: ["CMD", "curl", "-f", "http://localhost/health"] interval: 1m30s timeout: 10s retries: 3 start_period: 40s- Adjust the
intervalParameter: Theintervalparameter defines how often the healthcheck is run. If your service takes longer to stabilize after startup or under heavy load, a short interval might cause the healthcheck to fail frequently. - Evaluate
retriesCount: Theretriesparameter determines how many consecutive failures Docker should tolerate before marking the container as unhealthy. If your service has intermittent issues, increasing theretriescount can prevent it from being prematurely flagged as unhealthy. - Use the
start_periodParameter: Thestart_periodparameter defines a grace period after the container starts, during which Docker ignores failed healthchecks. This is particularly useful for services that require a long startup time before they can respond to healthcheck requests.
- Adjust the
Handle network-related failures: Network-related failures in Docker healthchecks can occur due to various factors like network latency, temporary outages, or unstable network connections. If not properly managed, these issues can cause your containers to be marked as unhealthy, even when the service itself is functioning correctly.
Design Healthchecks to Be Resilient to Network Fluctuations: Ensure that your healthcheck commands can handle brief network interruptions or latency. For example, if your healthcheck involves making an HTTP request, use tools that can retry the request or include built-in timeout handling.
Use Graceful Failures in Healthcheck Commands: Implement error handling in your healthcheck scripts or commands to deal with network-related issues. For example, you could script a healthcheck that returns a temporary "warning" state instead of an immediate failure if a network call fails.
#!/bin/sh
if curl -f http://localhost/health; then
  exit 0
else
  # Log the failure for further analysis
  echo "Healthcheck warning: Network issue detected" >> /var/log/healthcheck.log
  exit 1
fi
Monitor and Adjust Based on Network Conditions: Regularly monitor the performance of your healthchecks in relation to network conditions. If you notice frequent network-related failures, consider further adjustments to the
interval,timeout, or even the nature of the healthcheck itself.healthcheck: test: ["CMD", "curl", "-f", "http://localhost/health"] interval: 1m30s timeout: 30s retries: 5 start_period: 1m
Optimize healthcheck performance: Optimizing the performance of healthchecks is crucial to ensuring that they accurately monitor the health of your Docker containers without introducing unnecessary overhead or consuming excessive resources. Poorly designed healthchecks can lead to performance bottlenecks, increased resource usage, and even false positives, where healthy containers are marked as unhealthy.
healthcheck: test: ["CMD", "curl", "-f", "http://localhost/health"] interval: 30s timeout: 5s retries: 3 start_period: 10s- Use Lightweight Commands: The commands used in healthchecks should be as lightweight as possible. Avoid complex scripts or commands that require significant CPU, memory, or I/O operations, as these can degrade the overall performance of the container. eg. CMD, curl etc.
- Reduce Healthcheck Frequency: Set the healthcheck
intervalto a reasonable value that balances responsiveness with performance. Too frequent checks can overwhelm the container and host system, especially if the check itself is resource-intensive. - Adjust Timeout and Retry Settings: Fine-tune the
timeoutandretriessettings to prevent the healthcheck from running too long or retrying excessively. If the healthcheck takes too long, it can consume resources that could otherwise be used by the application itself. - Limit the Scope of Healthchecks: Focus your healthchecks on critical aspects of the service rather than testing every possible condition. For instance, checking if a web server is responding may be sufficient, without needing to check every endpoint or perform extensive database queries.
Customizing Healthchecks in Docker-Compose
Healthchecks are crucial for monitoring the health of your services within Docker. By customizing healthchecks in your docker-compose.yml file, you can fine-tune how Docker determines if your services are running correctly and when to take corrective actions.
services:
  web:
    image: nginx
    healthcheck:
      test: ["CMD", "curl", "-f", "<http://localhost>"]
      interval: 1m30s
      timeout: 10s
      retries: 3
      start_period: 40s
test: Thetestparameter defines the command that Docker will execute inside the container to check its health. This command should return a zero exit code if the container is healthy. In this example,curl -f http://localhostchecks if the Nginx server is responding to requests. The-foption ensures thatcurlwill return an error code if the HTTP response code is 400 or greater, indicating that the web server is not functioning correctly.interval: Theintervalparameter specifies how frequently the healthcheck command is executed. In this case, the interval is set to1m30s, meaning Docker will run the healthcheck every 90 seconds. Adjusting this value allows you to control the balance between responsiveness and resource usage. Shorter intervals make the service status more responsive to changes but may consume more resources.timeout: Thetimeoutparameter sets the maximum time Docker will wait for the healthcheck command to complete before considering it failed. Here, it is set to10s, meaning if thecurlcommand doesn’t return within 10 seconds, the healthcheck is considered failed. This parameter helps ensure that the healthcheck does not hang indefinitely, potentially leading to incorrect health status reporting.retries: Theretriesparameter determines how many consecutive healthcheck failures are required before Docker considers the container to be unhealthy. In this example, Docker will mark the container as unhealthy after three consecutive failures. This prevents transient issues, such as temporary network outages, from immediately causing the container to be marked as unhealthy.start_period: Thestart_periodparameter allows you to define a grace period after the container starts, during which Docker will not count any healthcheck failures. This is useful for services that take time to initialize. Here, astart_periodof40smeans that the healthchecks will begin after the container has been running for 40 seconds, giving Nginx time to start up fully before Docker begins monitoring its health.
Best Practices for Docker-Compose Healthchecks
Follow these best practices to maximize the effectiveness of your healthchecks:
Design meaningful checks: Instead of merely checking if a process is running, design healthchecks that verify the actual functionality of the service. For instance, for a web service, a healthcheck might request a specific endpoint to confirm that the service is responding correctly. This ensures that the service is not only running but also operating as expected. While it’s important to test critical functionality, avoid making healthchecks too complex. They should be simple enough to run quickly and frequently without consuming too many resources.
Keep checks lightweight: Healthchecks should be lightweight and fast. Heavy or resource-intensive checks can negatively impact the performance of your container, especially if they are run frequently. Use basic commands like
curlor simple scripts that complete quickly to ensure minimal disruption to the container's operation.Set appropriate intervals: The interval between healthchecks should be set based on the criticality of the service. For high-availability services, a shorter interval may be necessary to detect and respond to issues quickly. However, running checks too frequently can strain system resources, especially in environments with many containers. Typically, an interval of 30 seconds to 2 minutes is sufficient for most services..
Use environment variables: To enhance flexibility and adaptability, use environment variables in your healthcheck commands. This allows you to modify healthcheck behavior without changing the code. For example:
healthcheck:
	test: ["CMD", "curl", "-f", "http://${HOST:-localhost}:${PORT:-80}/health"]
Implement graceful shutdowns: Ensure that your application can handle
SIGTERMsignals, which are sent by Docker when stopping a container. Properly handling these signals allows your application to clean up resources and shut down gracefully.
Monitoring Docker-Compose Healthchecks with SigNoz
To effectively monitor Docker Compose Healthchecks, using an advanced observability platform like SigNoz can be highly beneficial. SigNoz is an open-source observability tool that provides end-to-end monitoring, troubleshooting, and alerting capabilities for your applications and infrastructure.
Here's how you can leverage SigNoz for monitoring Docker Compose Healthchecks:
- Create a SigNoz Cloud Account
SigNoz Cloud provides a 30-day free trial period. This demo uses SigNoz Cloud, but you can choose to use the open-source version.
- Add .env File to the Root Project Folder
In the root directory of your project folder, create a new file named .env and paste the below into it:
OTEL_COLLECTOR_ENDPOINT=ingest.{region}.signoz.cloud:443
SIGNOZ_INGESTION_KEY=***
OTEL_COLLECTOR_ENDPOINT: Specifies the address of the SigNoz collector where your application will send its telemetry data.SIGNOZ_INGESTION_KEY: Authenticates your application with the SigNoz collector.
Note: Replace {region} with your SigNoz region and SIGNOZ_INGESTION_KEY with your actual ingestion key.
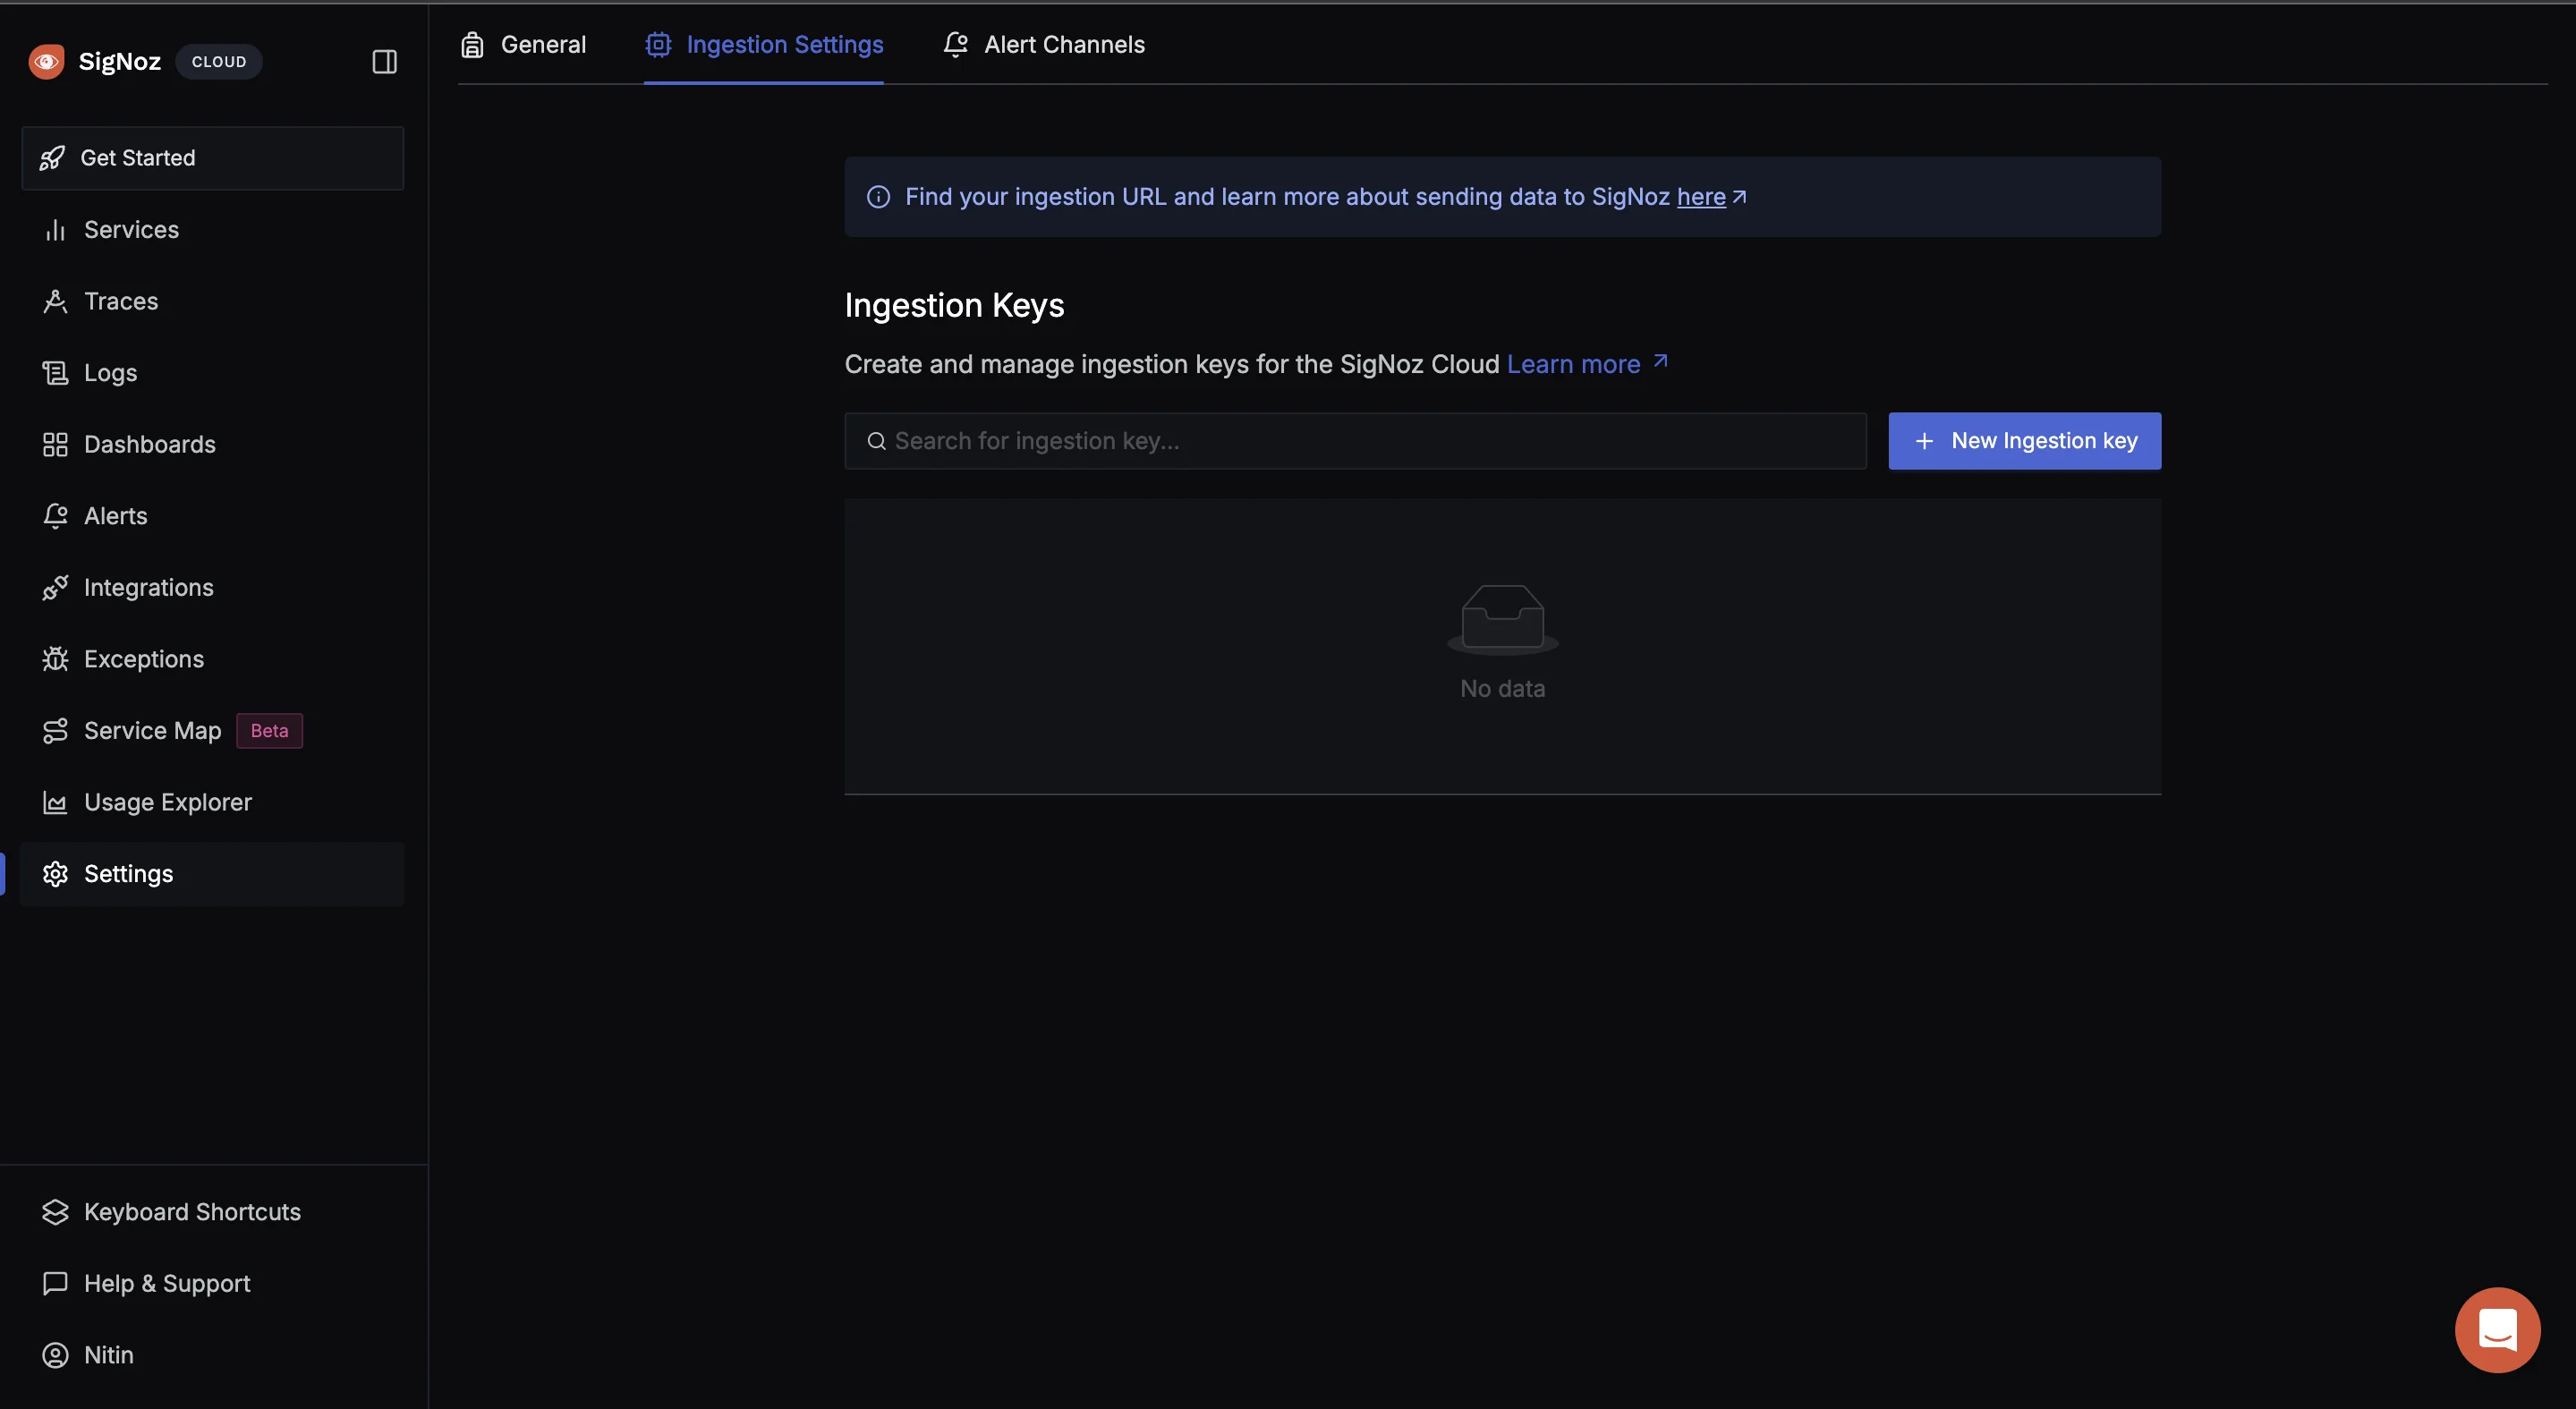
To obtain the SigNoz ingestion key and region, navigate to the “Settings” page in your SigNoz dashboard. You will find the ingestion key and region under the “Ingestion Settings” tab or if not present you can create for yourself by clicking on “New Ingestion key”.

- Set Up the OpenTelemetry Collector Config
An OTel Collector is a vendor-agnostic service that receives, processes, and exports telemetry data (metrics, logs, and traces) from various sources to various destinations.
In the root of your project folder, create a file otel-collector-config.yaml and paste the below contents in it:
receivers:
  tcplog/docker:
    listen_address: "0.0.0.0:2255"
    operators:
      - type: regex_parser
        regex: '^<([0-9]+)>[0-9]+ (?P<timestamp>[0-9]{4}-[0-9]{2}-[0-9]{2}T[0-9]{2}:[0-9]{2}:[0-9]{2}(\\.[0-9]+)?([zZ]|([\\+-])([01]\\d|2[0-3]):?([0-5]\\d)?)?) (?P<container_id>\\S+) (?P<container_name>\\S+) [0-9]+ - -( (?P<body>.*))?'
        timestamp:
          parse_from: attributes.timestamp
          layout: '%Y-%m-%dT%H:%M:%S.%LZ'
      - type: move
        from: attributes["body"]
        to: body
      - type: remove
        field: attributes.timestamp
      - type: filter
        id: signoz_logs_filter
        expr: 'attributes.container_name matches "^signoz-(logspout|frontend|alertmanager|query-service|otel-collector|otel-collector-metrics|clickhouse|zookeeper)"'

processors:
  batch:
    send_batch_size: 10000
    send_batch_max_size: 11000
    timeout: 10s

exporters:
  otlp:
    endpoint: ${env:OTEL_COLLECOTR_ENDPOINT}
    tls:
      insecure: false
    headers:
      "signoz-ingestion-key": ${env:SIGNOZ_INGESTION_KEY}

service:
  pipelines:
    logs:
      receivers: [tcplog/docker]
      processors: [batch]
      exporters: [otlp]
The above configuration sets up the OpenTelemetry Collector to listen on 0.0.0.0:2255 for incoming Docker logs over TCP and to parse and filter the logs using a regex parser. The logs are then processed in batches for optimized handling and exported securely via OTLP to the OTEL_COLLECTOR_ENDPOINT specified in your .env file.
- Add Services to the Docker Compose File
In your Docker Compose file, add the below configuration:
  otel-collector:
    image: signoz/signoz-otel-collector:${OTELCOL_TAG:-0.79.7}
    container_name: signoz-otel-collector
    command:
      [
        "--config=/etc/otel-collector-config.yaml",
        "--feature-gates=-pkg.translator.prometheus.NormalizeName"
      ]
    volumes:
      - ./otel-collector-config.yaml:/etc/otel-collector-config.yaml
    environment:
      - OTEL_RESOURCE_ATTRIBUTES=host.name=signoz-host,os.type=linux
      - DOCKER_MULTI_NODE_CLUSTER=false
      - LOW_CARDINAL_EXCEPTION_GROUPING=false
    env_file:
      - ./.env
    ports:
      - "4317:4317" # OTLP gRPC receiver
      - "4318:4318" # OTLP HTTP receiver
    restart: on-failure

  logspout:
    image: "gliderlabs/logspout:v3.2.14"
    container_name: signoz-logspout
    volumes:
      - /etc/hostname:/etc/host_hostname:ro
      - /var/run/docker.sock:/var/run/docker.sock
    command: syslog+tcp://otel-collector:2255
    depends_on:
      - otel-collector
    restart: on-failure
The above Docker Compose configuration sets up two services:
otel-collector:- Uses the Signoz OpenTelemetry Collector image.
- Mounts the
otel-collector-config.yamlfile into the container. - Uses environment variables from the
.envfile for configuration. - Exposes ports
4317(OTLP gRPC receiver) and4318(OTLP HTTP receiver).
logspout:- Uses the
gliderlabs/logspoutimage to collect logs from other Docker containers. - Forwards logs to the
otel-collectorservice on port2255. - Depends on the
otel-collectorservice, ensuring it starts first so it can forward the logs to it.
- Uses the
- Start the Docker Compose file
Run the below command in your terminal to start the containers:
docker compose up -d
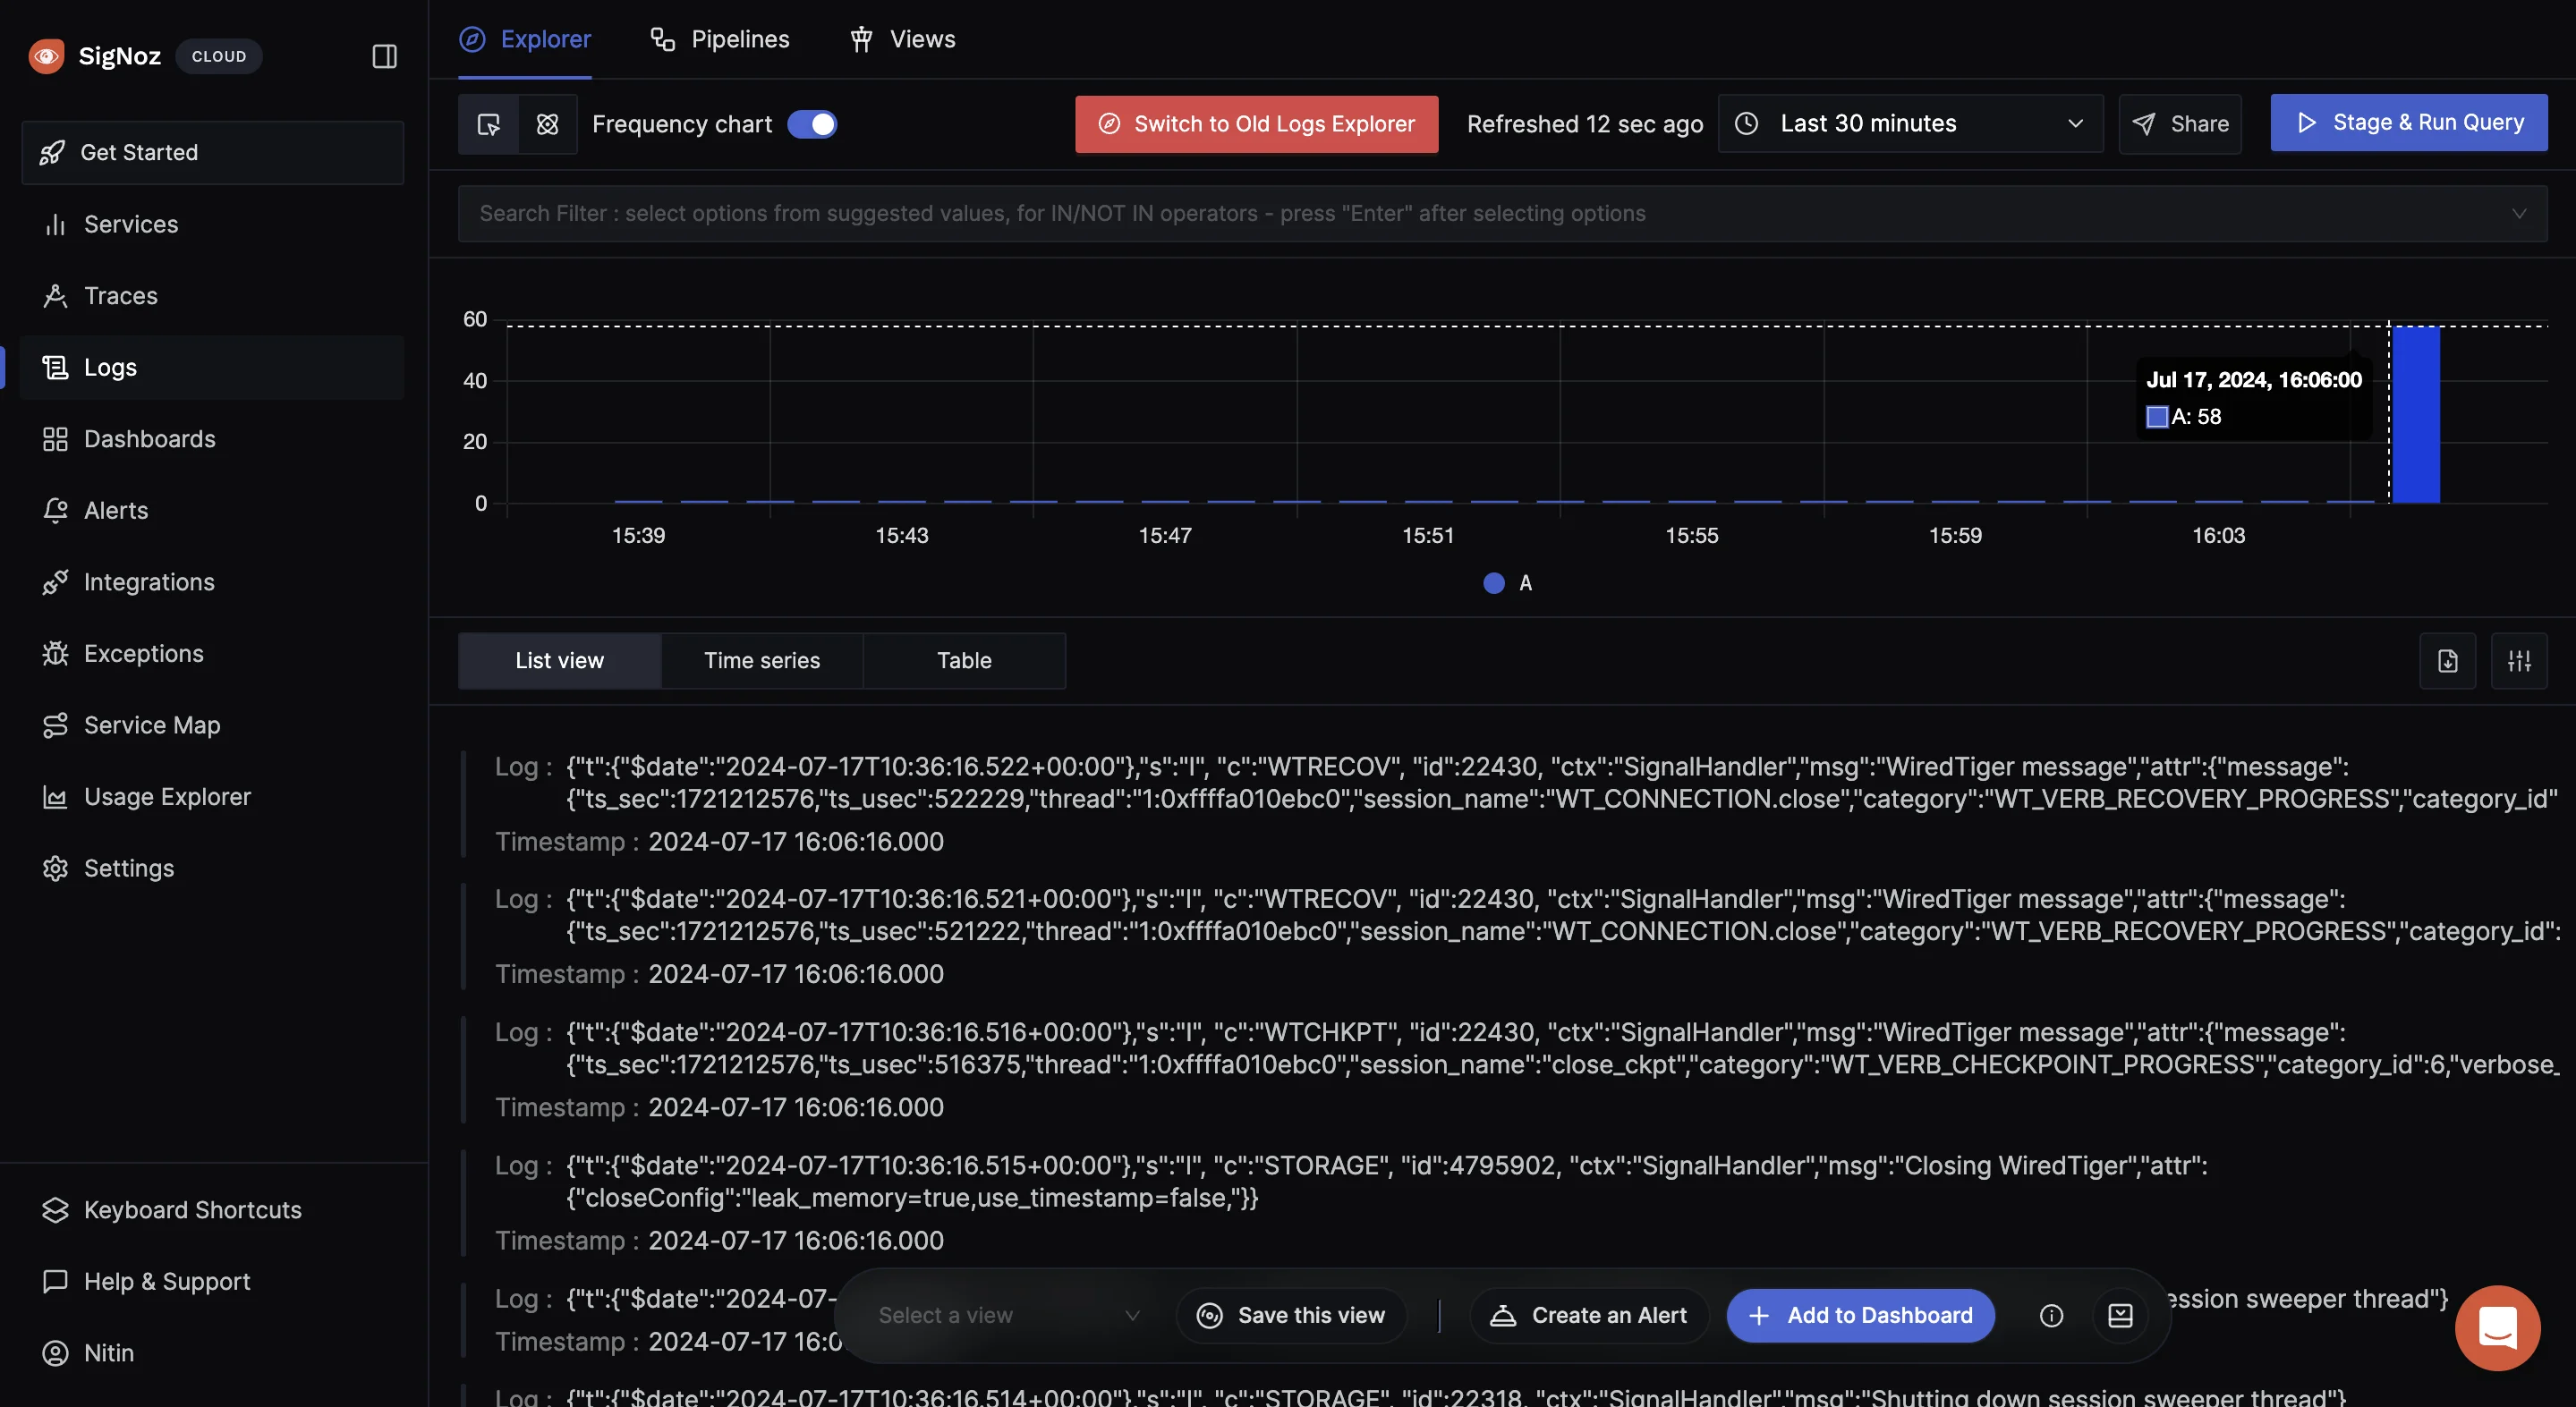
If it runs without any error, navigate to your SigNoz Cloud. Under the “Logs” tab, you should see the incoming logs.

Key Takeaways
- Healthchecks are essential for maintaining container reliability. They allow you to detect issues early, ensure services are functioning as expected, and automatically handle problems by restarting unhealthy containers.
- You can quickly check the status of your containers' healthchecks using commands like
docker inspectanddocker logs. These tools provide insights into the health of your containers and help you identify any recent issues. - When facing healthcheck failures, adjust the timing parameters like
interval,timeout, andstart_periodin yourdocker-compose.ymlfile to better suit your service’s needs. - Tailor your healthchecks in the
docker-compose.ymlfile for each service. Customize parameters such as the test command, check intervals, timeouts, and retry logic to meet the specific requirements of your application. - For a more sophisticated approach to monitoring, consider using tools like SigNoz. SigNoz can provide advanced metrics, traces, and logs, enabling you to correlate healthcheck data with overall service performance. This allows for a more holistic view of your container ecosystem and helps in identifying and resolving issues more effectively.
FAQs
How often should I run healthchecks in Docker-Compose?
The frequency of running healthchecks in Docker-Compose should be carefully calibrated based on the criticality and performance requirements of your application. For most services, setting the healthcheck interval between 30 seconds to 2 minutes is typically effective. Services that are vital to the overall operation of your application, such as databases, load balancers, or authentication services, may require more frequent healthcheck. Other services which are less critical, such as background tasks or batch systems, a longer interval (eg. 2 to 5 minutes) would be sufficient.
Can healthchecks impact container performance?
Yes, Healthchecks can indeed impact the performance of a container, particularly if they are configured to run too frequently or if the checks themselves are resource-intensive. Healthchecks that involve heavy computation, large I/O operations, or complex network requests can consume significant system resources, including CPU, memory, and network bandwidth. But, by optimizing the design and frequency of healthchecks, you can ensure that they provide valuable monitoring without negatively impacting container performance.
What's the difference between HEALTHCHECK in Dockerfile and healthcheck in docker-compose.yml?
The HEALTHCHECK instruction in a Dockerfile and the healthcheck configuration in docker-compose.yml serve similar functions but are applied at different levels. The HEALTHCHECK instruction in a Dockerfile defines a healthcheck at the image level. This means that any container created from this image will automatically include the healthcheck. The healthcheck configuration in docker-compose.yml is defined at the service level, offering greater flexibility. You can customize or override the healthcheck for each service in a specific Docker-Compose deployment, without needing to modify the underlying Docker image.
How can I implement multi-stage healthchecks for complex applications?
Implementing multi-stage healthchecks is an effective strategy for ensuring that complex applications are thoroughly monitored.
Using a script: You can create a script that runs multiple checks in sequence, with each check focusing on a different part of the application.
#!/bin/sh
if curl -f http://localhost/health/db; then
  if curl -f http://localhost/health/cache; then
    exit 0
  fi
fi
exit 1
This script first checks the database health, then the cache. If both are healthy, the script exits with a status code 0 (indicating success). If any check fails, it exits with a non-zero code (indicating failure).
Implementing different healthcheck commands: In Docker-Compose, you can define individual healthchecks for different services or components of your application.
services:
  web:
    image: myapp
    healthcheck:
      test: ["CMD", "curl", "-f", "http://localhost/health/web"]
      interval: 1m
      timeout: 10s
      retries: 3
  db:
    image: mydb
    healthcheck:
      test: ["CMD", "pg_isready"]
      interval: 30s
      timeout: 5s
      retries: 3
In this example, the
webservice is monitored by checking its web interface, while thedbservice uses a database-specific healthcheck. Each service is monitored according to its specific needs.Utilizing external health checking services: External checks can often be integrated with monitoring and alerting tools, such as SigNoz or Prometheus, allowing you to track healthcheck results over time, generate alerts on failures, and correlate healthcheck data with other application metrics.

