Prometheus is a powerful open-source monitoring tool for keeping tabs on the health and performance of your Kubernetes cluster. It can collect and analyze metrics from your cluster for understanding cluster behavior, enable proactive identification of issues, and optimize resource utilization to ensure the efficient operation of your cluster.
In this tutorial, you will learn to setup Prometheus for cluster monitoring and how to export the metrics collected to SigNoz for visualization.
In this tutorial, we will cover:
- What is Prometheus?
- How to Set Up Prometheus Monitoring on a Kubernetes Cluster
- Visualizing Metrics in SigNoz
If you want to jump straight into implementation, start with the prerequisites section.
What is Prometheus?
Prometheus is an open-source monitoring and alerting toolkit originally built at SoundCloud but currently managed under CNCF. It is a time-series database and provides efficient mechanisms to store, retrieve, and manage time-series data.
Prometheus follows a pull-based model for collecting metrics. It periodically scrapes metrics from HTTP endpoints exposed by applications or services. This approach simplifies instrumentation, as applications only need to expose a simple HTTP endpoint. It also provides real-time insights into the health and performance of the systems being monitored, enabling the identification of new targets in a system using mechanisms like K8s service discovery.
Why use Prometheus for Kubernetes monitoring?
There are many reasons why you would use Prometheus for Kubernetes monitoring:
- Open Source and Community-Driven: Prometheus is an open-source project with a large and active community. This means you have access to a wealth of resources, support, and contributions from other users and developers.
- Pull-Based Model: Prometheus's pull-based model reduces the burden on monitored applications and services. Instead of pushing metrics, Prometheus scrapes them at regular intervals, simplifying instrumentation and reducing resource usage.
- Service Discovery: Prometheus can automatically discover and monitor new services and pods in Kubernetes through its service discovery mechanisms, such as Kubernetes service discovery or through Kubernetes API.
- Scalability: Prometheus is designed to be scalable and can handle large-scale Kubernetes clusters with ease. It ensures that your monitoring system can keep up with your growing environment.
- Integration: Prometheus seamlessly integrates with various visualization tools that allow you to create intuitive and customizable dashboards to visualize your Kubernetes metrics in real-time.
- Flexible Query Language (PromQL): PromQL is a powerful query language that enables you to create complex queries and alerts based on metrics data. You can slice and dice the data in various ways to gain deep insights into your Kubernetes cluster and applications.
- Multi-Dimensional Data Model: Prometheus's multi-dimensional data model allows you to store metrics with multiple labels, making it easy to track various aspects of your system and drill down into specific components.
How to Set Up Prometheus Monitoring on a Kubernetes Cluster
In this section, we will walk through the process of setting up Prometheus to monitor your Kubernetes cluster.
Prerequistes
- A Kubernetes Cluster - Docker Desktop, Minikube, Kind, or any local cluster of choice.
- Kubectl.
- Helm installed.
- A SigNoz cloud account.
Installing Prometheus in the cluster
We will be utilizing Helm charts in installing Prometheus. Helm charts are packages of pre-configured Kubernetes resources that simplify the deployment and management of applications on Kubernetes clusters.
First, ensure your Helm repositories are updated to access the latest chart versions:
helm repo update
Check if there's an existing Prometheus Helm chart available for deployment in your cluster. You can do this by running:
helm search repo prometheus
If there isn’t any existing Prometheus Helm chart, add the Prometheus community repository to your Helm repositories:
helm repo add prometheus-community https://prometheus-community.github.io/helm-charts
You can then view the newly added charts:
helm search repo prometheus-community
From the just added prometheus-community/kube-prometheus-stack chart, install Prometheus:
helm upgrade --install prometheus prometheus-community/kube-prometheus-stack --wait
Output:
Release "prometheus" has been upgraded. Happy Helming!
NAME: prometheus
LAST DEPLOYED: Sun Jun  2 18:04:16 2024
NAMESPACE: default
STATUS: deployed
REVISION: 2
NOTES:
kube-prometheus-stack has been installed. Check its status by running:
  kubectl --namespace default get pods -l "release=prometheus"
Confirm Prometheus installation by checking the status of its pods:
kubectl get pods -n default -l "release=prometheus"
Expose Prometheus Service
Once Prometheus has been installed, the Prometheus service needs to be exposed so that we can access the Prometheus UI. To get the Prometheus service:
kubectl get svc
Output:
NAME                                      TYPE        CLUSTER-IP       EXTERNAL-IP   PORT(S)                                AGE
alertmanager-operated                     ClusterIP   None             <none>        9093/TCP,9094/TCP,9094/UDP             7d11h
kubernetes                                ClusterIP   10.96.0.1        <none>        443/TCP                                12d
my-app                                    ClusterIP   10.105.193.183   <none>        80/TCP                                 12h
my-release-k8s-infra-otel-agent           ClusterIP   10.107.139.95    <none>        13133/TCP,8888/TCP,4317/TCP,4318/TCP   9d
my-release-k8s-infra-otel-deployment      ClusterIP   10.111.50.105    <none>        13133/TCP                              9d
prometheus-grafana                        ClusterIP   10.105.238.172   <none>        80/TCP                                 7d11h
prometheus-kube-prometheus-alertmanager   ClusterIP   10.109.161.130   <none>        9093/TCP,8080/TCP                      7d11h
prometheus-kube-prometheus-operator       ClusterIP   10.100.41.68     <none>        443/TCP                                7d11h
prometheus-kube-prometheus-prometheus     ClusterIP   10.110.38.2      <none>        9090/TCP,8080/TCP                      7d11h
prometheus-kube-state-metrics             ClusterIP   10.111.229.16    <none>        8080/TCP                               7d11h
prometheus-operated                       ClusterIP   None             <none>        9090/TCP                               7d11h
prometheus-prometheus-node-exporter       ClusterIP   10.104.183.229   <none>        9100/TCP                               7d11h
The Prometheus service is prometheus-kube-prometheus-prometheus with the port 9090 .
To expose the Prometheus service:
kubectl port-forward svc/prometheus-kube-prometheus-prometheus 9090:9090 -n default
On your browser, navigate to localhost:9090 to see the Prometheus UI:

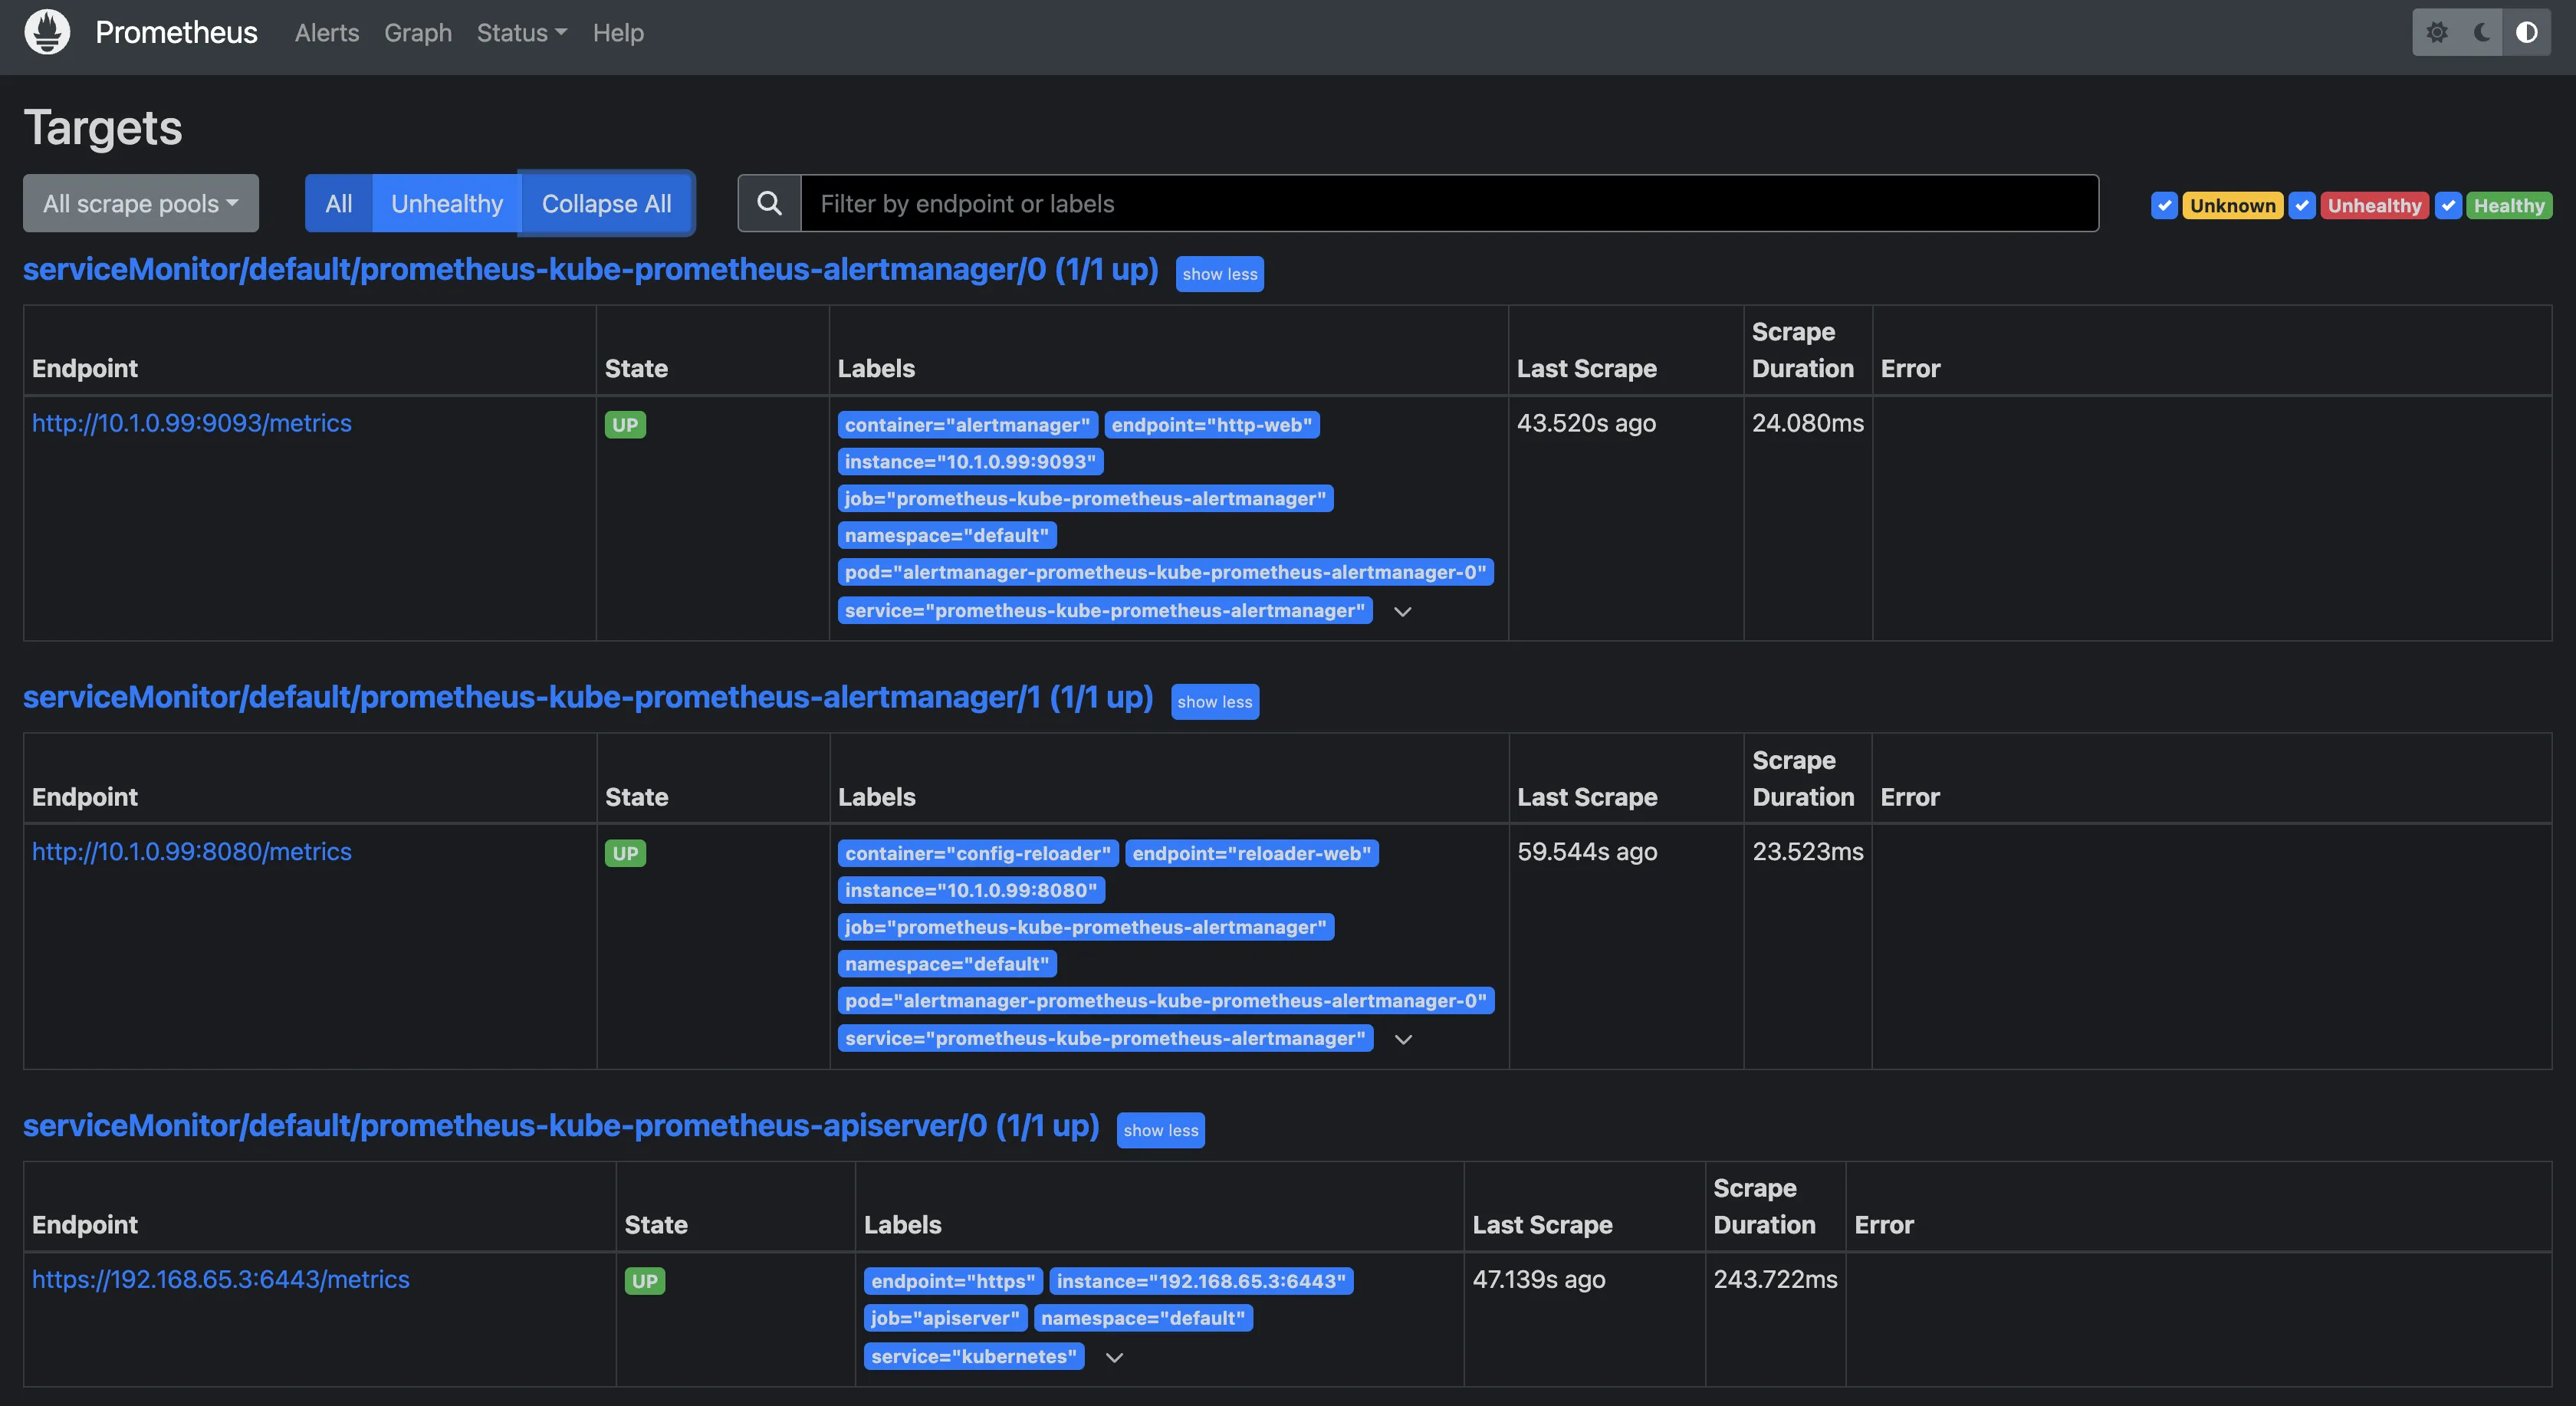
Prometheus has been configured to automatically scrape cluster metrics. To verify this, click on Status > Targets to see the Targets to see the Targets that are being monitored.
You should see a list of endpoints that Prometheus is currently scraping for metrics.

You can see all the target endpoints being monitored by Prometheus:
Configure Prometheus to Send Metrics to SigNoz
Now that Prometheus has been set up in the cluster and is scraping cluster metrics, those metrics need to be sent to a visualization tool, in this case, SigNoz. Prometheus has limited visualization capabilities so we can’t do much with the metrics it collects. With SigNoz, those metrics can be visualized, analyzed, and monitored more effectively.
Setting up SigNoz
SigNoz can be installed and self-hosted directly in your cluster. If you do not want to manage your own SigNoz instance, you can use the SigNoz cloud version, which is hosted in the cloud and managed by SigNoz. It is the easiest way to run SigNoz. For this article, we will be utilizing SigNoz cloud.
You can sign up here for a free account and get 30 days of unlimited access to all features.
Create Service Account
After your SigNoz cloud account has been set up, you can now set up cluster resources to collect metrics from Prometheus. The first will be a Service Account.
A Service Account is a special type of account that provides an identity for processes that run in a pod and enables them to authenticate to the Kubernetes API and other services. Each Service Account is associated with a set of permissions, allowing it to perform specific actions within the cluster.
Create a file named serviceaccount.yaml and paste the following YAML definition in that file:
apiVersion: v1
kind: ServiceAccount
metadata:
  name: otelcontribcol
  labels:
    app: otelcontribcol
Apply this YAML definition using:
kubectl apply -f serviceaccount.yml
Define Cluster Role
A ClusterRole defines is a set of permissions that can be applied at the cluster level, allowing the assigned entity (users, groups, or service accounts) to perform specific actions across the entire cluster or within all namespaces.
Create a file named clusterrole.yaml and paste the following YAML definition in that file:
apiVersion: rbac.authorization.k8s.io/v1
kind: ClusterRole
metadata:
  name: otelcontribcol
  labels:
    app: otelcontribcol
rules:
- apiGroups:
  - ""
  resources:
  - events
  - namespaces
  - namespaces/status
  - nodes
  - nodes/spec
  - pods
  - pods/status
  - replicationcontrollers
  - replicationcontrollers/status
  - resourcequotas
  - services
  verbs:
  - get
  - list
  - watch
- apiGroups:
  - apps
  resources:
  - daemonsets
  - deployments
  - replicasets
  - statefulsets
  verbs:
  - get
  - list
  - watch
- apiGroups:
  - extensions
  resources:
  - daemonsets
  - deployments
  - replicasets
  verbs:
  - get
  - list
  - watch
- apiGroups:
  - batch
  resources:
  - jobs
  - cronjobs
  verbs:
  - get
  - list
  - watch
- apiGroups:
    - autoscaling
  resources:
    - horizontalpodautoscalers
  verbs:
    - get
    - list
    - watch
Apply the ClusterRole definition:
kubectl apply -f clusterrole.yml
Bind Service Account to Cluster Role
Ideally, the previously created Service Account and ClusterRole are independent of each other. To establish a relationship between them and grant the Service Account the permissions defined in the Cluster Role, you need to create a ClusterRoleBinding. This is the actual link that binds a Service Account to a Cluster Role. It essentially says, "The Service Account X is allowed to do the things specified in Cluster Role Y."
Create a file named clusterrolebinding.yaml and paste the following YAML definition in that file:
apiVersion: rbac.authorization.k8s.io/v1
kind: ClusterRoleBinding
metadata:
  name: otelcontribcol
  labels:
    app: otelcontribcol
roleRef:
  apiGroup: rbac.authorization.k8s.io
  kind: ClusterRole
  name: otelcontribcol
subjects:
- kind: ServiceAccount
  name: otelcontribcol
  namespace: default
Apply the ClusterRoleBinding:
kubectl apply -f clusterrolebinding.yml
Configure the Config Map
A ConfigMap is a Kubernetes object used to store non-confidential configuration data, command-line arguments, environment variables, or any other configuration data needed by applications running in Kubernetes in key-value pairs.
Create a file named configmap.yaml and paste the following YAML definition in that file:
apiVersion: v1
kind: ConfigMap
metadata:
  name: otelcontribcol
  labels:
    app: otelcontribcol
data:
  config.yaml: |
    receivers:
      prometheus:
        config:
          scrape_configs:
            - job_name: 'prometheus'
              scrape_interval: 5s
              static_configs:
                - targets: ['prometheus-kube-prometheus-prometheus.default.svc.cluster.local:9090']

    exporters:
      otlp:
        endpoint: "ingest.{region}.signoz.cloud:443"
        tls:
          insecure: false
        timeout: 20s
        headers:
          signoz-ingestion-key: "<SigNoz Token>"

    service:
      pipelines:
        metrics:
          receivers: [prometheus]
          exporters: [otlp]
Breakdown of what this Config Map does:
- Prometheus Receiver: It's set up to collect metrics from a Prometheus instance running within your cluster (the Prometheus server deployed using the
prometheus-community/kube-prometheus-stackchart ). - OpenTelemetry (OTLP) Exporter: It's configured to send the collected metrics to an external service called SigNoz. The SigNoz access token specifies and grants access to the particular SigNoz cloud account the collected metrics should be exported to.
- Pipelines: It defines a processing pipeline to gather metrics from Prometheus and then export them using the OTLP protocol.
To get the access token for your SigNoz cloud account, go to settings > Ingestion settings. Copy and paste the ingestion key displayed in your config map file.
Also, take note of the ingestion url. There are currently 2 regions available, EU (Europe) and IN (India). Copy the region where you have your account deployed in and paste in the config map.

Apply the config map:
kubectl apply -f configmap.yml
Deploy OpenTelemetry Collector
OpenTelemetry is an open-source framework that provides APIs and SDKs for instrumenting applications to generate telemetry data. The OpenTelemetry Collector is a specific component within the OpenTelemetry ecosystem that facilitates the collection, processing, and exporting of telemetry data. It is designed to sit between the instrumentation points in your application and your observability backend (like SigNoz). The Collector receives data from various sources, process it (for example, adding tags or annotations), and then export it to one or more destinations in a standardized format.
SigNoz is built on OpenTelemetry which is why it relies on the OpenTelemetry Collector to receive metrics data collected from Prometheus. The OpenTelemetry Collector will be deployed in the cluster as a Deployment.
Create a file named deployment.yaml and paste the following YAML definition in that file:
apiVersion: apps/v1
kind: Deployment
metadata:
  name: otelcontribcol
  labels:
    app: otelcontribcol
spec:
  replicas: 1
  selector:
    matchLabels:
      app: otelcontribcol
  template:
    metadata:
      labels:
        app: otelcontribcol
    spec:
      serviceAccountName: otelcontribcol
      containers:
      - name: otelcontribcol
        image: otel/opentelemetry-collector-contrib
        args: ["--config", "/etc/config/config.yaml"]
        volumeMounts:
        - name: config
          mountPath: /etc/config
        imagePullPolicy: IfNotPresent
      volumes:
        - name: config
          configMap:
            name: otelcontribcol
The above Deployment runs a single replica (pod) of the OpenTelemetry Collector Contrib using the assigned Service Account. The Service Account's permissions as defined earlier in the ClusterRole config determine what actions the pod can perform (including reading the ConfigMap). The Deployment mounts the "otelcontribcol" ConfigMap into the pod as a volume, making the configuration file available to the OpenTelemetry Collector. The Collector uses the configuration file to guide its data collection, processing, and exporting activities.
kubectl apply -f deployment.yml
Verify that the OpenTelemetry Collector is receiving metrics data:
kubectl get pods
Identify the otelcontribcol pod, copy the name and check the logs:
kubectl logs <pod-name>
Expected output:
2024-06-11T00:58:04.082Z        info    service@v0.101.0/service.go:102 Setting up own telemetry...
2024-06-11T00:58:04.082Z        info    service@v0.101.0/telemetry.go:103       Serving metrics {"address": ":8888", "level": "Normal"}
2024-06-11T00:58:04.096Z        info    service@v0.101.0/service.go:169 Starting otelcol-contrib...     {"Version": "0.101.0", "NumCPU": 8}
2024-06-11T00:58:04.096Z        info    extensions/extensions.go:34     Starting extensions...
2024-06-11T00:58:04.104Z        info    prometheusreceiver@v0.101.0/metrics_receiver.go:275     Starting discovery manager      {"kind": "receiver", "name": "prometheus", "data_type": "metrics"}
2024-06-11T00:58:04.107Z        info    prometheusreceiver@v0.101.0/metrics_receiver.go:253     Scrape job added        {"kind": "receiver", "name": "prometheus", "data_type": "metrics", "jobName": "prometheus"}
2024-06-11T00:58:04.107Z        info    prometheusreceiver@v0.101.0/metrics_receiver.go:253     Scrape job added        {"kind": "receiver", "name": "prometheus", "data_type": "metrics", "jobName": "kube-state-metrics"}
2024-06-11T00:58:04.110Z        info    service@v0.101.0/service.go:195 Everything is ready. Begin running and processing data.
2024-06-11T00:58:04.110Z        warn    localhostgate/featuregate.go:63 The default endpoints for all servers in components will change to use localhost instead of 0.0.0.0 in a future version. Use the feature gate to preview the new default.        {"feature gate ID": "component.UseLocalHostAsDefaultHost"}
2024-06-11T00:58:04.111Z        info    prometheusreceiver@v0.101.0/metrics_receiver.go:340     Starting scrape manager {"kind": "receiver", "name": "prometheus", "data_type": "metrics"}
Visualizing Metrics in SigNoz
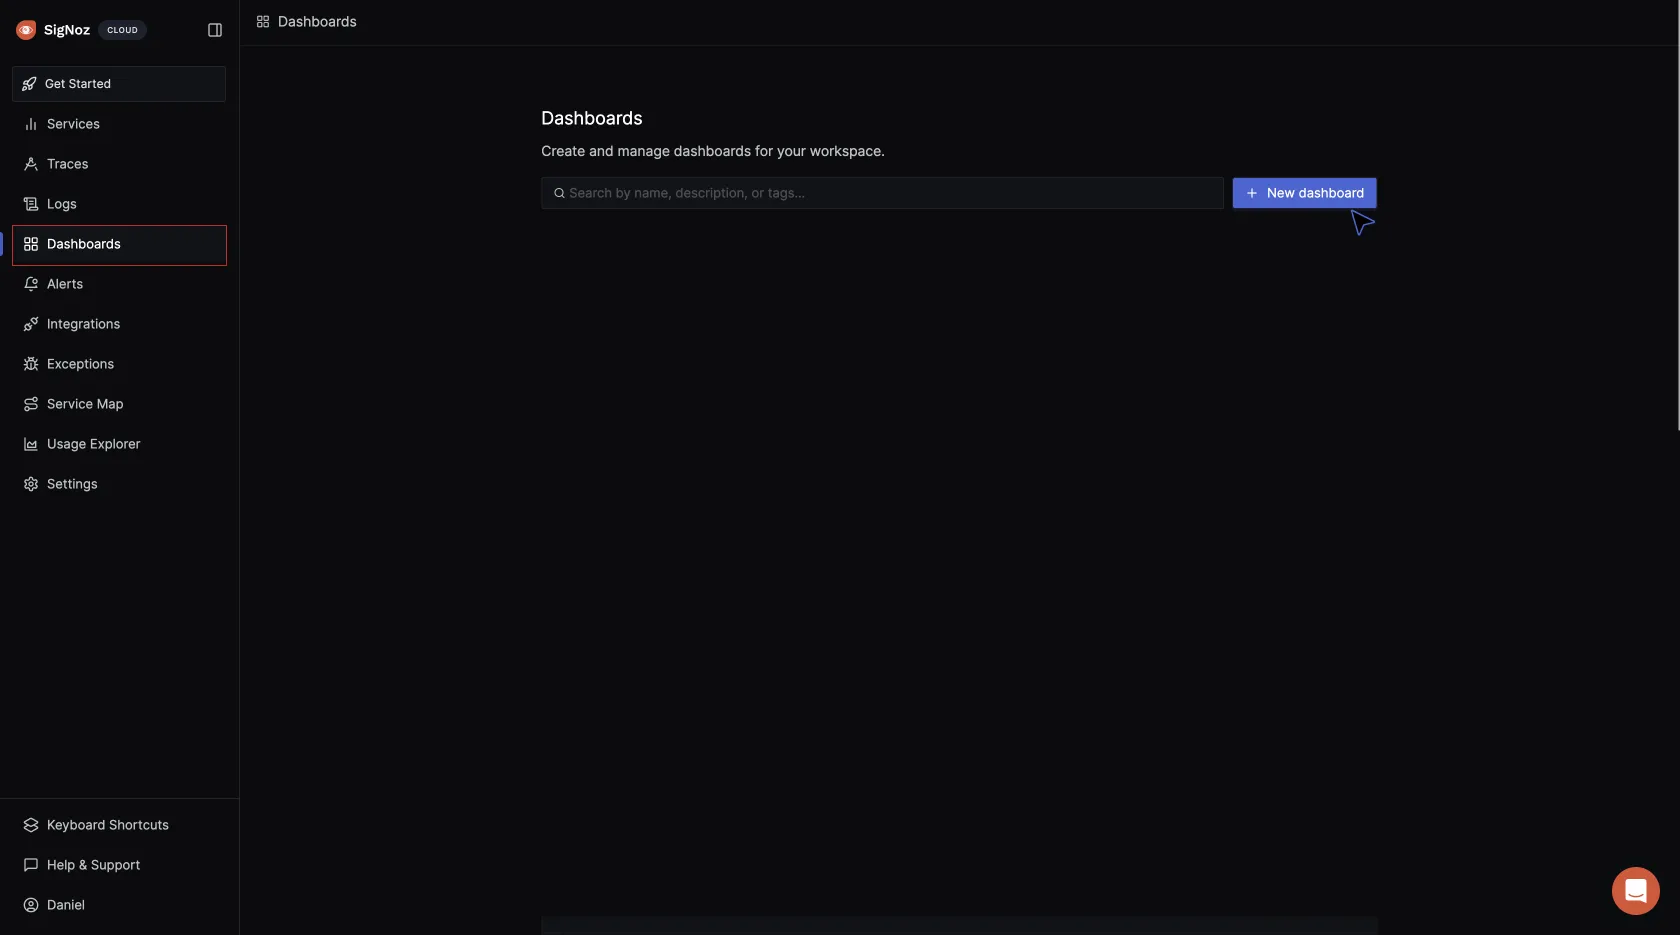
To visualize the metrics being sent to SigNoz, navigate to your SigNoz cloud account. Click on Dashboards > New dashboard:
Click on Configure your new dashboard:
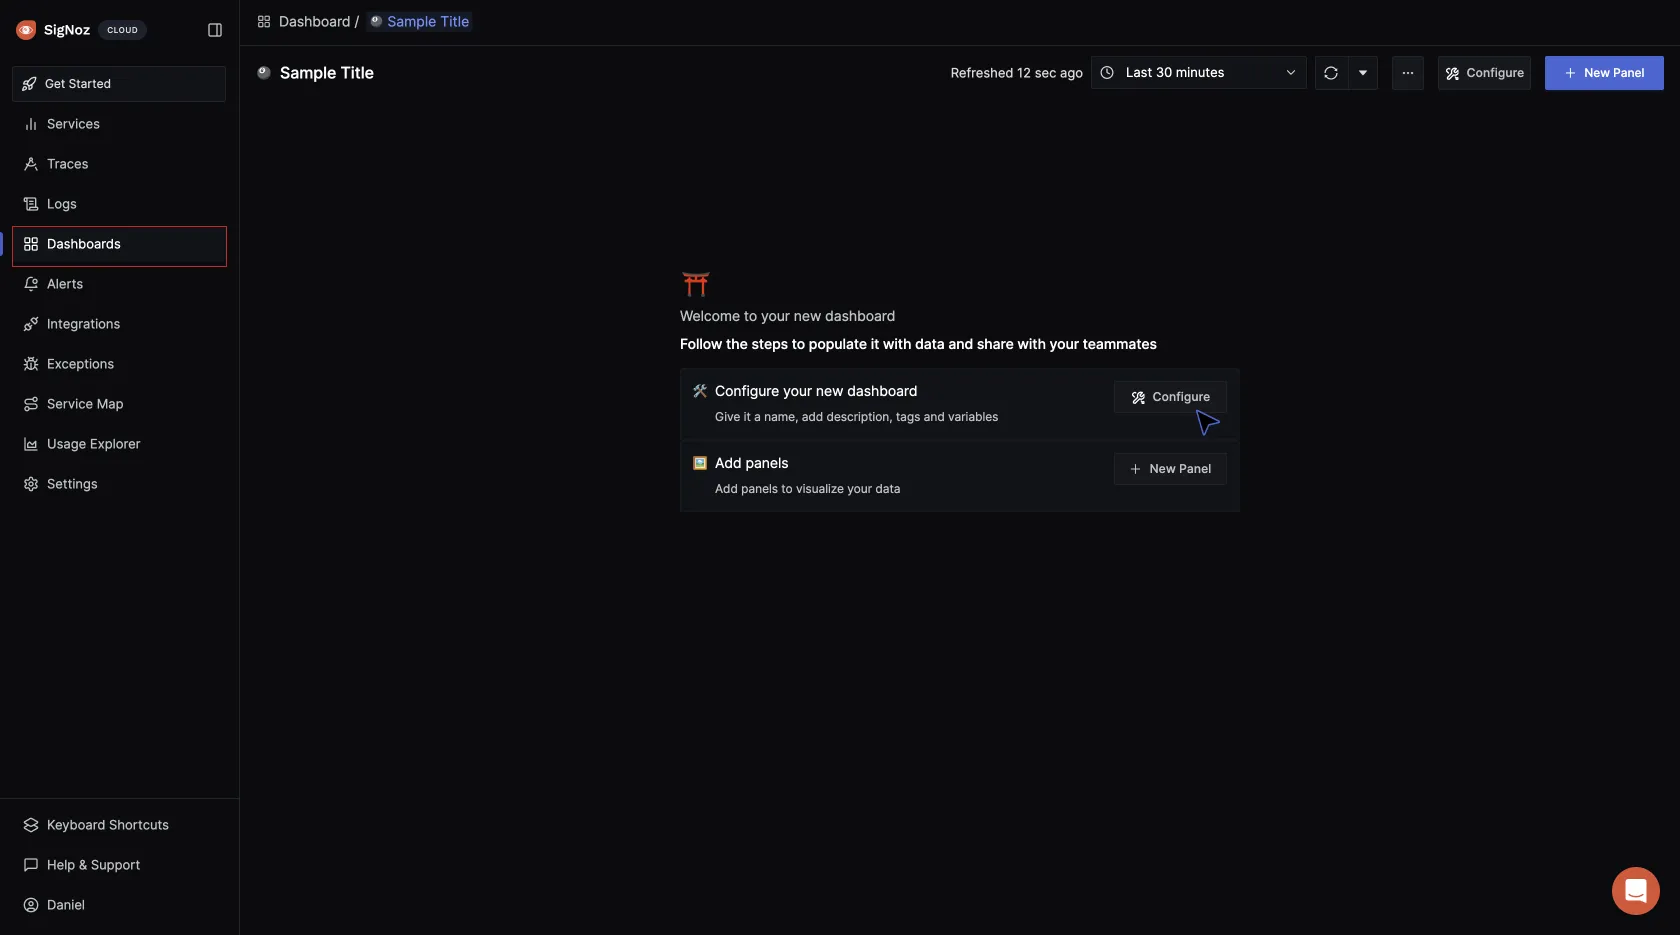
Give the dashboard a name, description, and tag (optional), then save it.
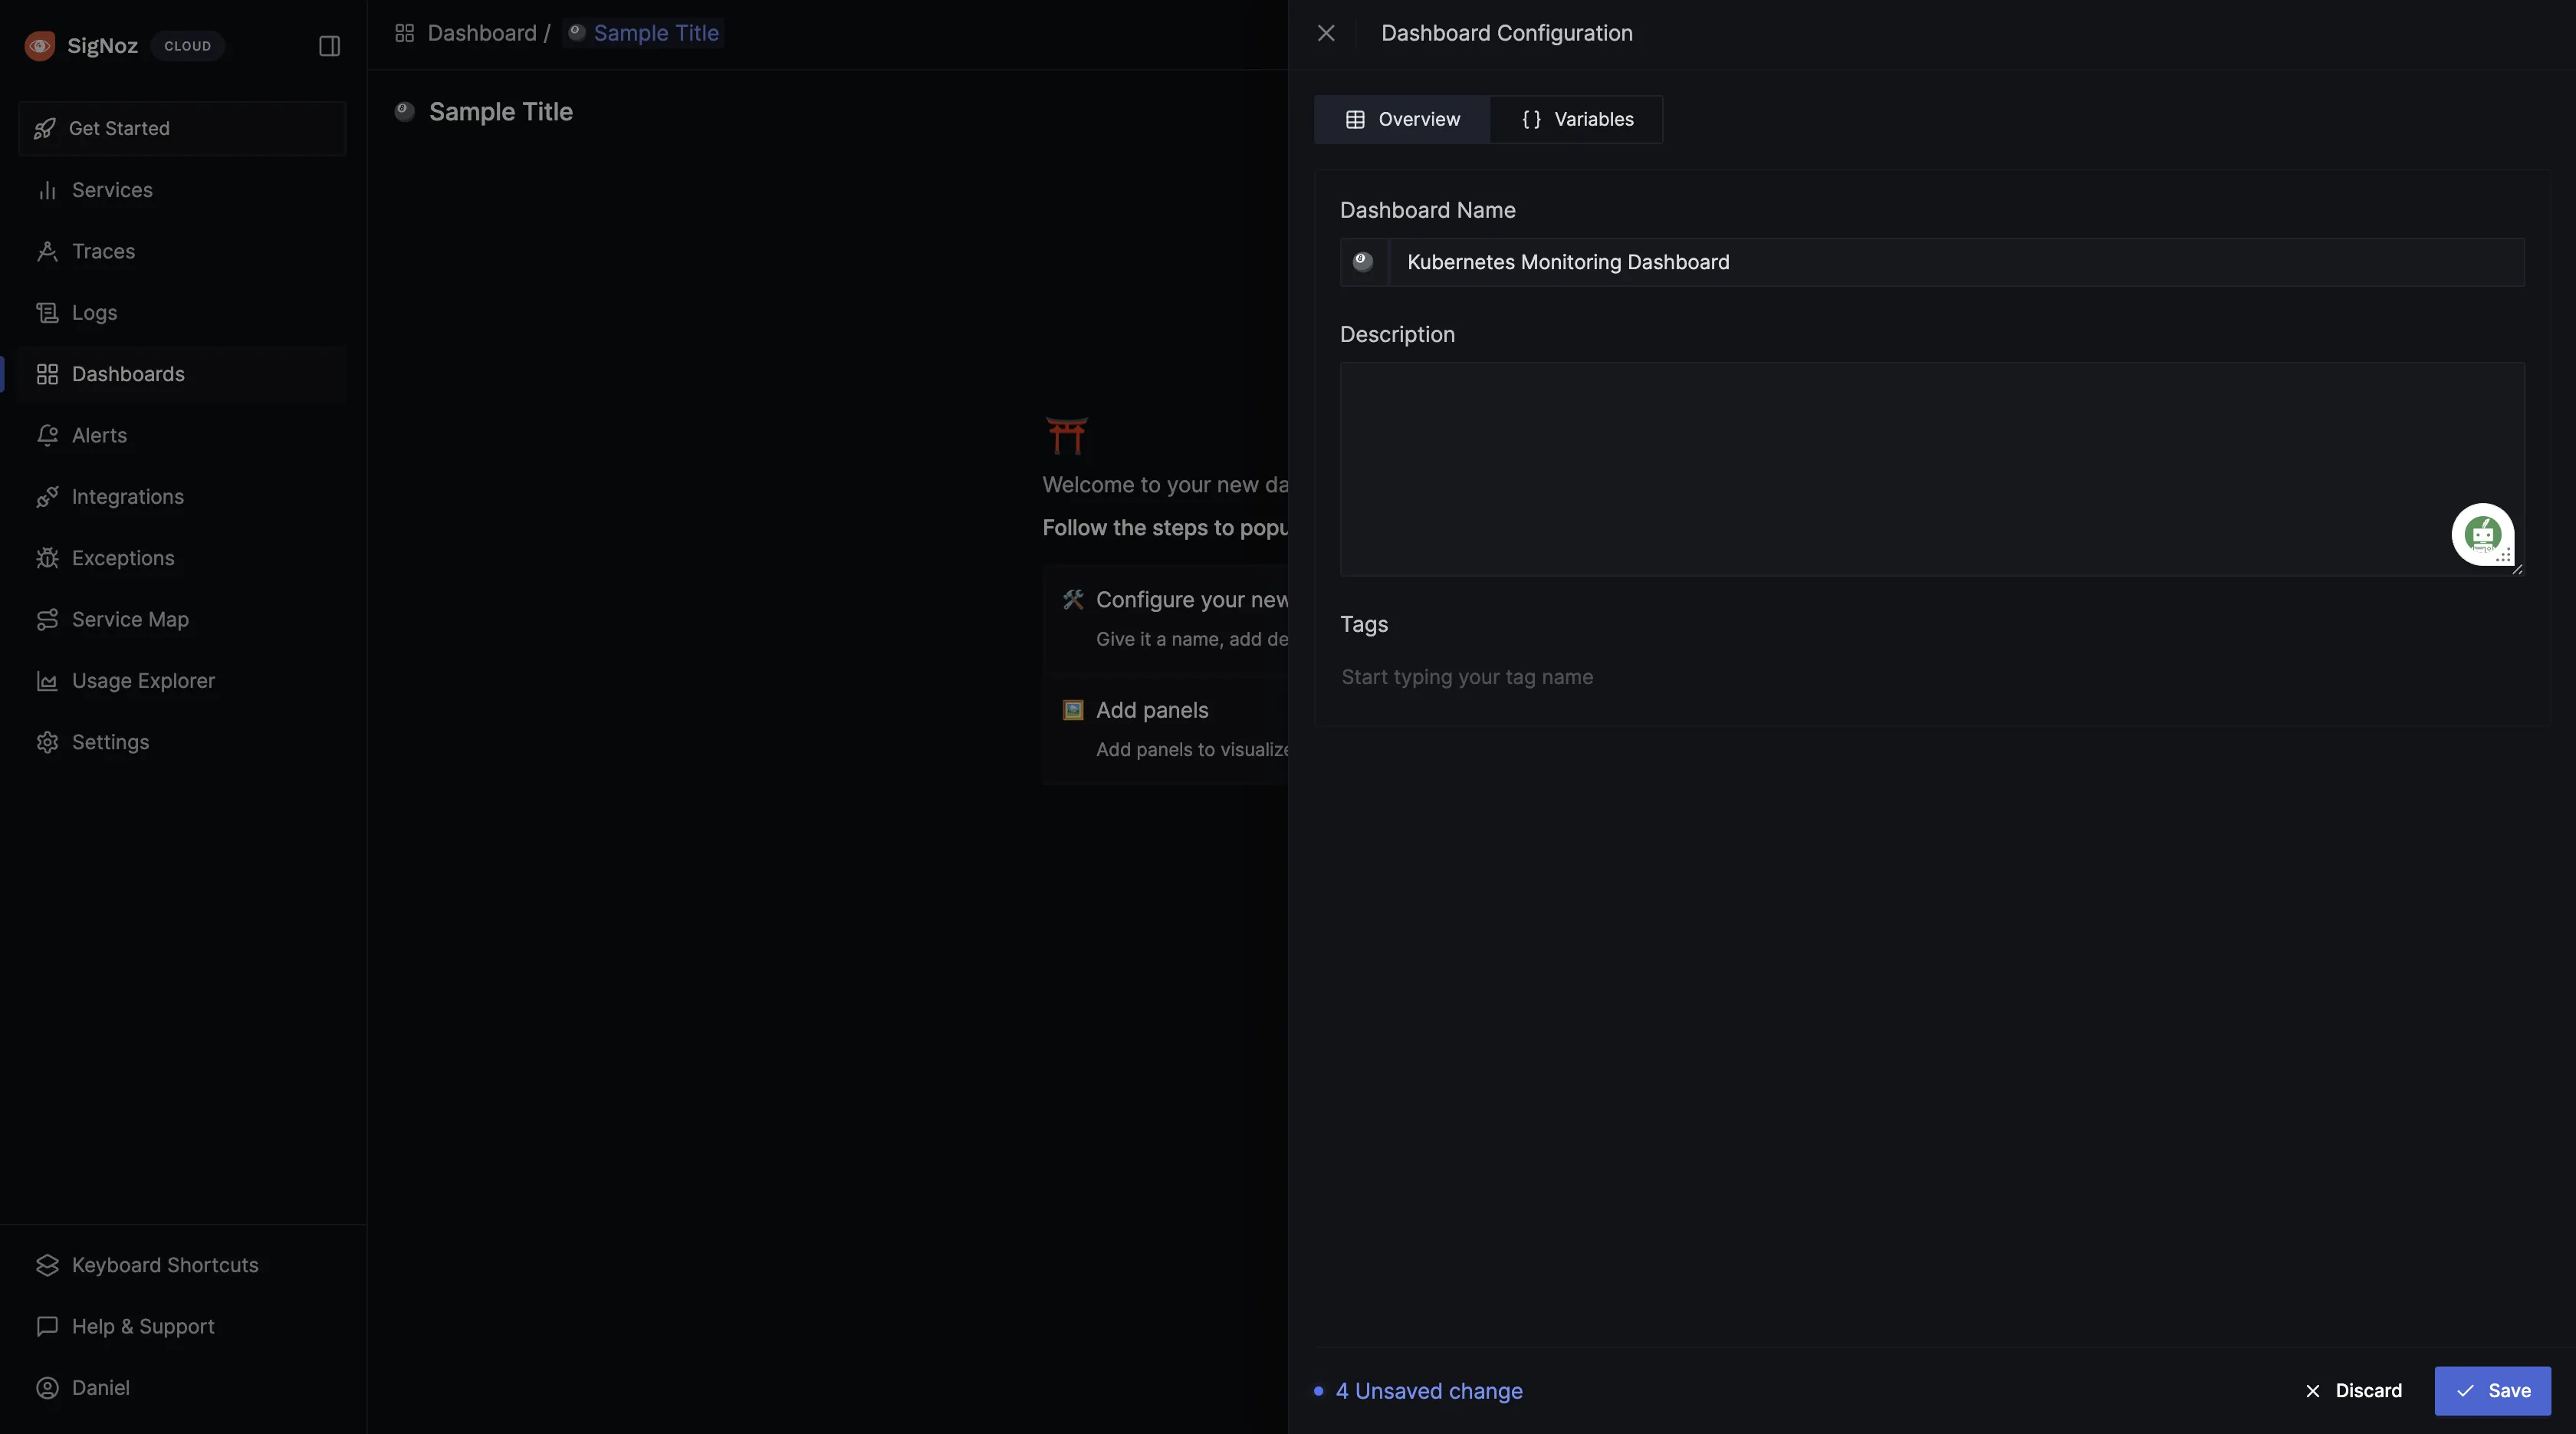
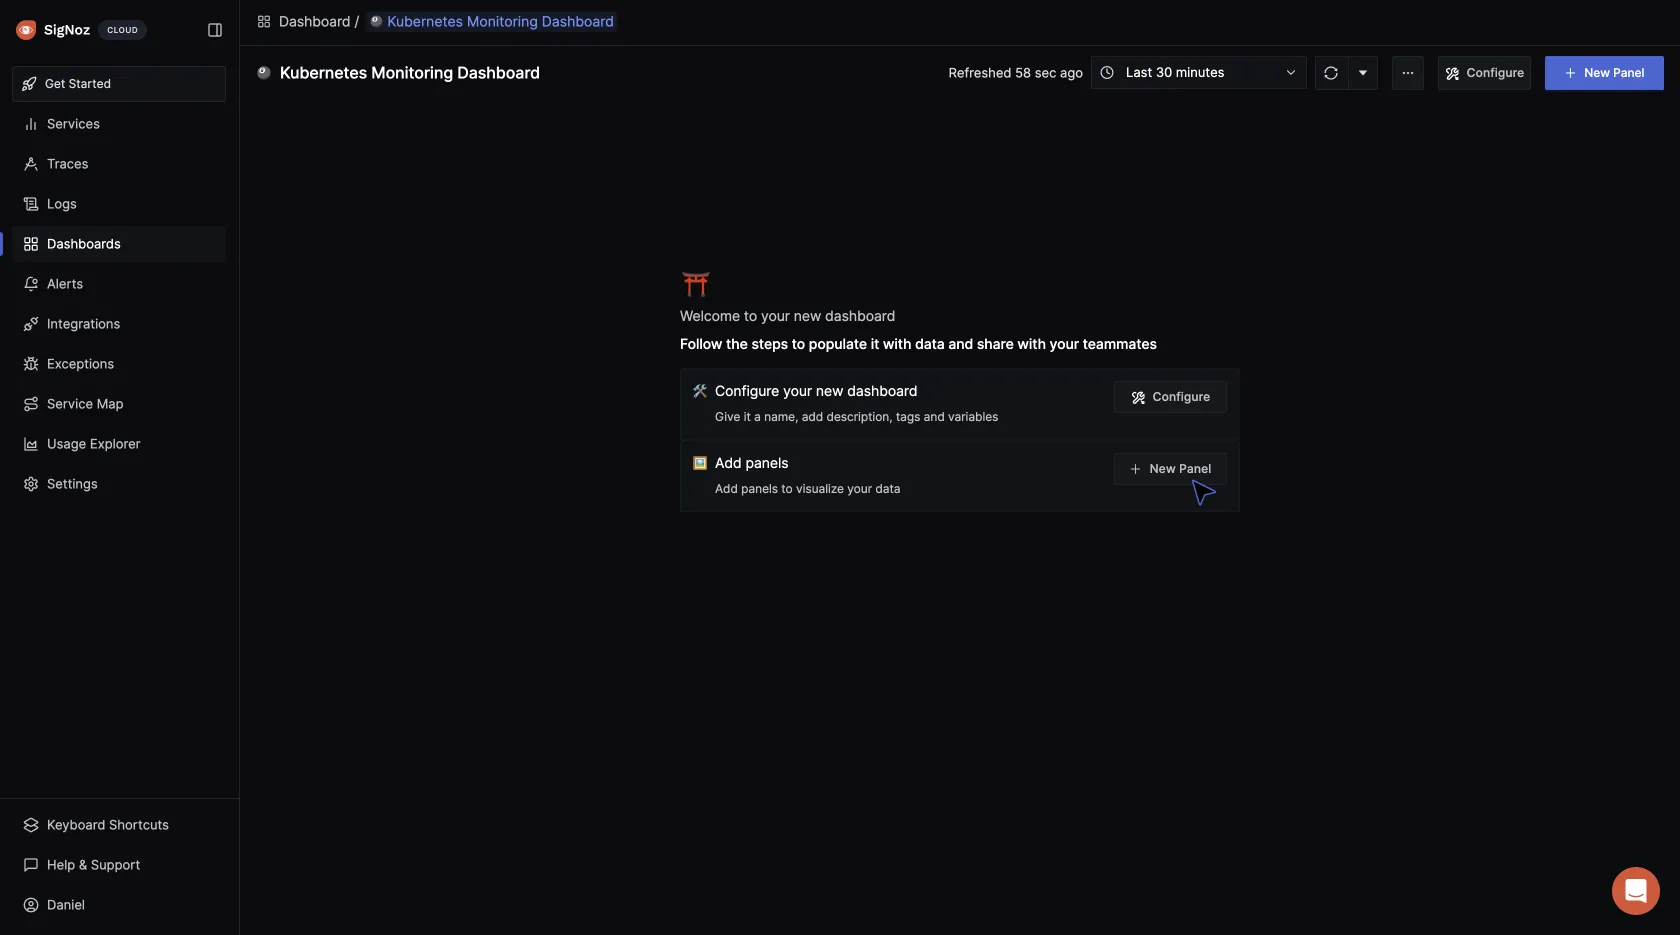
After the dashboard has been created, panels can be set up. Click on Add Panels > New Panel, to start creating visualizations in the dashboard:
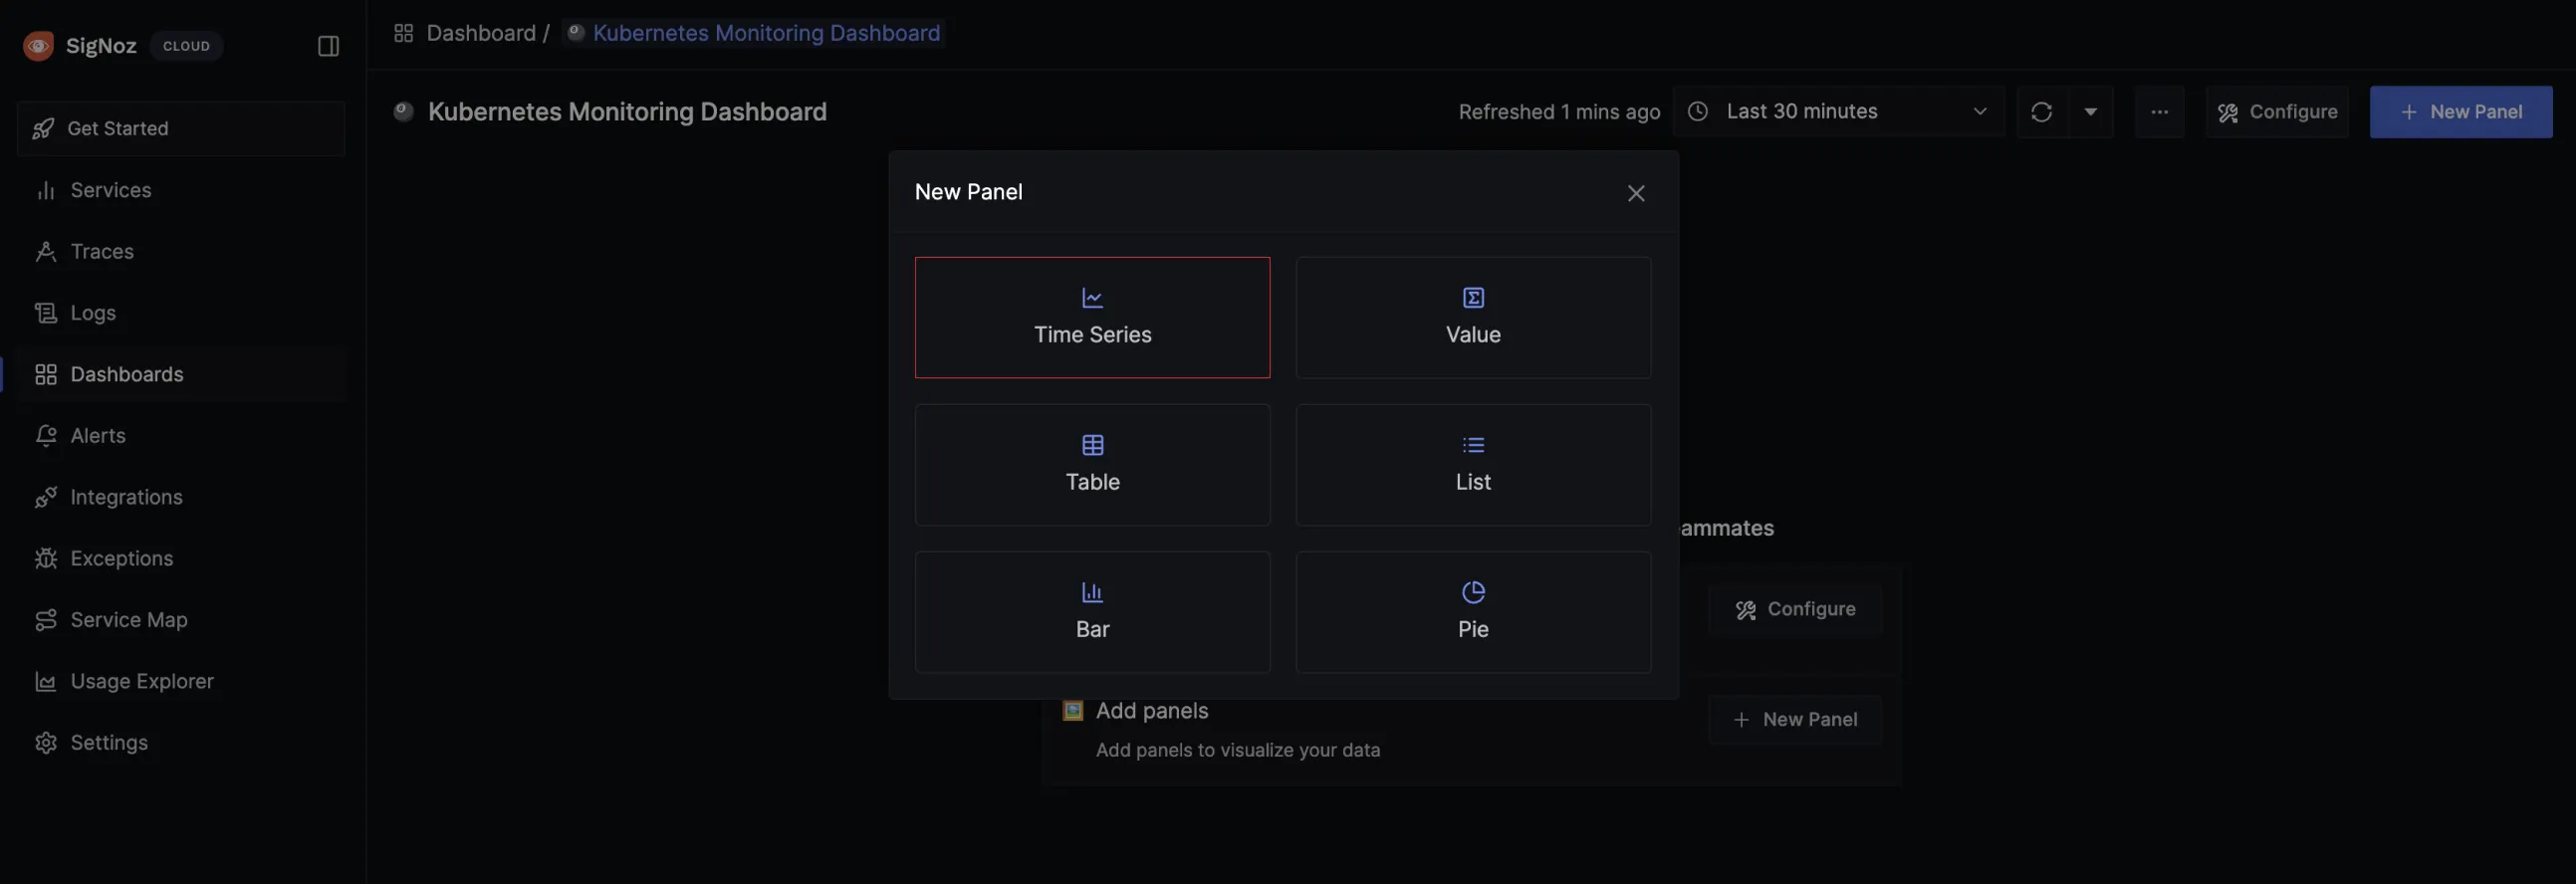
For the visualization option, select “Time Series”:
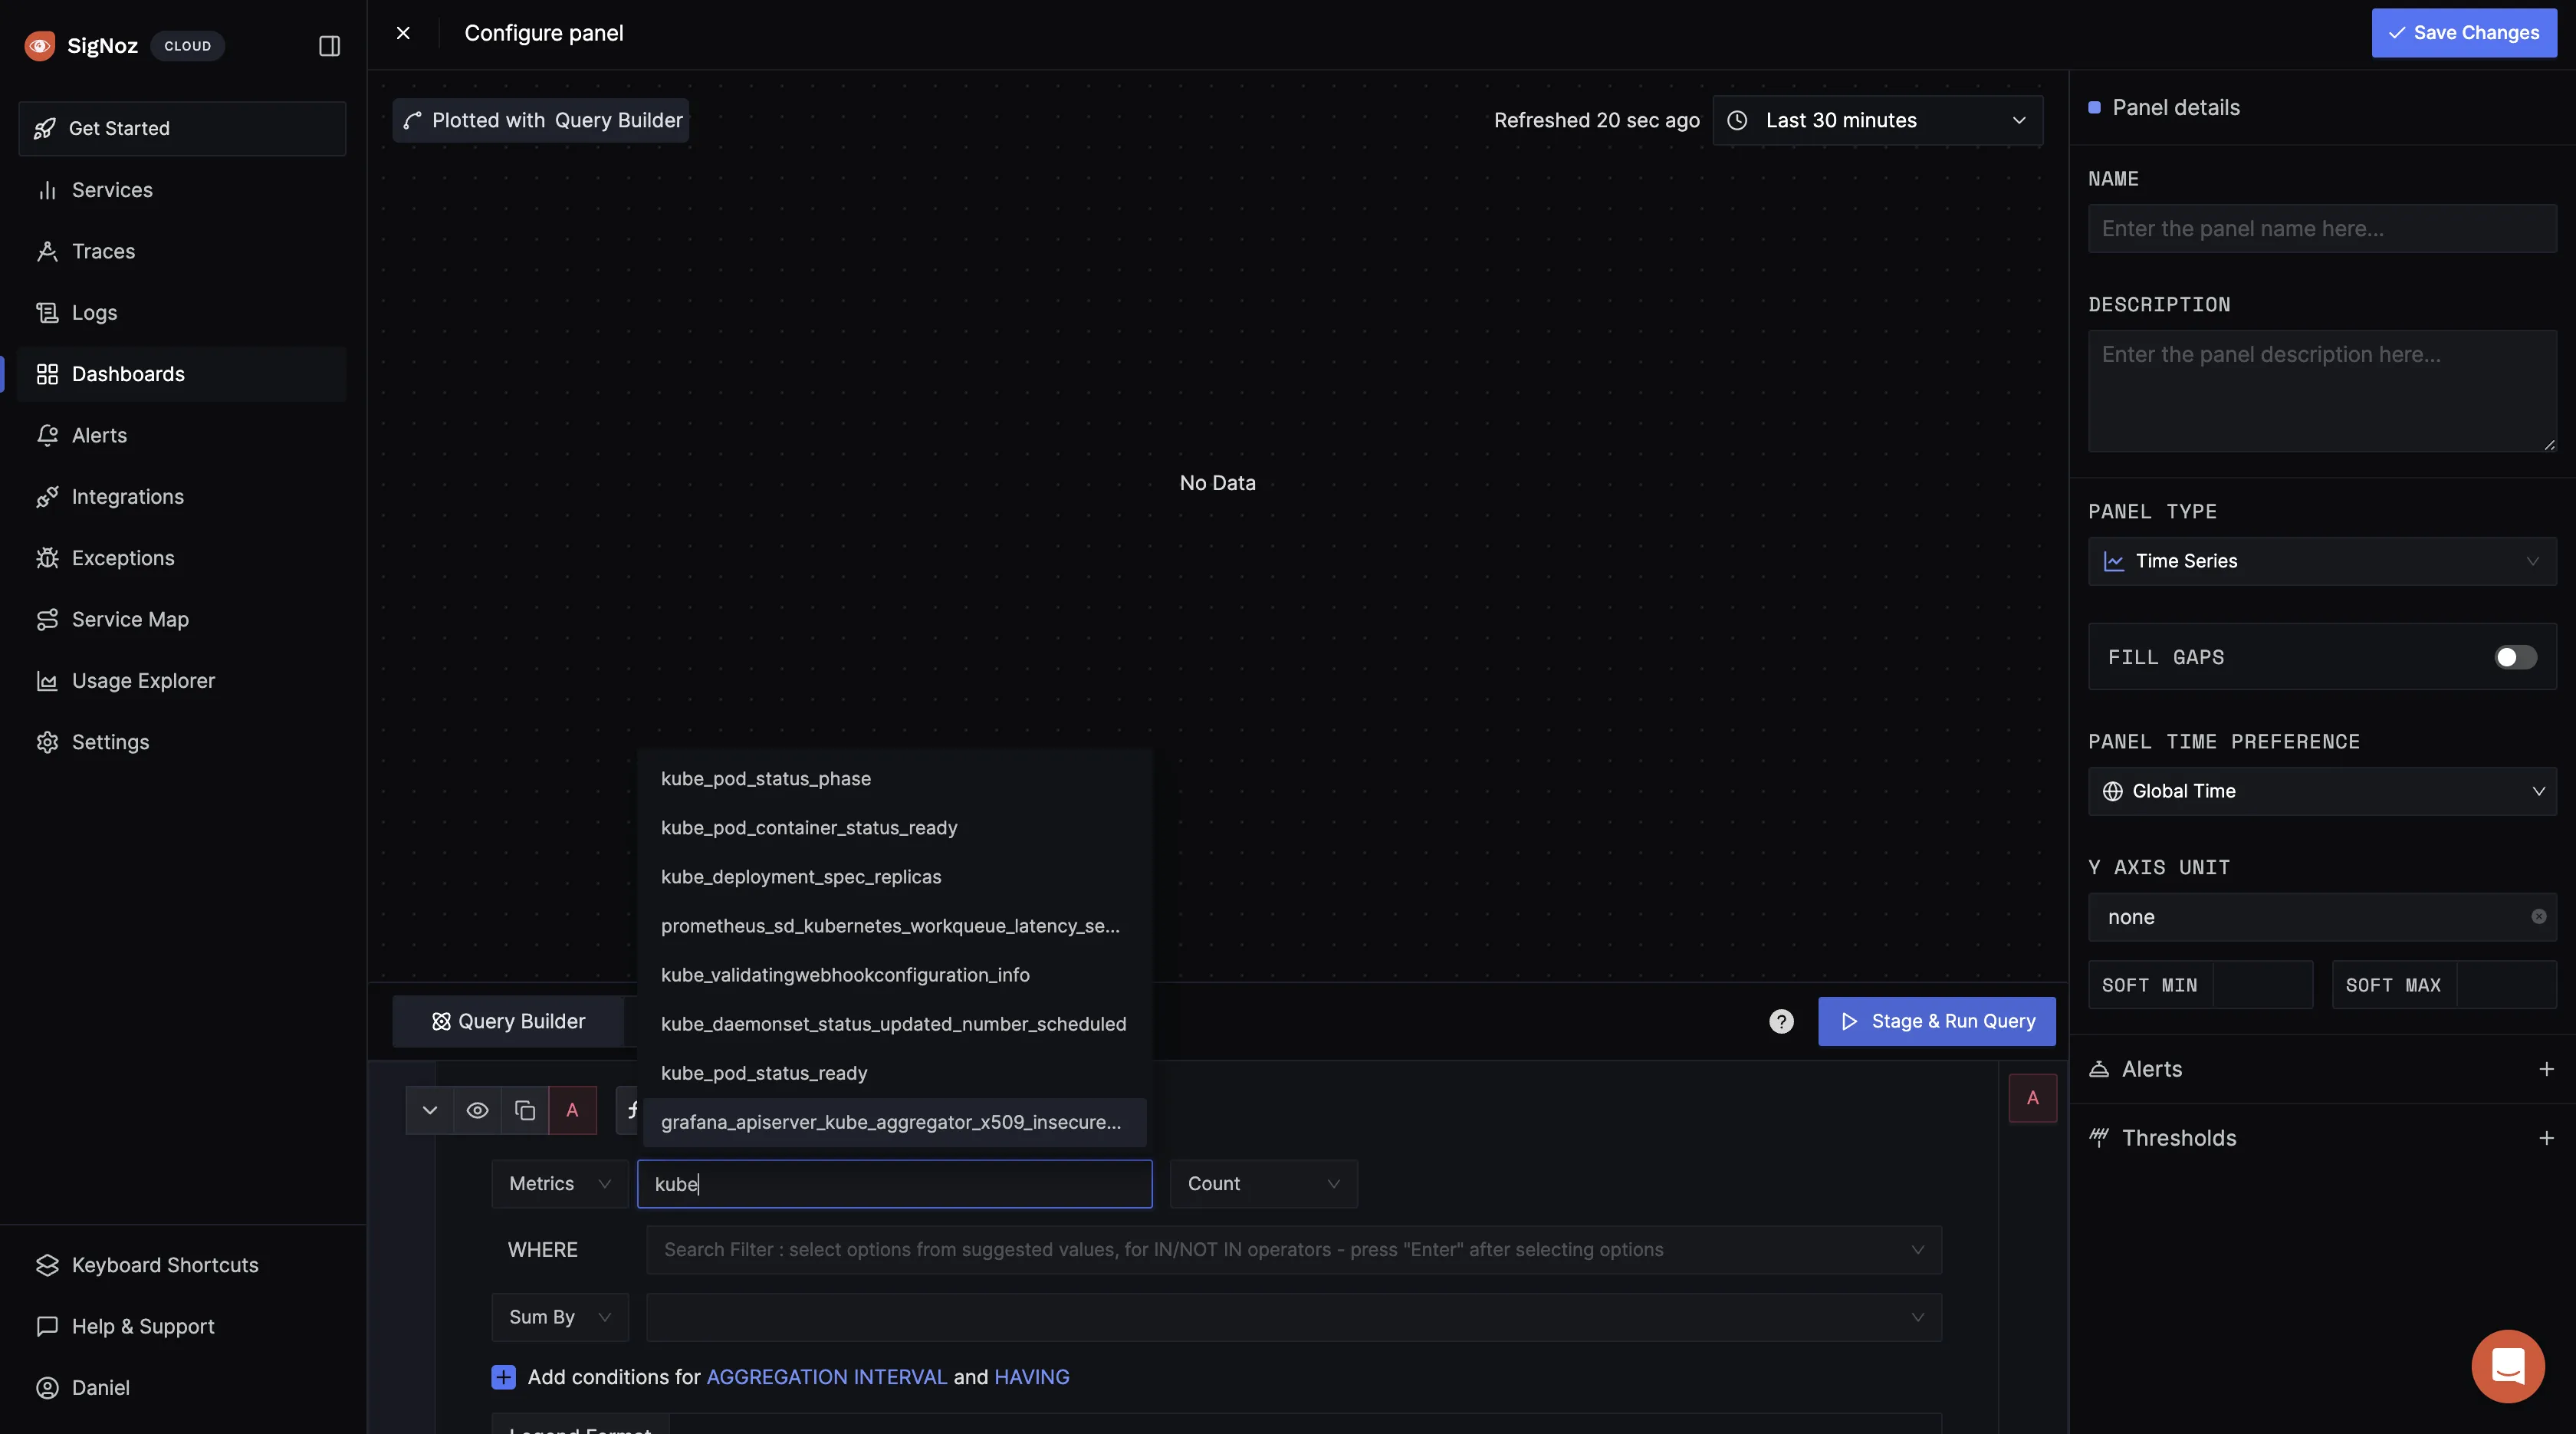
You will be redirected to the query builder where you can run different queries against the metrics coming in using the time series visualization.
In the query builder, type in “kube” to see Kubernetes metrics being exported to SigNoz:
For your first metrics query, type
kube_pod_container_status_running then click on the stage and run query button: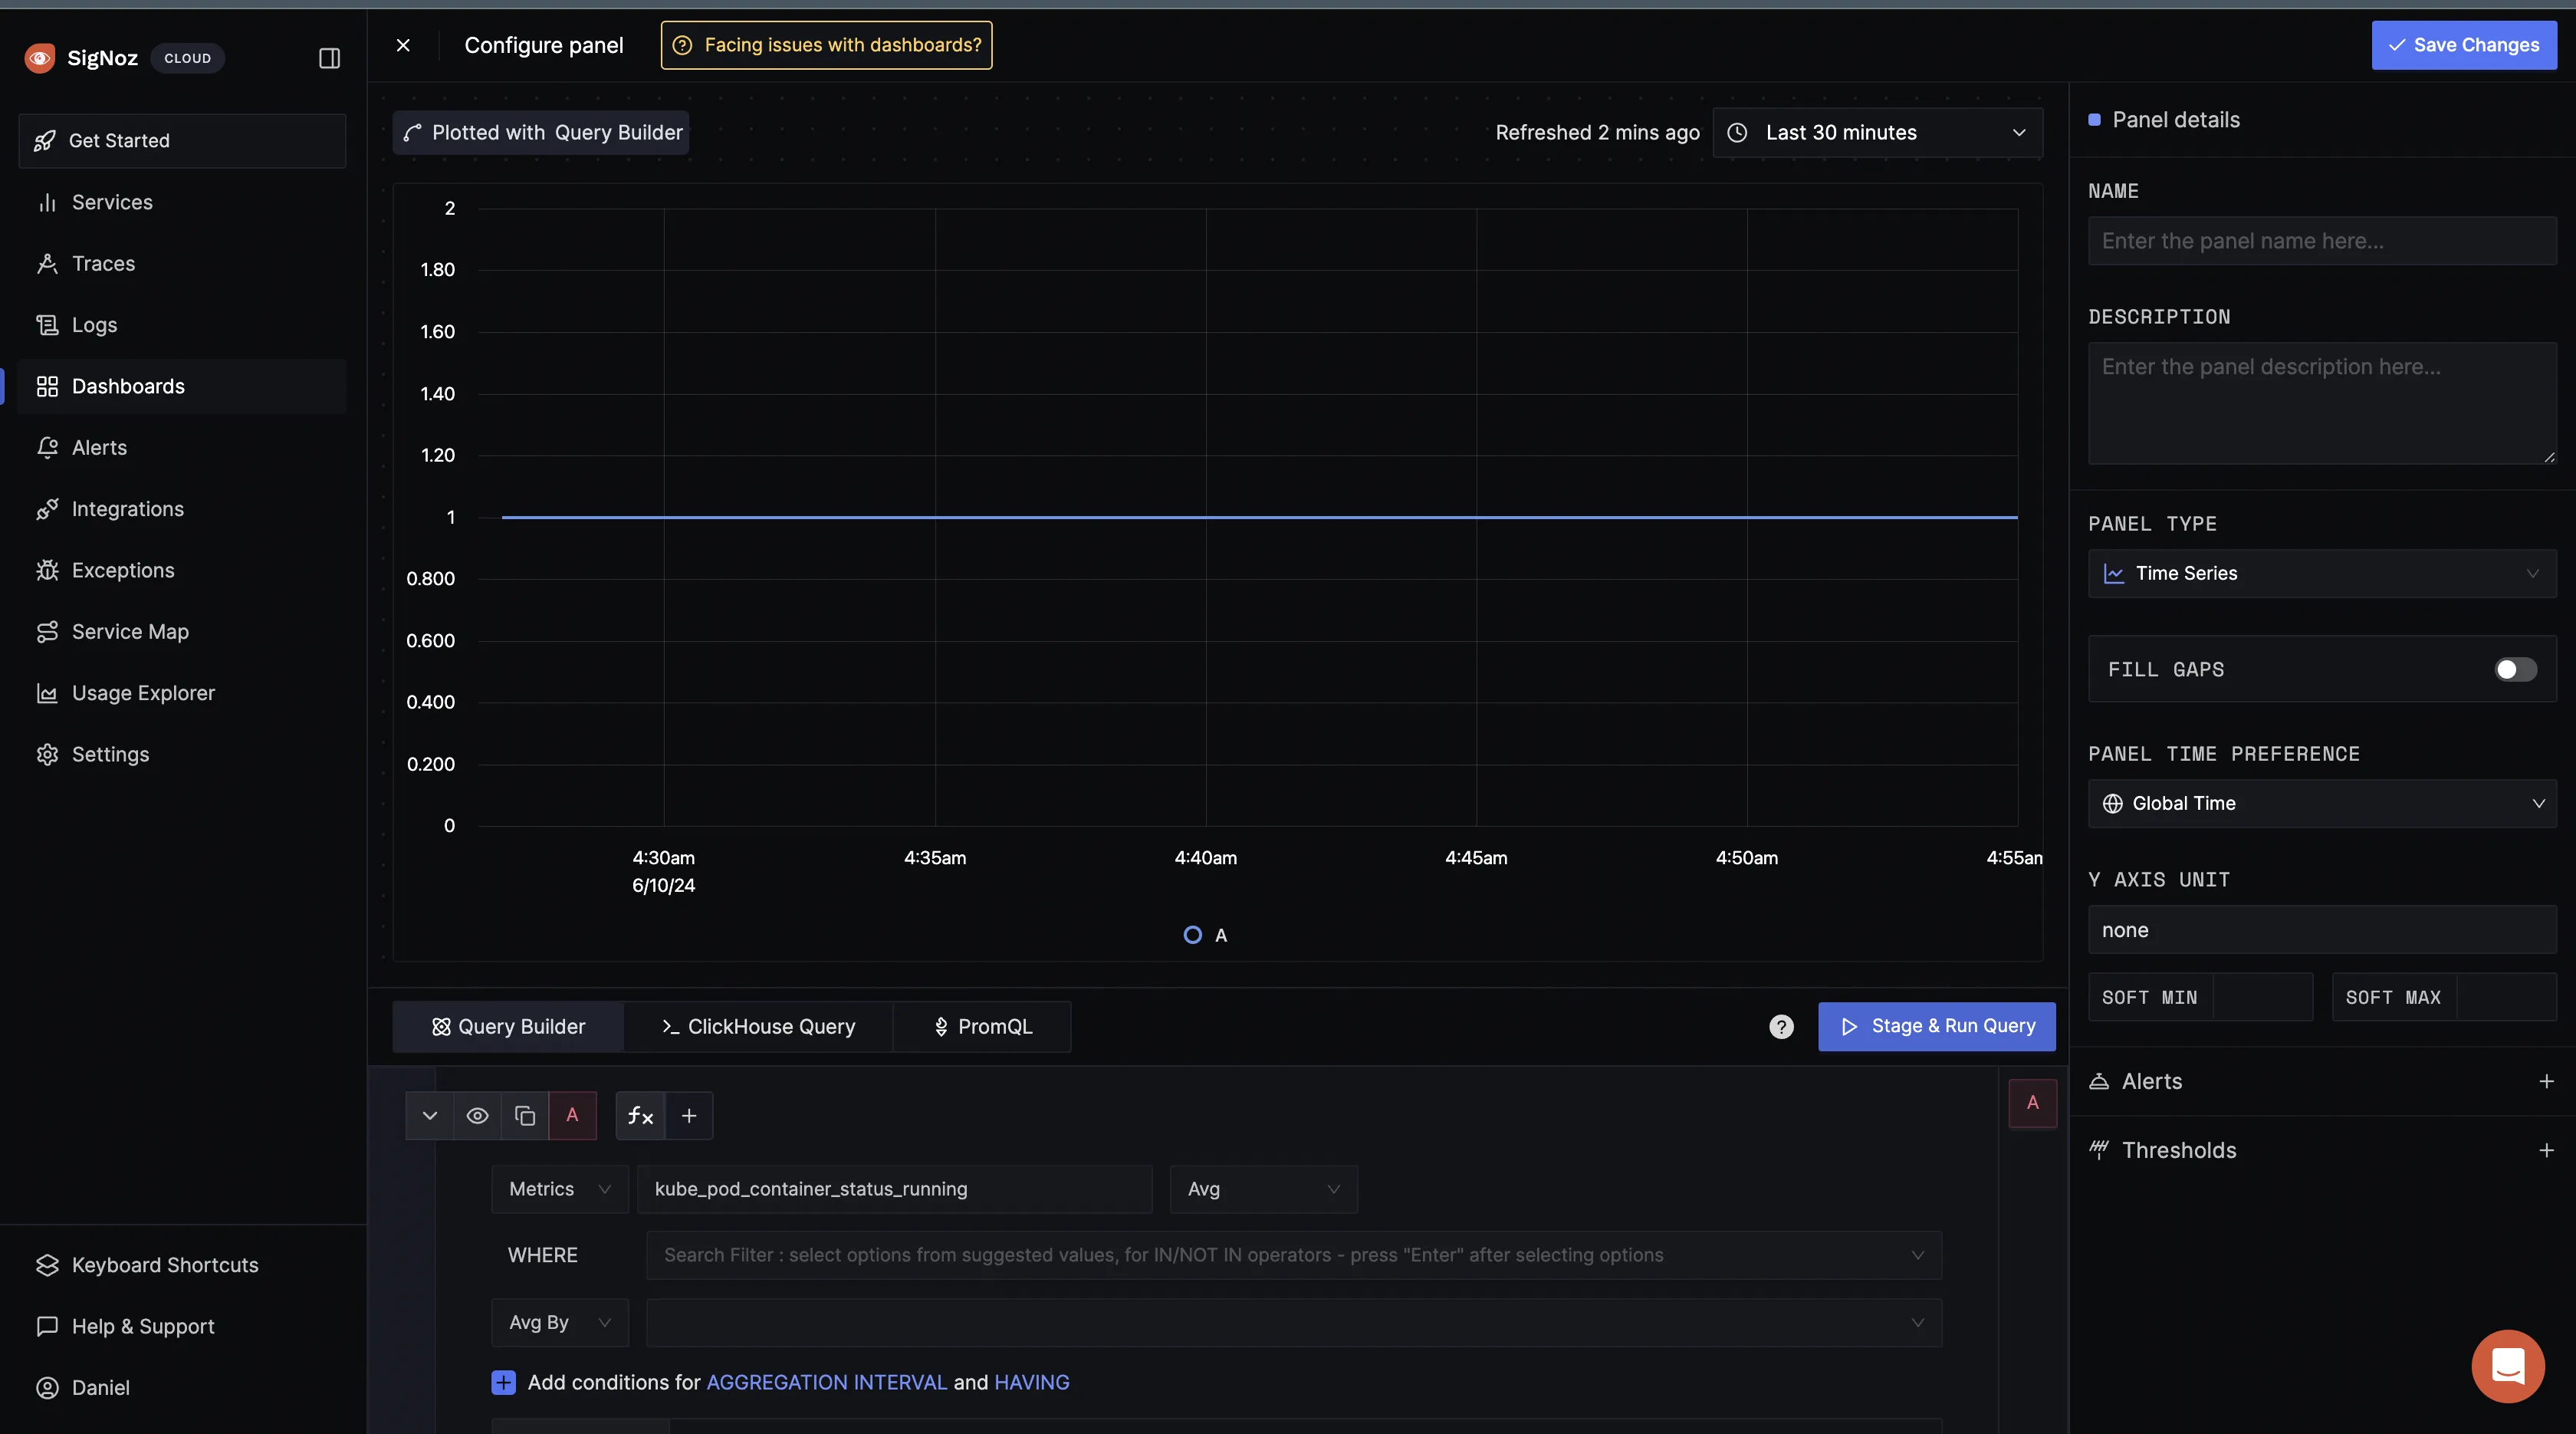
The
kube_pod_container_status_running metric is a Prometheus metric exposed by the kube-state-metrics service. This metric indicates whether containers within pods in your Kubernetes cluster is currently in a running state. It's a gauge metric, meaning it represents a value at a particular point in time.When you get a value of 1 for the kube_pod_container_status_running metric in Prometheus as shown above, it typically means that the condition "running" is met for the containers being monitored. In other words, all the containers targeted by the query are currently in the "running" state within their respective pods.
For this kind of metric, you can also decide to use the “value” visualization in place of the time series.
Give the panel a name and description, then select Save Changes. The panel will be automatically saved in your dashboard:
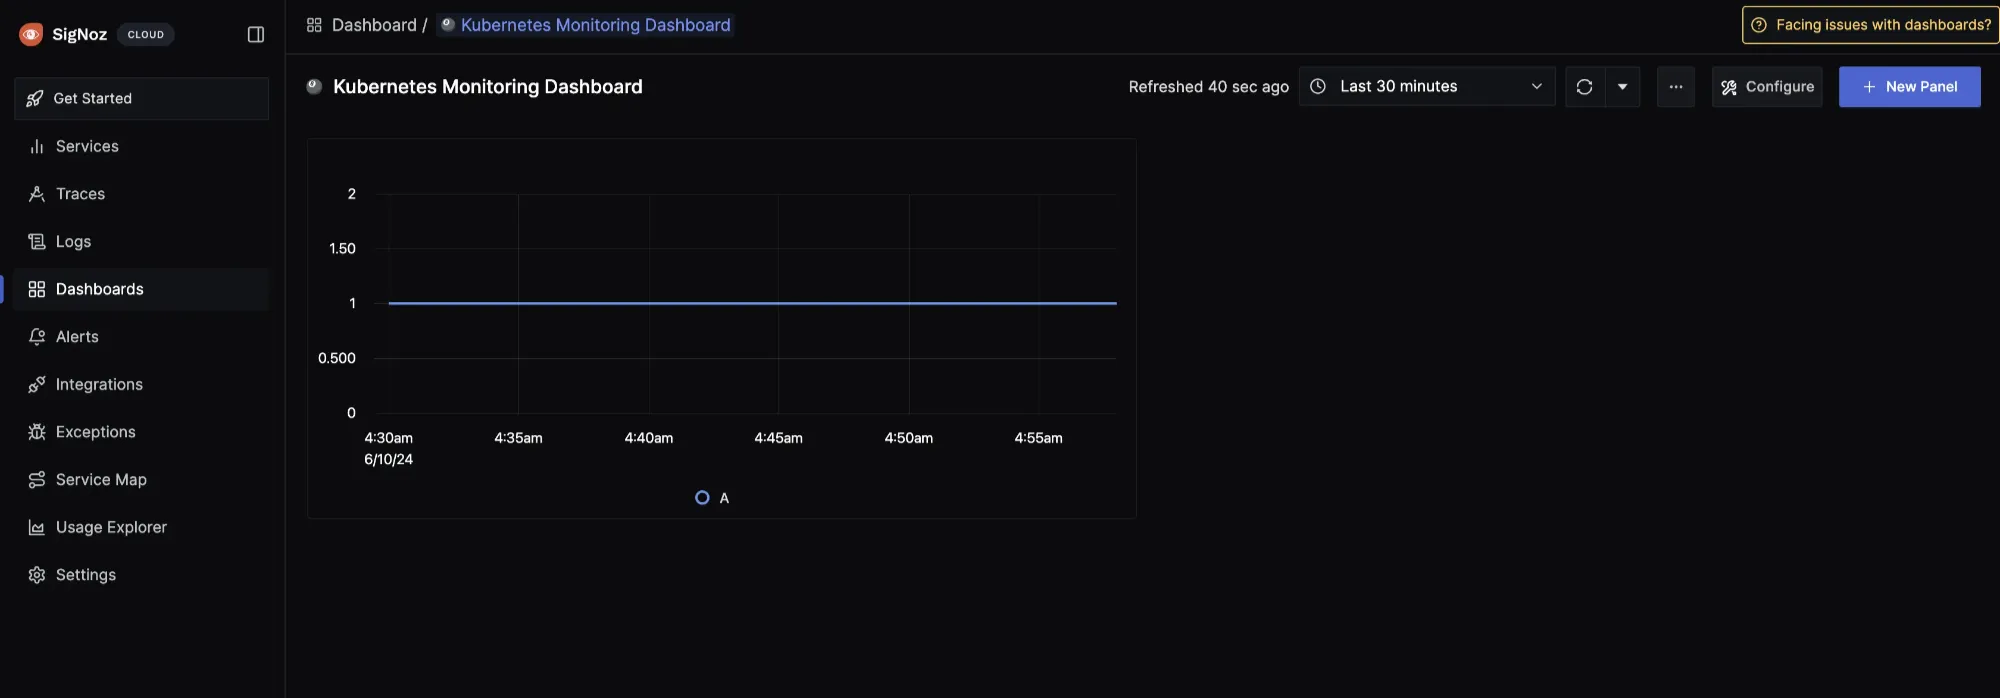
You can proceed to run more queries against metrics of your choice.
Conclusion
In this tutorial, you configured Prometheus to collect metrics data from a Kubernetes cluster and sent the data to SigNoz for monitoring and visualization.
Visit our complete guide on OpenTelemetry Collector to learn more about it.
If you're excited about SigNoz and want to go deeper, join the SigNoz Slack to be part of this awesome open-source community!

