Prometheus, a powerful open-source monitoring system, offers robust tools for analyzing time-series data. Two of its most crucial functions — histogram_quantile and rate — often confuse even seasoned developers. This article demystifies these functions, explaining their differences, use cases, and how they work together to provide valuable insights into system performance.
Understanding Prometheus Histograms: The Foundation
In Prometheus, histograms are a specialized metric type that captures the distribution of values over time, providing a way to track patterns in data such as response times, latency, and request sizes. Histograms are designed to aggregate and measure how often certain values fall within these predefined ranges, allowing for a detailed view of metric distribution. Unlike basic metrics like counters or gauges, histograms provide cumulative counts across configurable bucket boundaries. They consist of multiple time series: a counter for each bucket boundary, a sum of all observed values, and a count of all observations.
Histogram Buckets and Their Significance
Buckets are the core of a Prometheus histogram and act as defined ranges that categorize the observed values. Each bucket counts the number of observations within its range, such as response times falling below 100ms, 500ms, and 1 second. These ranges give insight into the distribution of values, allowing users to see where most values fall. For instance, if most of the response times fall into lower buckets, this could indicate good performance, while a high count in higher buckets may reveal latency issues. Choosing the right bucket ranges is critical to accurately representing data, as they impact how observations are captured and analyzed.
How Prometheus Histograms Differ from Traditional Histograms
Traditional histograms offer a snapshot view of data distribution at a single point in time, often providing only static insights. In contrast, Prometheus histograms dynamically track distributions over time, capturing continuous changes in data patterns. For instance, Prometheus histograms can reveal how response times fluctuate during peak traffic hours versus low-traffic periods, which is invaluable for identifying performance trends. Additionally, Prometheus histograms automatically support operations like percentile calculations, which help in setting thresholds for acceptable performance levels.
Use Cases for Prometheus Histograms in Monitoring
Prometheus histograms are especially valuable in use cases that require granular insights into system performance. Some common applications include:
- Monitoring Response Times: Histograms can track how often requests fall within certain response time ranges, helping identify latency issues. For example, they can show how many requests are handled within 100ms, 500ms, or 1 second.
- Understanding System Load: Histograms can track the size of requests or the rate of processing, allowing for an understanding of how load varies over time and under different conditions.
- Setting and Monitoring Service Level Objectives (SLOs): Percentile calculations from histograms are often used to set SLOs, such as ensuring 95% of requests complete within a specific time frame.
Anatomy of a Prometheus Histogram
Prometheus histograms provide a structured way to measure distributions of observed values. Understanding the key components of a histogram helps in configuring them effectively for performance monitoring and analysis.
A Prometheus histogram consists of three essential elements:
- Buckets: These represent predefined ranges of values. For example, a histogram tracking response times might have buckets for requests that take less than 100ms, 500ms, 1 second, etc. Each bucket counts how many observations fall within its range, allowing you to see how values are distributed across different performance levels.
- Count: This is the total number of observations that the histogram has recorded across all buckets. In the example of response times, the count would represent the total number of requests handled.
- Sum: This is the sum of all observed values, providing context about the total workload. In the case of response times, the sum is the total duration of all requests combined. This helps in calculating averages and understanding the overall system performance.
Together, these components allow Prometheus to track both the distribution and magnitude of observations, which is crucial for gaining actionable insights from metrics data.
Cumulative Counters in Histogram Buckets
One important aspect of Prometheus histograms is that each bucket is cumulative (includes all observations from smaller buckets). This means that when you query a specific bucket, it shows the total number of observations that fall into that bucket or any smaller bucket. For example, if you have a bucket for response times up to 1 second, its value will include all requests that took 1 second or less. This cumulative approach simplifies percentile calculations, as higher buckets automatically account for all lower observations.
# HELP http_request_duration_seconds Request duration histogram
# TYPE http_request_duration_seconds histogram
http_request_duration_seconds_bucket{le="0.1"} 2    # 2 requests ≤ 0.1s
http_request_duration_seconds_bucket{le="0.5"} 5    # 5 requests ≤ 0.5s
http_request_duration_seconds_bucket{le="1"} 8      # 8 requests ≤ 1s
http_request_duration_seconds_bucket{le="5"} 9      # 9 requests ≤ 5s
http_request_duration_seconds_bucket{le="+Inf"} 10  # All 10 requests
http_request_duration_seconds_sum 23.8              # Total seconds
http_request_duration_seconds_count 10              # Total requests
In this example:
- Bucket Boundaries (le labels): Each bucket has an upper boundary, represented by the
le(less than or equal to) label (e.g.,le="0.1",le="0.5"). These boundaries indicate the maximum duration included in each bucket. The metric name typically ends in_bucket. - Cumulative Counters: Each bucket’s value is cumulative, so
le="1"(8 requests) includes all requests with durations of 1 second or less. Similarly,le="5"(9 requests) includes all requests with durations of up to 5 seconds, encompassing the counts from all smaller buckets. - Sum and Count: The
+Infbucket (10) equals the_count(10), confirming all observations are captured. Thesumprovides the total duration of all observations combined, andcountshows the total number of observations. These metrics offer additional context on the overall distribution.
Choosing appropriate bucket sizes is crucial for accurate analysis. Too few buckets may lead to loss of precision, while too many can increase resource usage.
How Bucket Boundaries Are Defined and Their Impact on Accuracy
Bucket boundaries are predefined ranges that determine how observations are grouped. These boundaries are fixed when setting up the histogram and should align with the expected range and granularity of the data being measured.
Impact on Accuracy
- Too Few Buckets: Leads to loss of granularity. For example, having just two buckets (e.g.,
<1sand>1s) makes it difficult to analyze trends within finer time ranges. - Too Many Buckets: Increases resource usage, including storage and query processing time. Overly granular buckets might add complexity without significant analytical benefits.
- Boundary Placement: Misaligned boundaries can result in inaccurate data grouping. For example, if most requests fall between 50ms and 100ms, but you only define buckets for 100ms, 500ms, etc., you lose insights into smaller variations.
Best Practices for Choosing Bucket Sizes
When configuring histogram buckets, consider the following best practices:
- Understand Your Data: Choose bucket sizes that match the typical range of your metrics. For example, if your service’s response times mostly fall between 100ms and 1 second, define buckets that capture variations within that range.
- Avoid Overly Granular Buckets: Too many buckets can increase resource usage and complexity without adding much value. Start with a reasonable range and adjust based on your monitoring needs.
- Use Logarithmic Buckets for Skewed Distributions: For metrics with a wide range of values (e.g., request durations that can vary from milliseconds to several seconds), logarithmic bucket sizing can be more effective, as it provides more detail for smaller values while still capturing larger ones.
- Minimize Excessive Buckets: Choosing appropriate bucket sizes is crucial for accurate analysis. Too few buckets may lead to loss of precision, while too many can increase resource usage. Start with a minimal, meaningful set of buckets, and add more if needed based on monitoring requirements
Demystifying the Rate Function in Prometheus
The rate() function in Prometheus is a fundamental tool for analyzing the growth or frequency of counter metrics over time. It calculates the per-second average rate of increase over a specified time window or range. This is crucial because:
- Counters only increase (except for resets), such as the number of HTTP requests received by a server.
- Raw counter values are less useful than their rates of change
- Patterns and trends become more visible when viewed as rates
The purpose of the rate function is to smooth out spikes and produce a per-second rate of increase over a specific time range, making it easier to visualize and understand trends. The function enables users to monitor how fast counters are increasing, providing insights into things like request throughput, error rates, or system performance.
How Rate Calculates the Per-Second Increase of Time Series
The rate function calculates the average rate of change per second by looking at the difference in a counter metric’s value over a defined time range. It divides this difference by the total time elapsed, giving you a per-second rate. For example, if a counter for HTTP requests increases by 300 over the last 5 minutes, the rate function would divide 300 by 300 seconds (5 minutes), resulting in an average of 1 request per second.
The rate function uses this basic formula:
rate = (end_value - start_value) / time_duration_in_seconds
For example:
# If over 5 minutes (300s):
- Start value: 1000 requests
- End value: 1300 requests
rate = (1300 - 1000) / 300 = 1 request/second
The syntax for rate is:
rate(counter_metric[time_range])
where metric is the counter metric, and time_range defines the period (e.g., 5m for 5 minutes, 1h for 1 hour) over which the rate is calculated. Shorter time ranges capture immediate changes, while longer ranges provide a more general trend.
Importance of Rate in Analyzing Counter Metrics
rate is essential when working with counter metrics because these metrics continuously increase, but they may also reset (e.g., after a service restart). The rate function intelligently handles these resets, allowing you to focus on the actual rate of events without worrying about interruptions.
Without rate, monitoring systems would struggle to handle counter resets, leading to inaccurate data on system performance. The rate function ensures smooth, accurate calculations, even during such resets.
Common Use Cases for Ratein Prometheus Queries
The rate function in Prometheus is highly useful for tracking changes over time by calculating the per-second average rate of increase of a counter metric. Below are examples of its common uses with the http_server_requests_seconds_count metric.
Request
RateMonitoring:Monitoring the rate of requests helps track how many requests an application or service is processing over a specific period. This is essential for understanding traffic patterns, handling capacity, and detecting unexpected spikes in demand.
Example:
rate(http_server_requests_seconds_count[5m])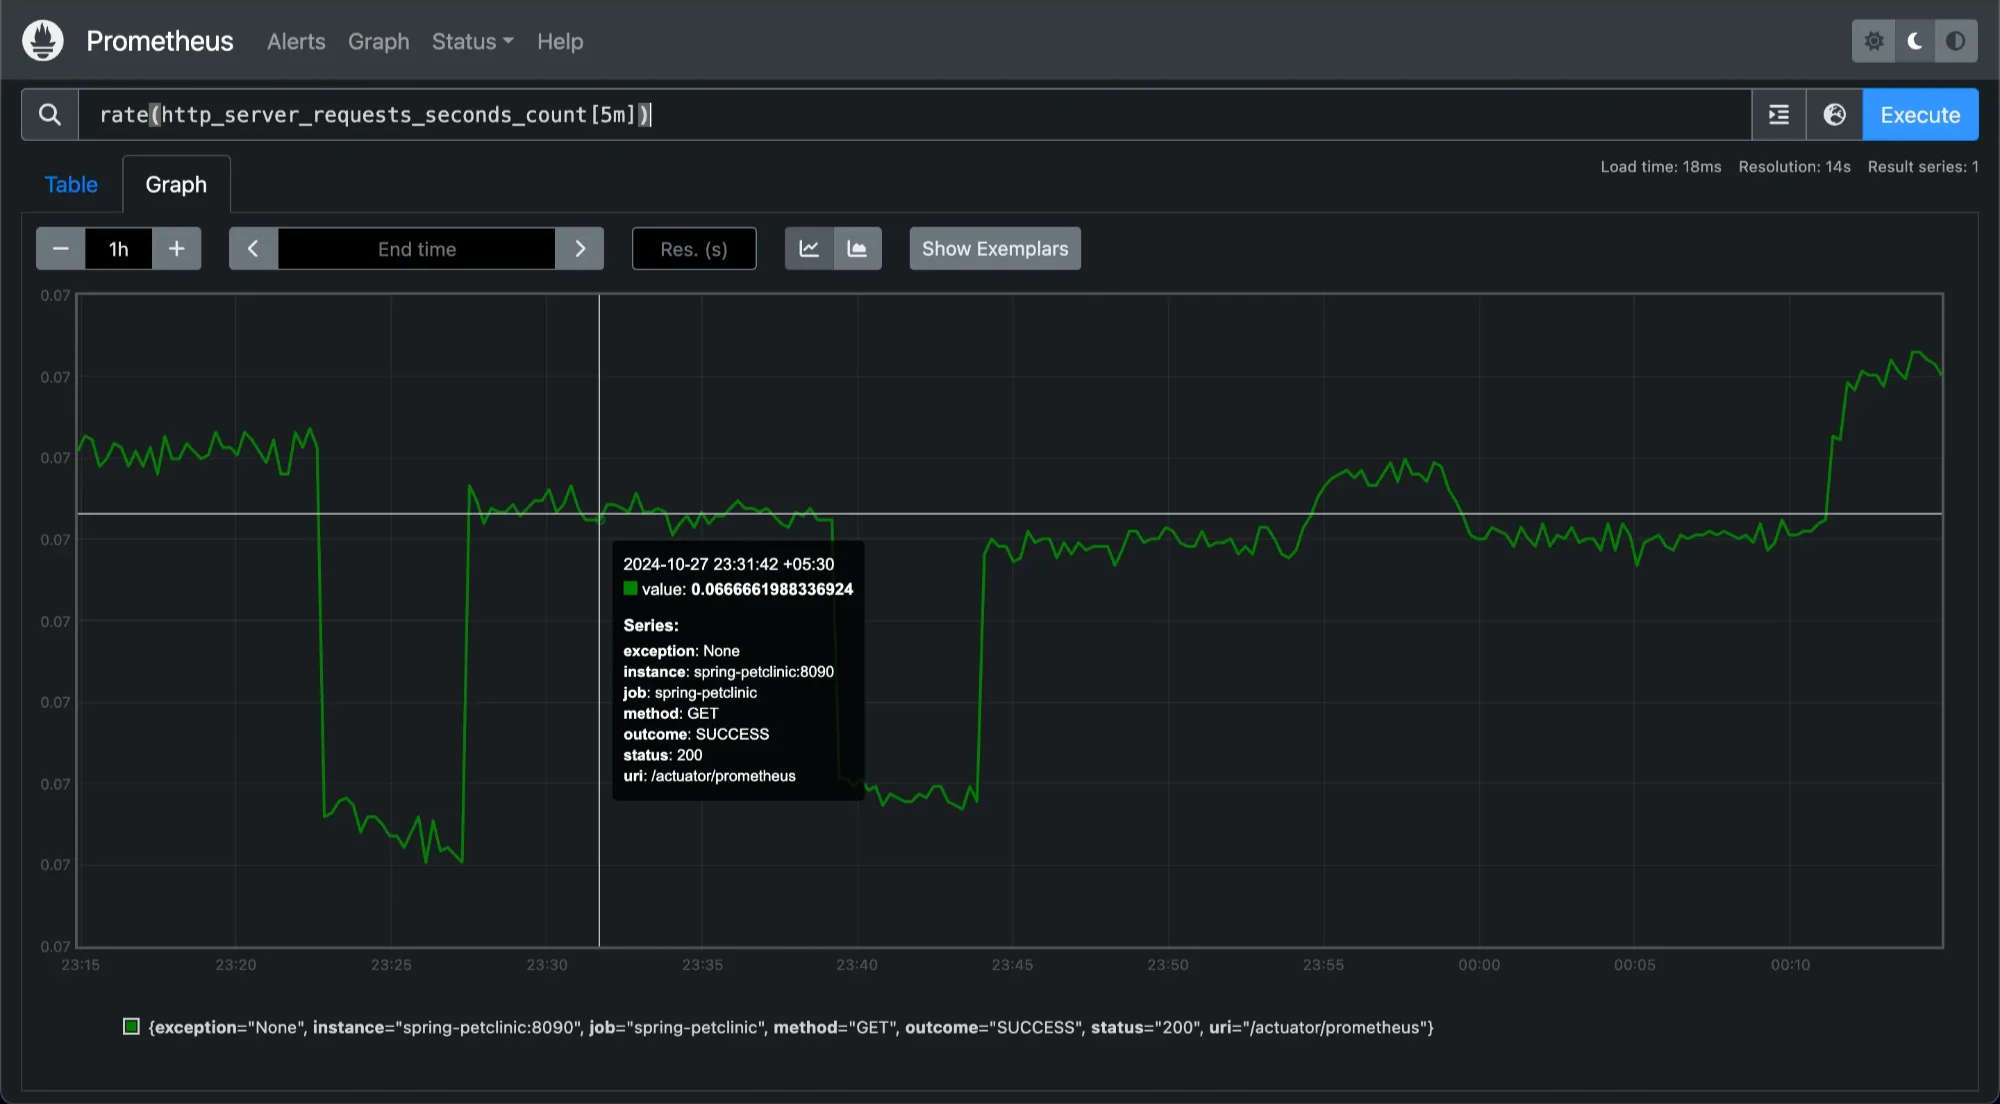
Monitoring rate of request, normal traffic and spikes Here,
rate(http_server_requests_seconds_count[5m])calculates the average rate of HTTP server requests per second over the past 5 minutes. This metric can help you monitor normal traffic levels and identify spikes.Throughput Analysis:
ratecan also be used to monitor data throughput by tracking the number of processed requests over time. This is essential in network or storage systems to ensure that resource utilization meets the required levels.Example:
rate(http_server_requests_seconds_count[5m])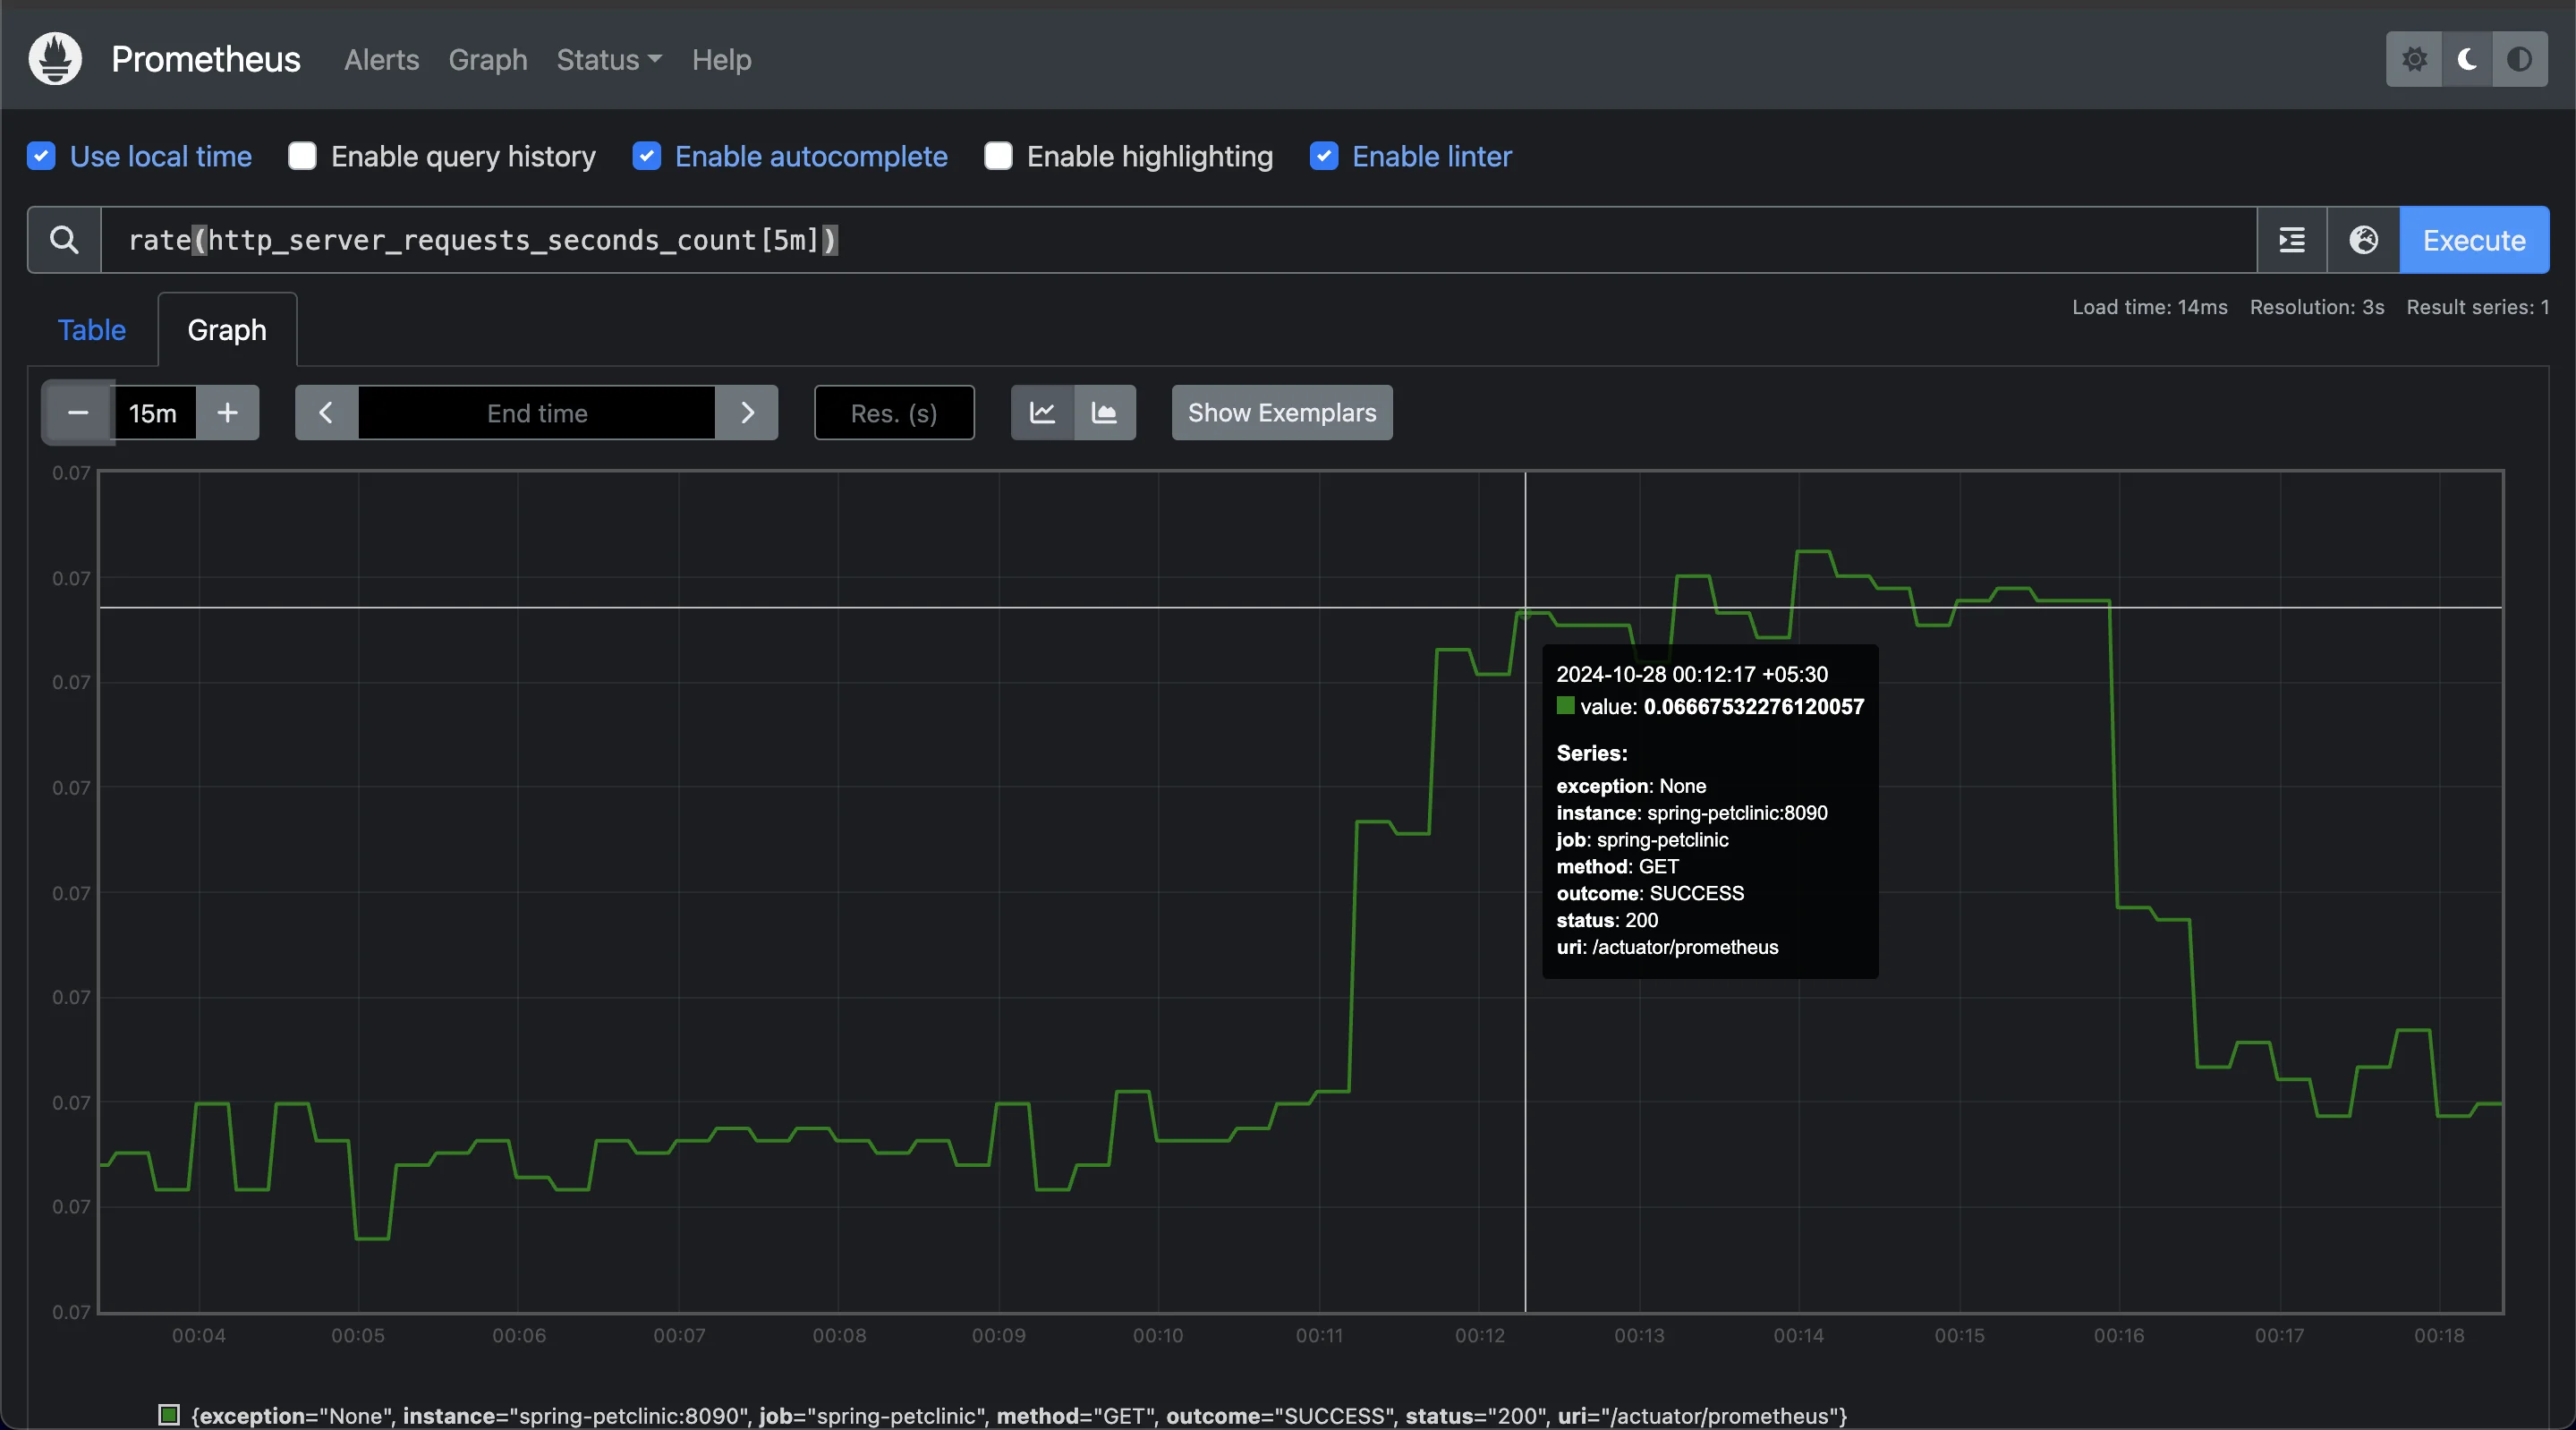
Monitoring HTTP requests by the server over 5 min This example calculates the rate of HTTP requests processed by the server over the past 5 minutes, providing an overview of throughput. A consistent or increasing rate indicates steady or growing demand on the system, useful for performance tuning and scaling.
CPU Usage Monitoring:
Although
rateis typically used with specific request metrics, it can also track CPU time usage by a process when combined with metrics that measure CPU usage. Monitoring this helps optimize resource allocation.Example:
rate(process_cpu_usage[1m])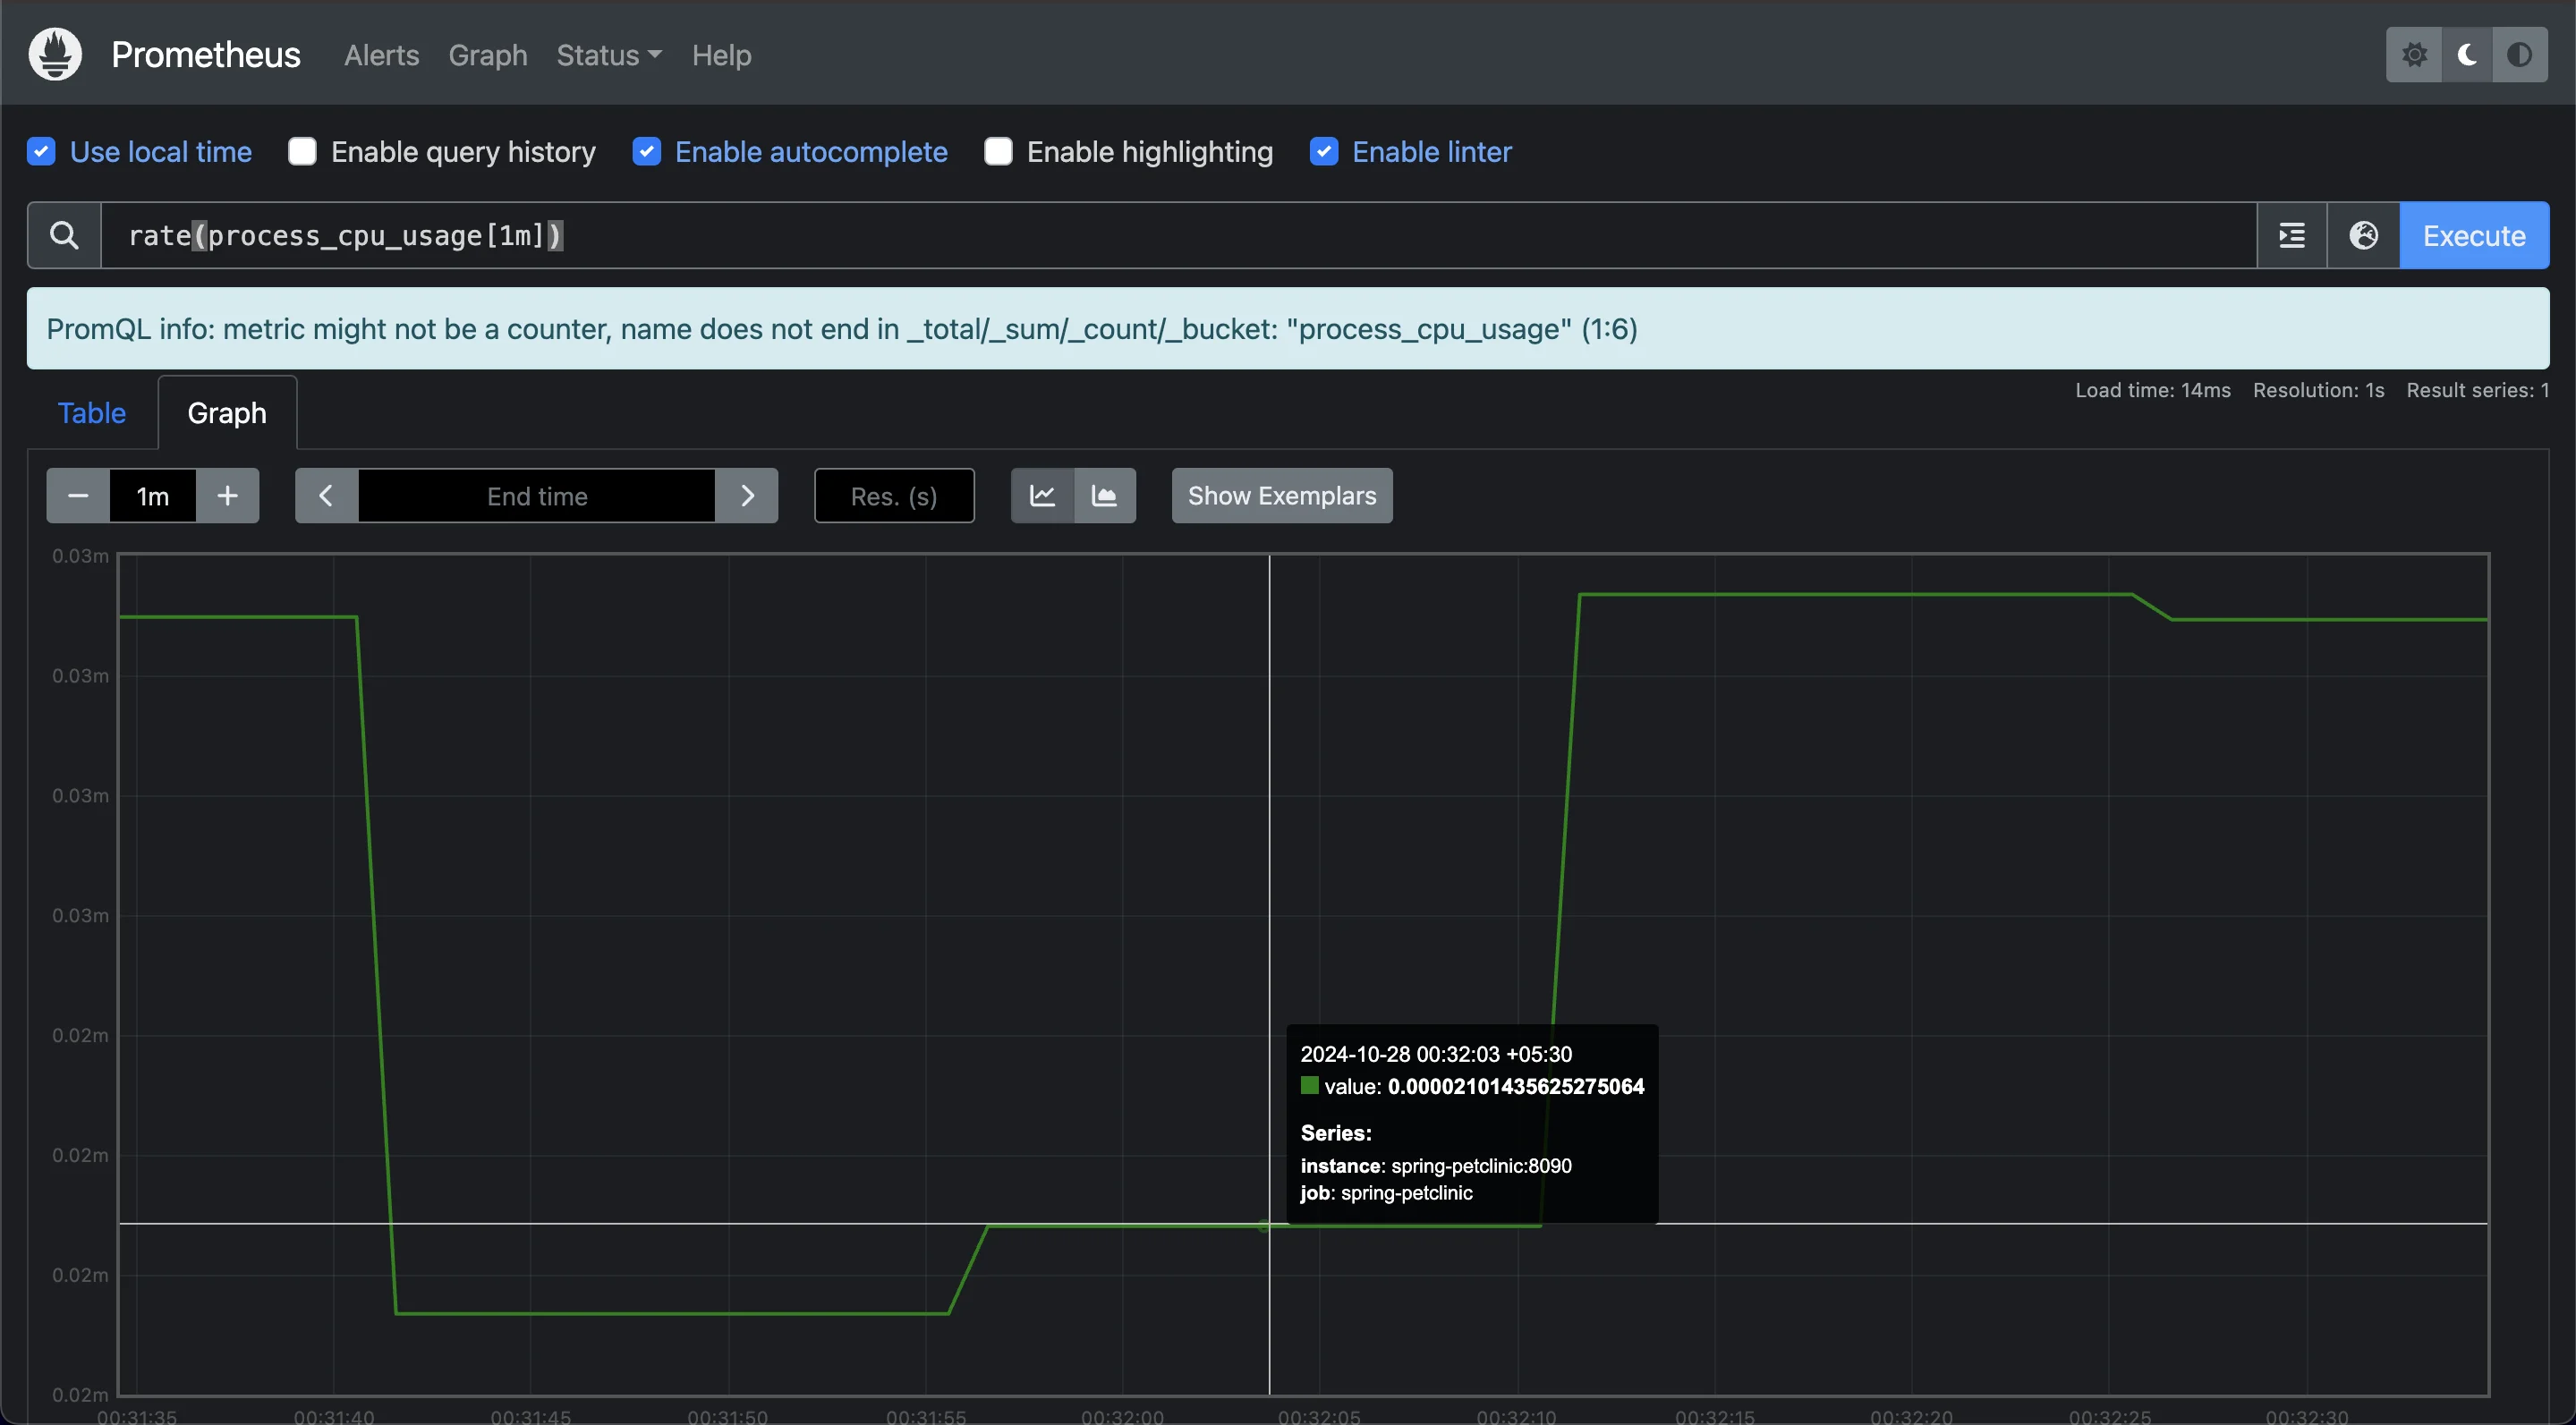
Monitoring CPU Usage over last 1 minute This query calculates the
rateof CPU time consumed by a process per second over the last 1 minute, helping to pinpoint processes that consume excessive CPU resources.
These examples illustrate how rate provides valuable insights across different monitoring scenarios by enabling you to track usage, performance, and errors efficiently in Prometheus.
Deep Dive into histogram_quantile Function
The histogram_quantile function is a powerful tool in Prometheus for calculating specific percentiles from histogram data, helping you understand the distribution of values over time. This is especially useful in monitoring, where you may want insights into the latency or response times of services.
Quantiles and Their Importance in Statistics
Quantiles divide a data distribution into equal intervals, allowing users to understand the spread and concentration of values. For instance, the 95th percentile (0.95 quantile) represents the value below which 95% of observations fall. Quantiles are essential for performance monitoring and service-level objectives (SLOs), as they highlight worst-case behaviors (e.g., slow response times) that averages may overlook. In practice, quantiles are valuable for detecting performance degradation and ensuring user experiences stay within acceptable limits.
How histogram_quantile Calculates Quantiles from Histogram Data
The function works by taking two main inputs:
- Quantile Value: This is a number between 0 and 1, representing the desired percentile. For example, a quantile of
0.95represents the 95th percentile, meaning it will return the value below which 95% of observations fall. - Histogram Buckets: The histogram's bucket data with their cumulative counts and
le(less than or equal) labels. Histogram data in Prometheus is collected in ranges called “buckets.” These buckets count how many values fall within each range, giving a rough distribution of the data. When you query withhistogram_quantile, it uses these buckets to estimate the desired quantile.
The function interpolates between bucket boundaries to estimate the quantile, which makes it more accurate than relying on individual bucket counts alone.
The syntax for histogram_quantile is:
histogram_quantile(quantile, sum(rate(<histogram_metric>)) by (le))
Relationship Between histogram_quantile and rate
The histogram_quantile function often works with rate to give a more current snapshot of your metrics. Since histograms are cumulative counters, using rate helps calculate the rate of change over a set interval. This is particularly useful for time-based queries because rate ensures you’re capturing trends instead of only static values.
In the example above, applying rate to http_server_requests_seconds_bucket shows how frequently requests fall into each duration bucket over the 5-minute period. Then, histogram_quantile estimates the 95th percentile based on this rate-adjusted data, giving a percentile value that’s dynamic and adjusts to recent conditions.
When to Use histogram_quantile
Using histogram_quantile is beneficial when you want detailed insights into how requests or metrics are distributed. This is especially relevant for tracking Service Level Objectives (SLOs), where you may want to monitor that 95% or 99% of requests meet a certain performance threshold.
However, it’s important to remember that:
- The accuracy of
histogram_quantiledepends on the setup of your histogram buckets. If the buckets are too wide, the estimation may be less precise. - Complex queries combining
histogram_quantilewith multiple labels or instances can impact Prometheus’s performance, as aggregating histogram data across large datasets can be resource-intensive.
By using histogram_quantile strategically, you can extract detailed performance insights, making it a powerful tool for monitoring applications and ensuring they meet performance standards.
Calculating Percentiles with histogram_quantile
Using the histogram_quantile function in Prometheus can help you analyze and track performance at specific percentiles. This is particularly useful in applications where user experience depends on system responsiveness, as percentiles let you pinpoint response time patterns and identify potential slowdowns.
Choose the Desired Percentile: First, decide which percentile you need to analyze. For example, to observe the 95th percentile, use
0.95as the quantile value in your query. The 95th percentile indicates that 95% of observed values fall below this point, giving you insight into high-end performance limits without focusing on extreme outliers.Apply the
rateFunction: For accurate percentile calculations, apply theratefunction to the histogram’s bucket data over a selected time range (e.g., 5 minutes). This calculates the rate of change per second for each bucket within the specified interval, smoothing out any short-term variations.Sum the Rates and Group by Bucket Boundaries: This query calculates the rate of promotion of objects in memory over a 12-hour window, grouped by the
arealabel, which represents different segments of memory (such as heap and non-heap). By summing the rates and grouping byarea, you can gain insights into how the promoted memory usage distributes across different parts of the Java Virtual Machine.Example query:
sum(rate(jvm_gc_memory_promoted_bytes_total[12h])) by (area)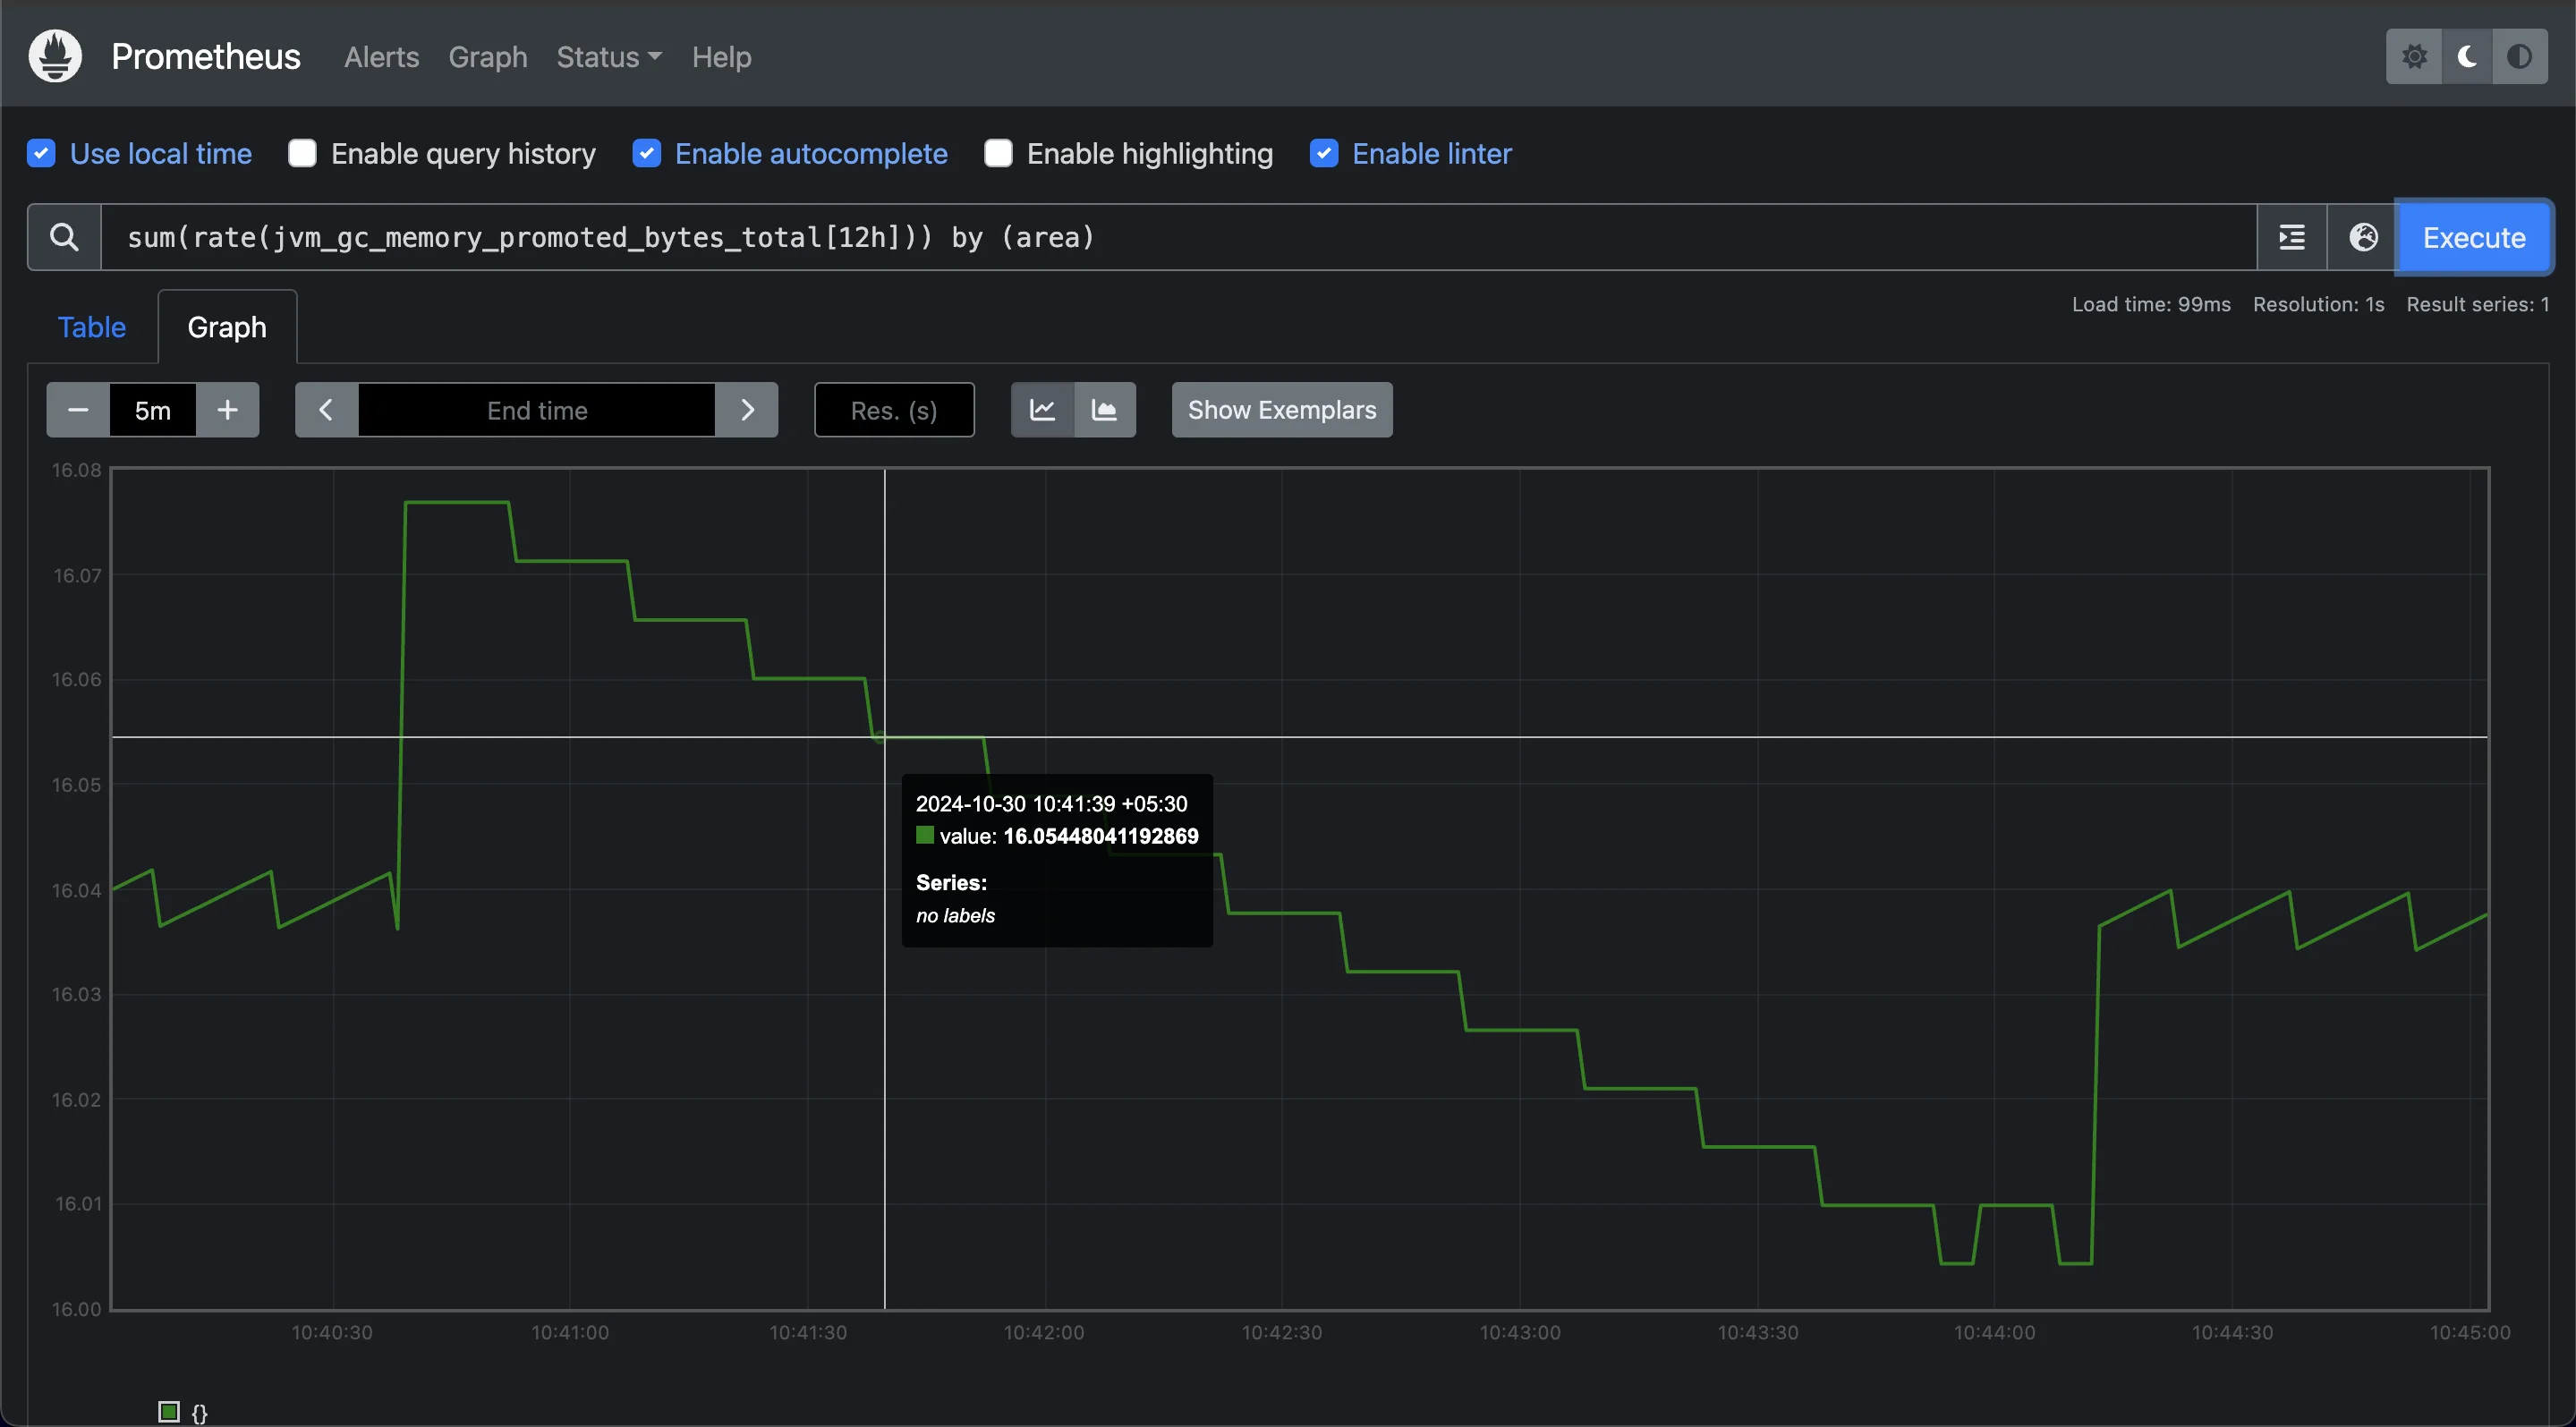
Sum Rates to monitor memory activities This query provides a 12-hour perspective on the rate of memory promotion events, helping you monitor trends in memory activity across JVM areas. This visibility is crucial for identifying areas under memory pressure, enabling proactive adjustments to maintain performance and stability.
Pass the Result to
histogram_quantile: Finally, usehistogram_quantileto calculate the chosen percentile across these grouped bucket rates. This gives you the estimated metric value (such as request duration) below which the chosen percentage of observations fall.
Interpretation: The output of histogram_quantile represents the maximum duration that 95% of requests fall under, which is valuable for setting performance benchmarks or identifying slowdowns.
Comparing histogram_quantile and rate: When to Use Each
The histogram_quantile and rate functions each have unique strengths, so choosing the right one depends on what you need to analyze in your data. Here’s a breakdown of when to use each function:
Scenarios Where histogram_quantile Is Preferred Over rate
The histogram_quantile function is best used when you want to calculate specific percentiles in your data. Percentiles allow you to see the value below which a certain percentage of observations fall, which is useful when you need to focus on distribution patterns rather than just averages.
For example, if you want to understand how long the slowest 5% of HTTP requests take to complete, you can use histogram_quantile to find the 95th percentile. This would help you determine the duration threshold for most requests, excluding extreme outliers.
Common scenarios for using histogram_quantile include:
- Detailed Performance Analysis: Finding specific percentiles in response times or request durations.
- Setting Service Level Objectives (SLOs): Many SLOs are defined in terms of percentiles. For instance, an SLO may require 99% of requests to complete within a specific time frame.
histogram_quantilehelps calculate this.
Use Cases Where rate Is More Appropriate Than histogram_quantile
The rate function is ideal when you need to measure the rate of increase in a counter metric. It calculates the per-second rate of change in data points over a specified time window, which is helpful for tracking trends and fluctuations over time.
Use rate in scenarios such as:
- Request Rate Monitoring: Calculating the rate at which requests are coming in over time. For example, the query
rate(http_server_requests_seconds_count[5m])would tell you how many HTTP requests are being processed per second over the last 5 minutes. - Error Rate Calculation: Tracking the rate at which errors are occurring in a system. By applying
rateto error count metrics, you can monitor system stability over time. - Input for Other Functions: Sometimes,
rateis used alongsidehistogram_quantileto get more refined insights. For instance, when calculating request durations by using bucketed metrics.
Impact on Performance and Resource Usage
Since rate and histogram_quantile serve different functions, they also have different impacts on system performance:
rate: Generally, this function is less resource-intensive because it only calculates the rate of change, which doesn’t require complex aggregation.histogram_quantile: This function can be more resource-intensive, especially with large datasets, because it has to calculate percentiles across histogram buckets. It’s recommended to use it thoughtfully, especially in production environments, to avoid unnecessary load.
Best Practices for Combining Both Functions in Queries
In some cases, combining rate and histogram_quantile gives you a more complete view of system behavior. For instance:
- First, use
rateto determine the rate of requests within each histogram bucket. - Then, apply
histogram_quantileto analyze specific percentiles based on these rates.
This approach allows you to see both the distribution (percentiles) and the frequency (rate) of requests. By combining them, you can understand both the high-level trends and the detailed distribution, providing comprehensive insights into your system’s performance.
Advanced Techniques: Aggregation and Filtering
Using advanced techniques in Prometheus can help you unlock deeper insights from histogram data by aggregating across multiple instances, filtering by specific labels, and analyzing multi-dimensional data. Here’s how:
Aggregate Across Instances: Aggregating histograms across instances allows you to calculate overall percentiles across all instances of a job. This can be especially useful when you have multiple replicas of a service and need a consolidated view.
histogram_quantile(0.95, sum(rate(http_request_duration_seconds_bucket[5m])) by (le, job))This query calculates the 95th percentile of request durations across all instances of a specified job. By using
sum(...) by (le, job), you’re combining data from each instance under the same job label, creating a more comprehensive view of latency for that service.Filter Based on Labels: Filtering allows you to focus on specific subsets of your data, such as successful requests only or requests with certain attributes.
histogram_quantile(0.99, sum(rate(http_request_duration_seconds_bucket{status="200"}[5m])) by (le))In this example, the query calculates the 99th percentile for requests that have a status code of
200, focusing on successful requests only. By adding{status="200"}to the metric, Prometheus filters for only the matching entries before applying the histogram and rate functions. This technique can help you hone in on specific types of requests, like errors or other critical events.Handle Multi-Dimensional Data: Prometheus can also handle queries with multiple labels, enabling you to analyze complex, multi-dimensional data across various labels like API method, endpoint path, or HTTP status.
histogram_quantile(0.95, sum(rate(http_request_duration_seconds_bucket[5m])) by (le, method, path))This query calculates the 95th percentile of request durations while breaking down results by HTTP method and API path. By grouping the results by
(le, method, path), you can analyze performance for each endpoint, gaining insights into how different parts of your application are performing.Handling Edge Cases and Outliers: When dealing with histogram data, be aware of possible outliers and edge cases, as they can skew percentile calculations. Outliers might be legitimate performance issues or rare spikes. You may choose to:
- Add filters to exclude unusually high or low values, reducing the impact of outliers.
- Aggregate data over longer time windows to smooth out sudden spikes, which can help you identify true performance trends.
Each of these techniques helps you extract more meaningful data and gain specific, actionable insights into application performance and reliability.
Monitoring with SigNoz: Leveraging Prometheus-Compatible Histograms
Histograms are powerful tools for capturing critical metrics like latency, response times, and data distributions, enabling detailed analysis of application performance across quantiles. With histogram metrics in SigNoz, you can effectively track application health, spot performance bottlenecks, and gain insights into user experience patterns. By leveraging SigNoz’s histogram capabilities, you can also set precise alerts and make data-driven decisions to enhance application reliability and performance.
SigNoz is a versatile, open-source observability platform that provides deep monitoring capabilities, including support for Prometheus-compatible histograms and range vectors. This combination allows you to analyze time-based trends, monitor historical performance, and proactively address issues over specific time windows.
Here's how you can leverage SigNoz to implement range vectors:
Create a SigNoz Cloud Account SigNoz Cloud provides a 30-day free trial period. This demo uses SigNoz Cloud, but you can choose to use the open-source version.
Clone Sample Flask app repository From your terminal use the following command to clone sample Flask appfrom the GitHub repository.
git clone https://github.com/SigNoz/sample-golang-appAdd .env File to the Root Project Folder In the root directory of your project folder, create a new file named
.envand paste the below details into it:OTEL_COLLECTOR_ENDPOINT=ingest.{region}.signoz.cloud:443 SIGNOZ_INGESTION_KEY=***OTEL_COLLECTOR_ENDPOINT: Specifies the address of the SigNoz collector where your application will send its telemetry data.SIGNOZ_INGESTION_KEY: Authenticates your application with the SigNoz collector.Note: Replace
{region}with your SigNoz region andSIGNOZ_INGESTION_KEYwith your actual ingestion key.To obtain the SigNoz ingestion key and region, navigate to the “Settings” page in your SigNoz dashboard. You will find the ingestion key and region under the “Ingestion Settings” tab.
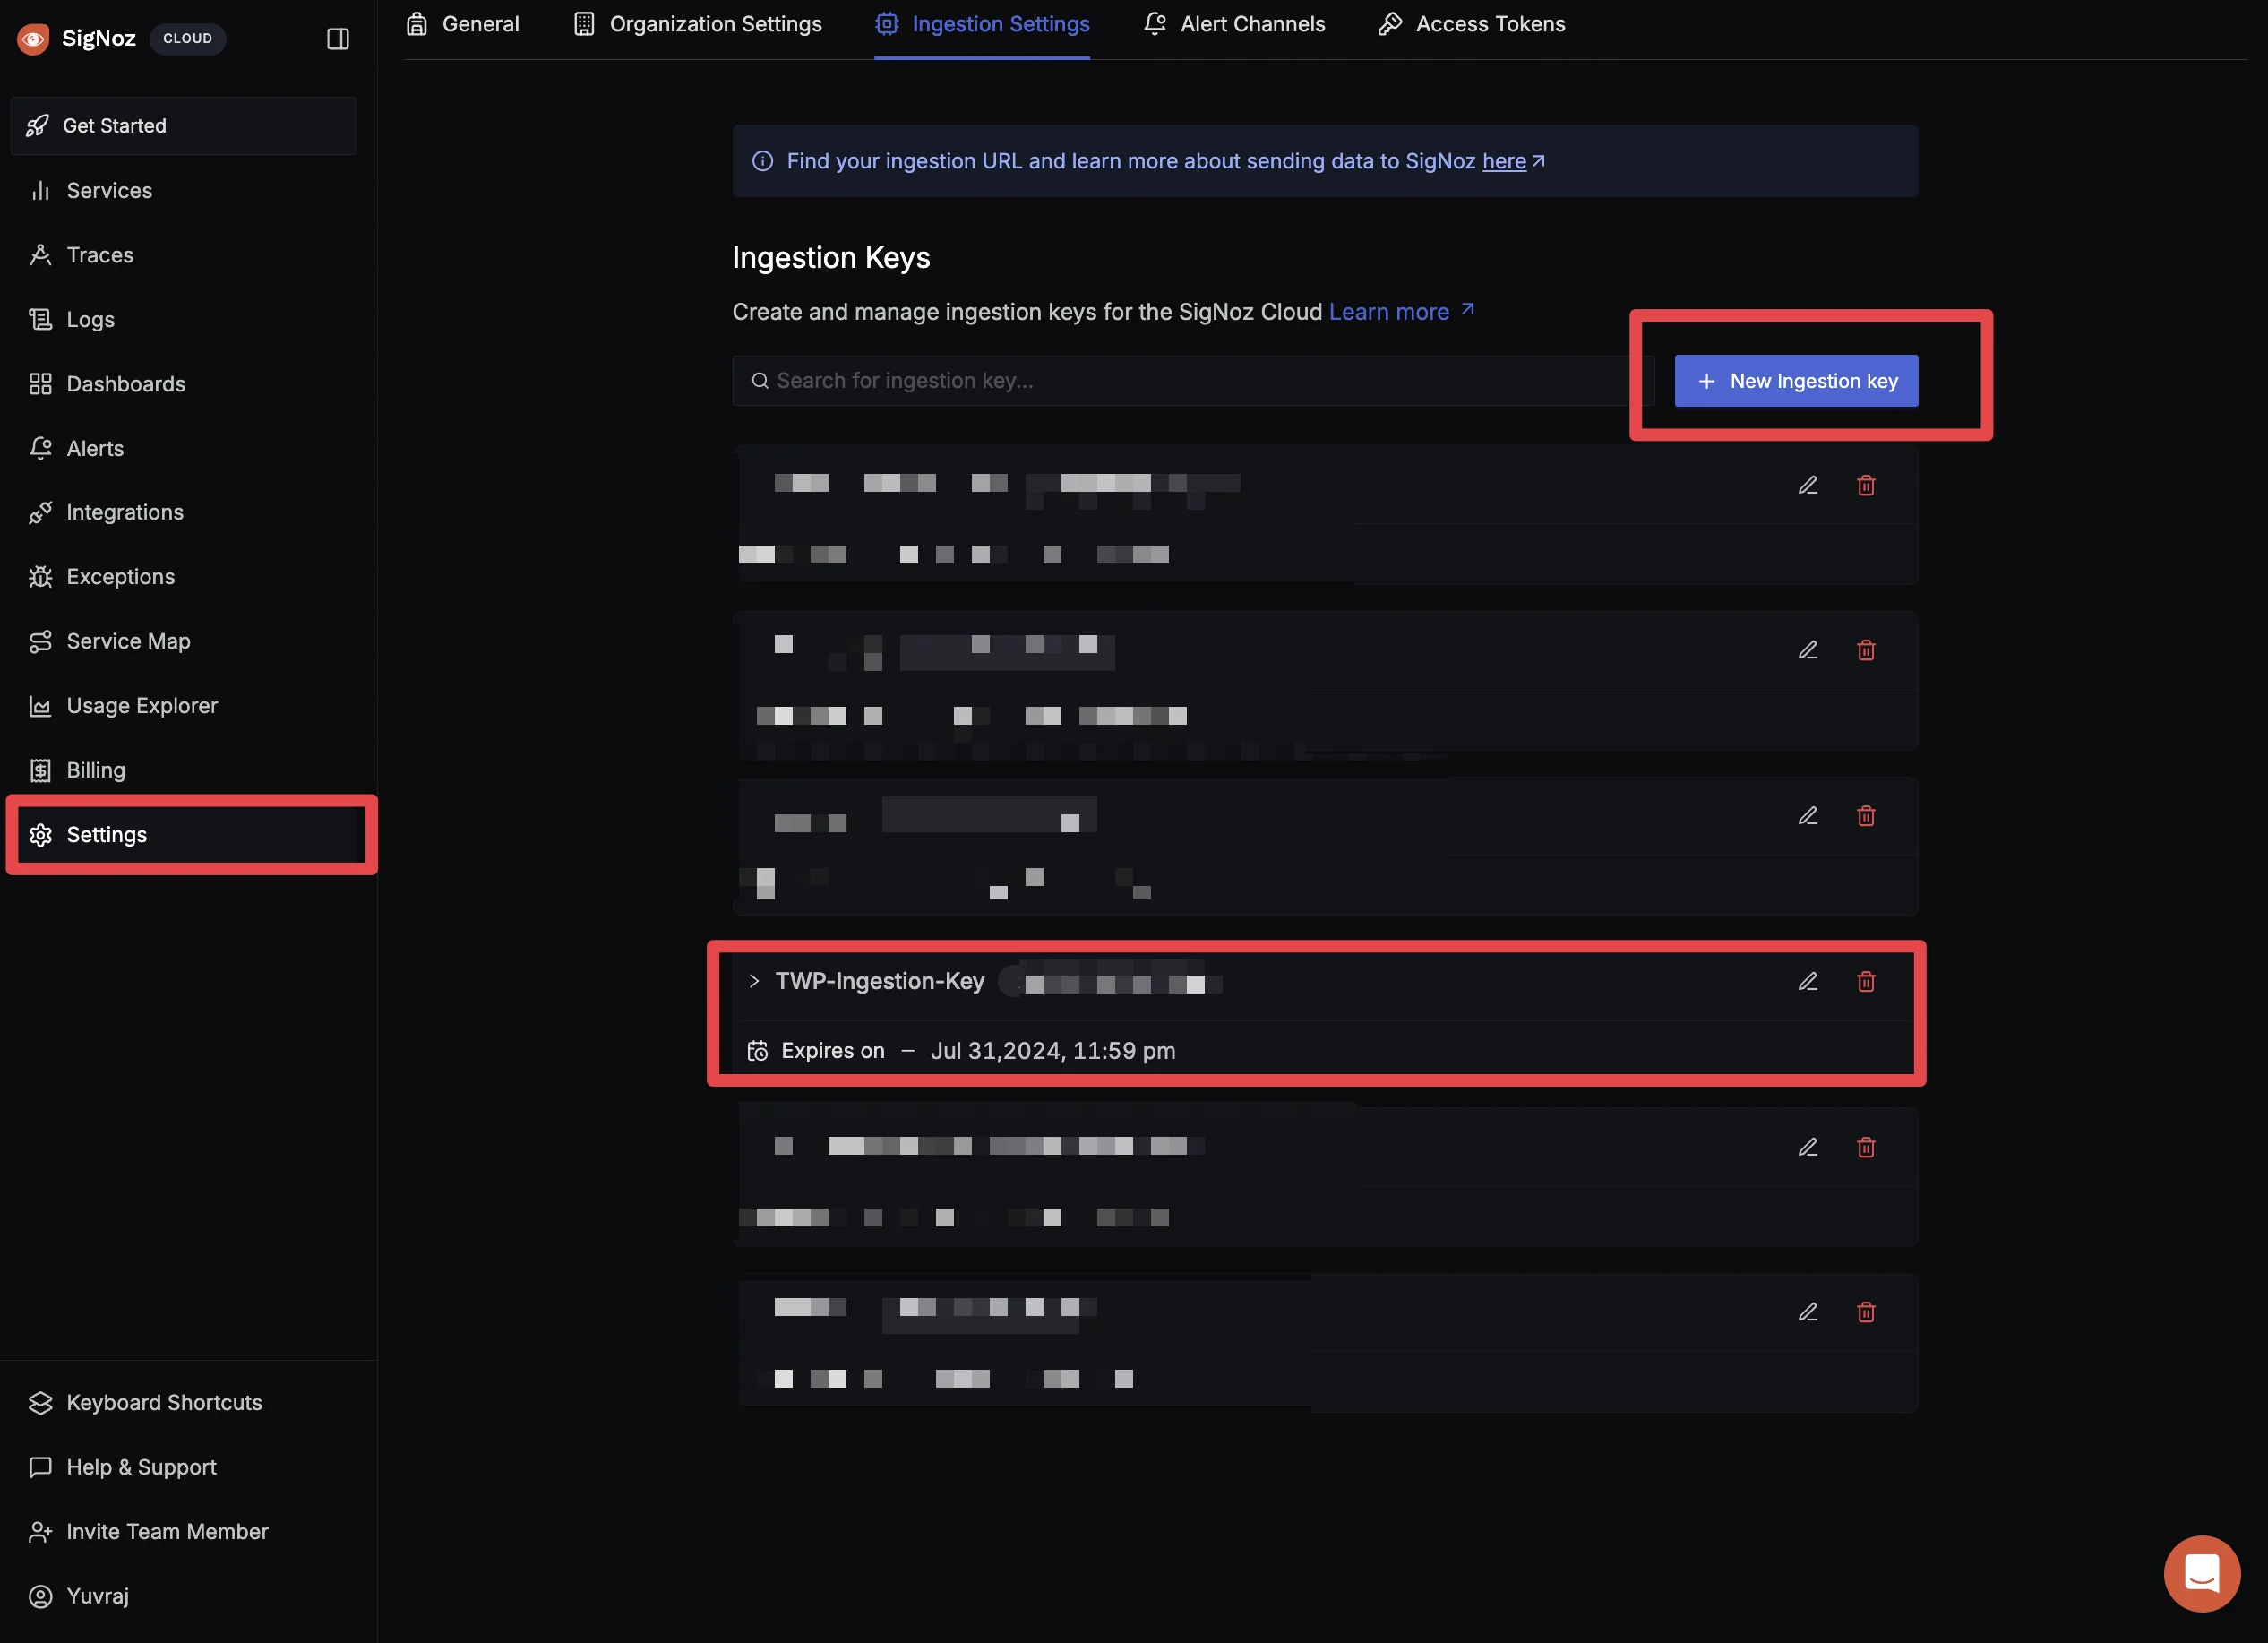
SigNoz Ingestion Settings Page Using SigNoz Application Monitoring: In the top left corner, click on getting started.
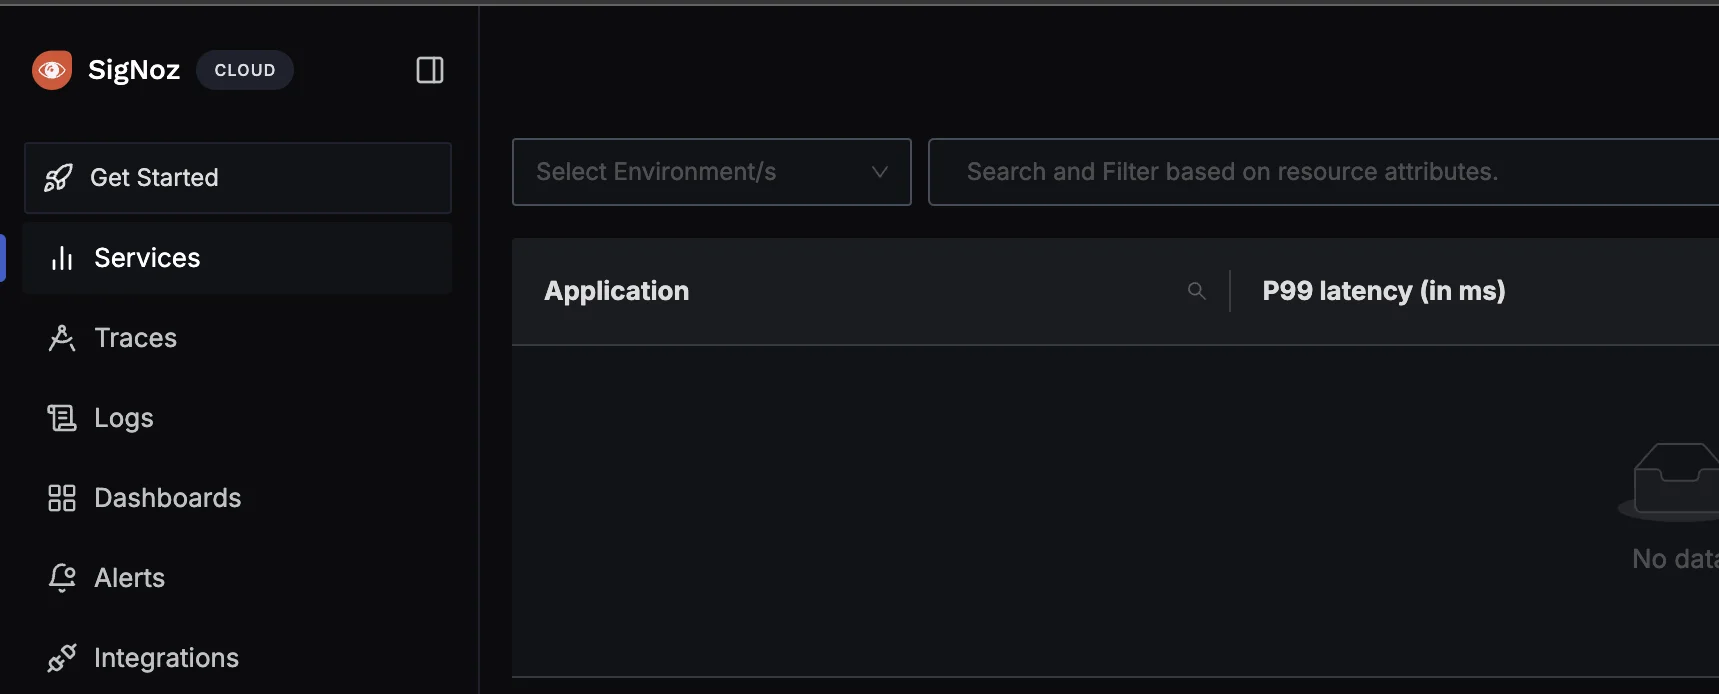
SigNoz Dashboard You will be redirected to “Get Started Page”. Choose
Application Monitoringto check latency and how your application is performing.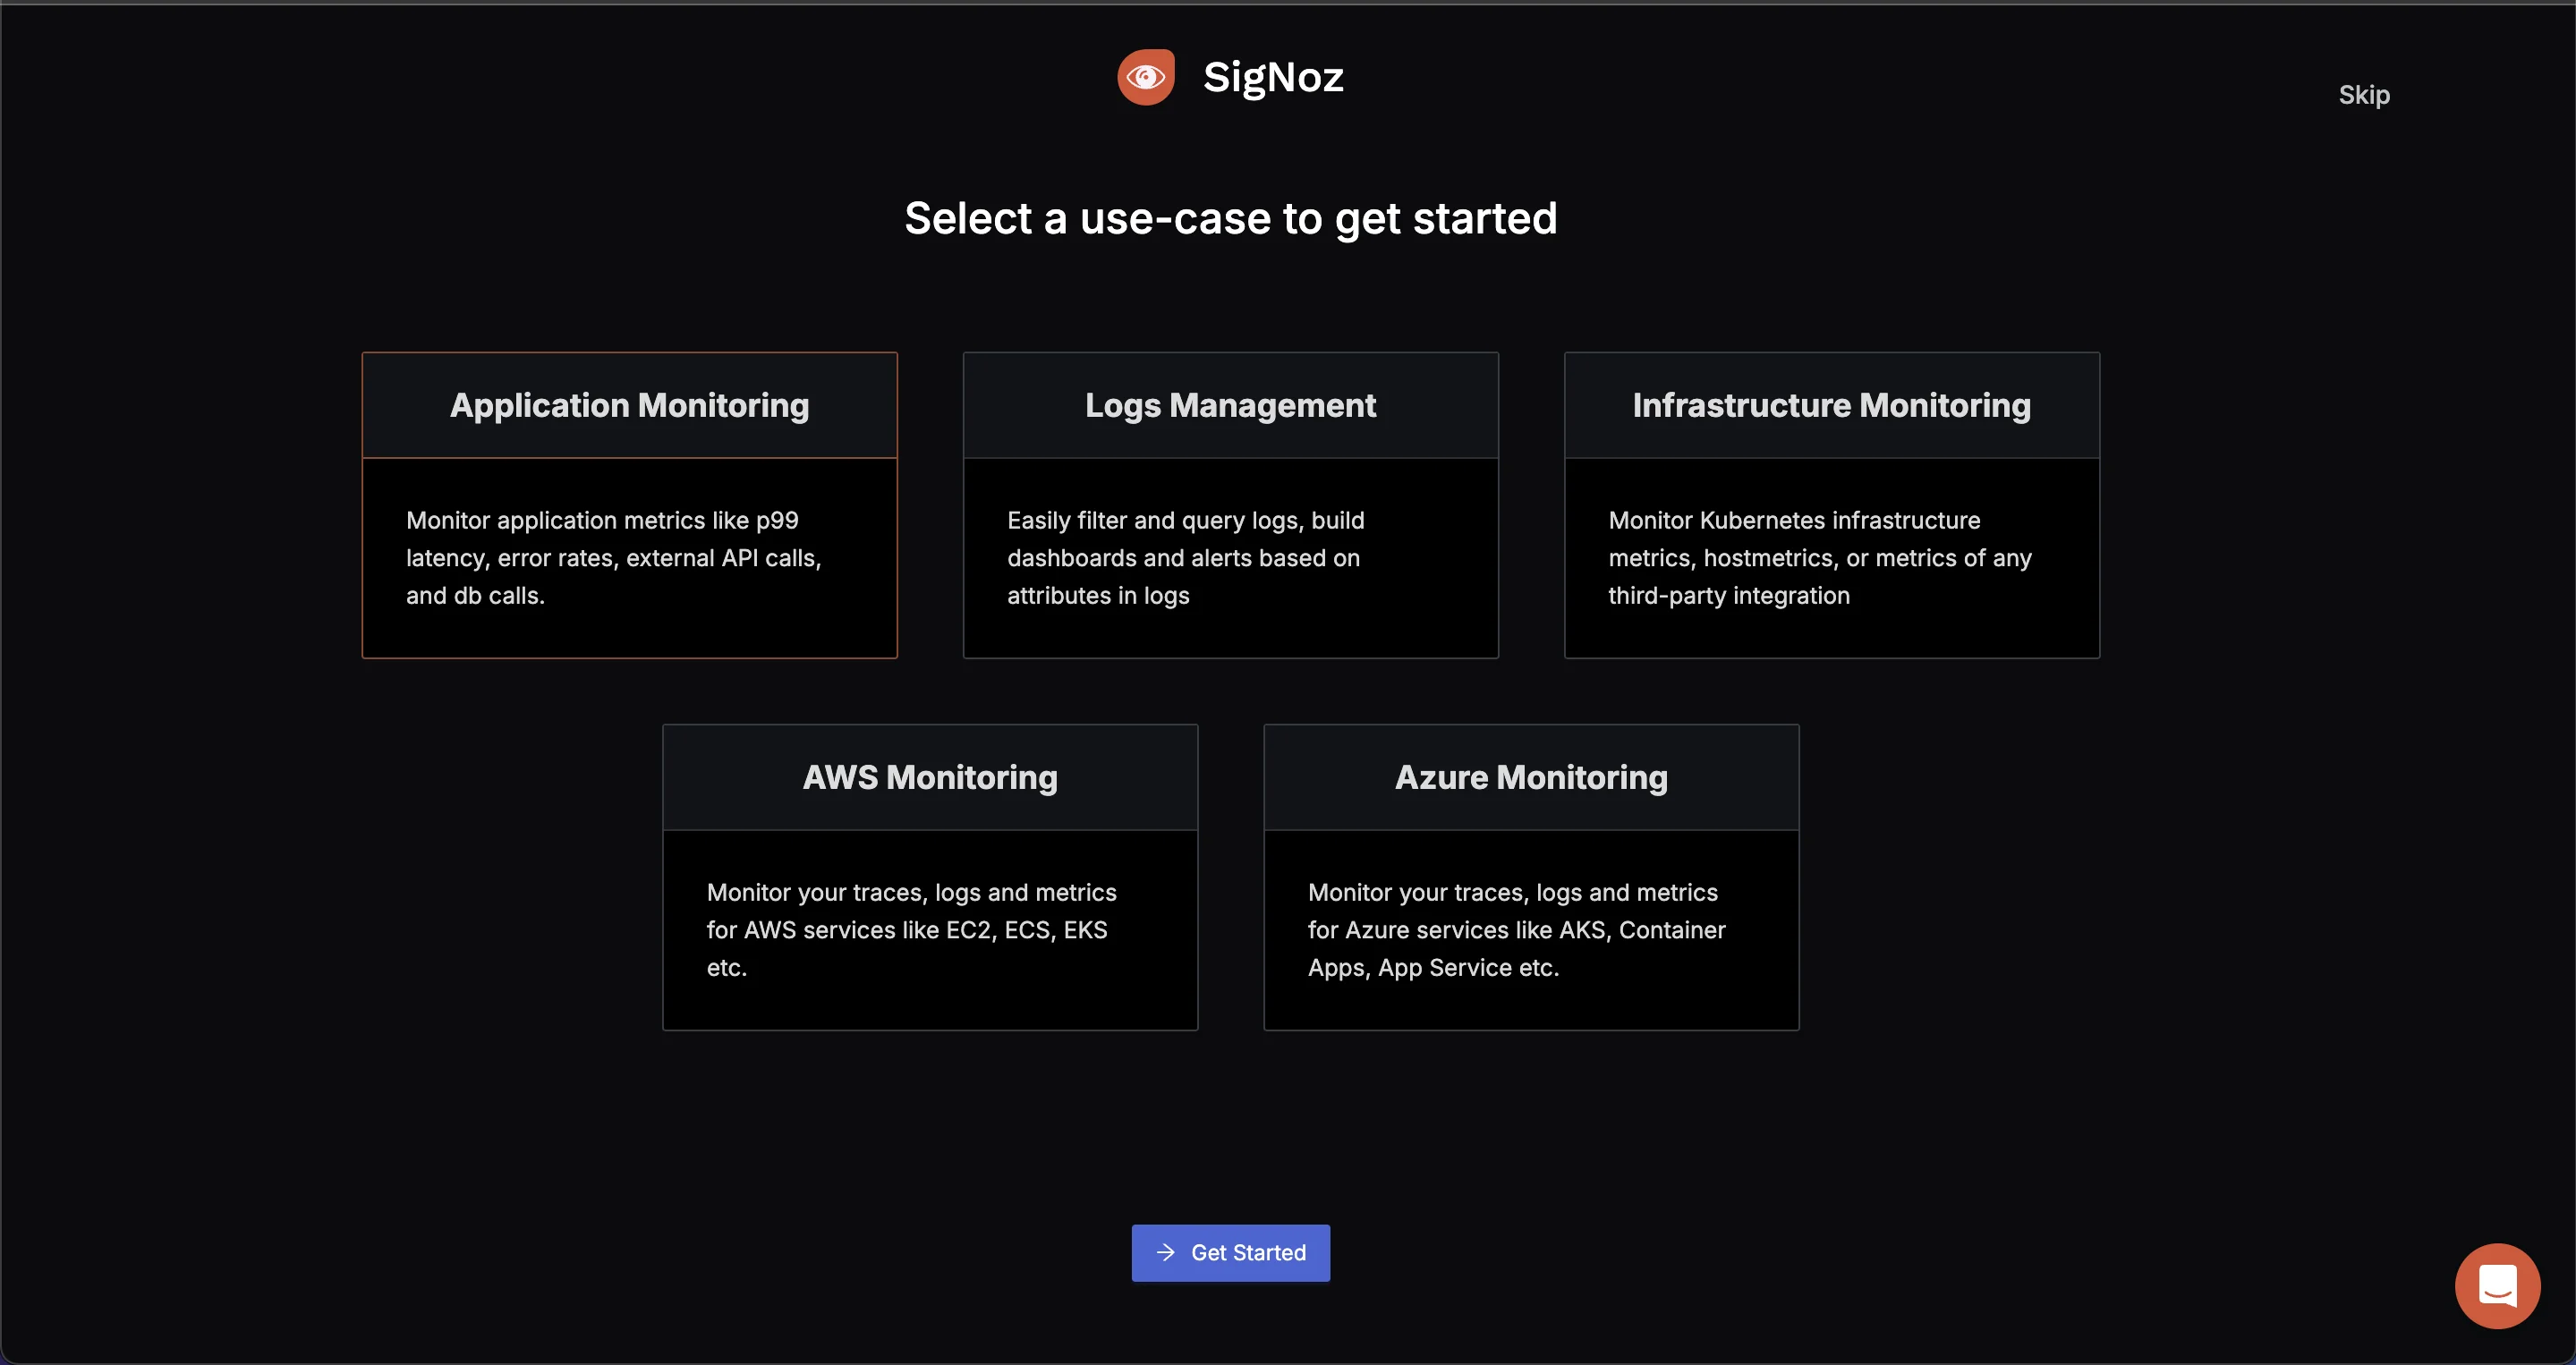
SigNoz Getting Started Select the language and framework of the application We are using a Go Application which we want to monitor. Select
GoYou can write service name as you want, we are using go.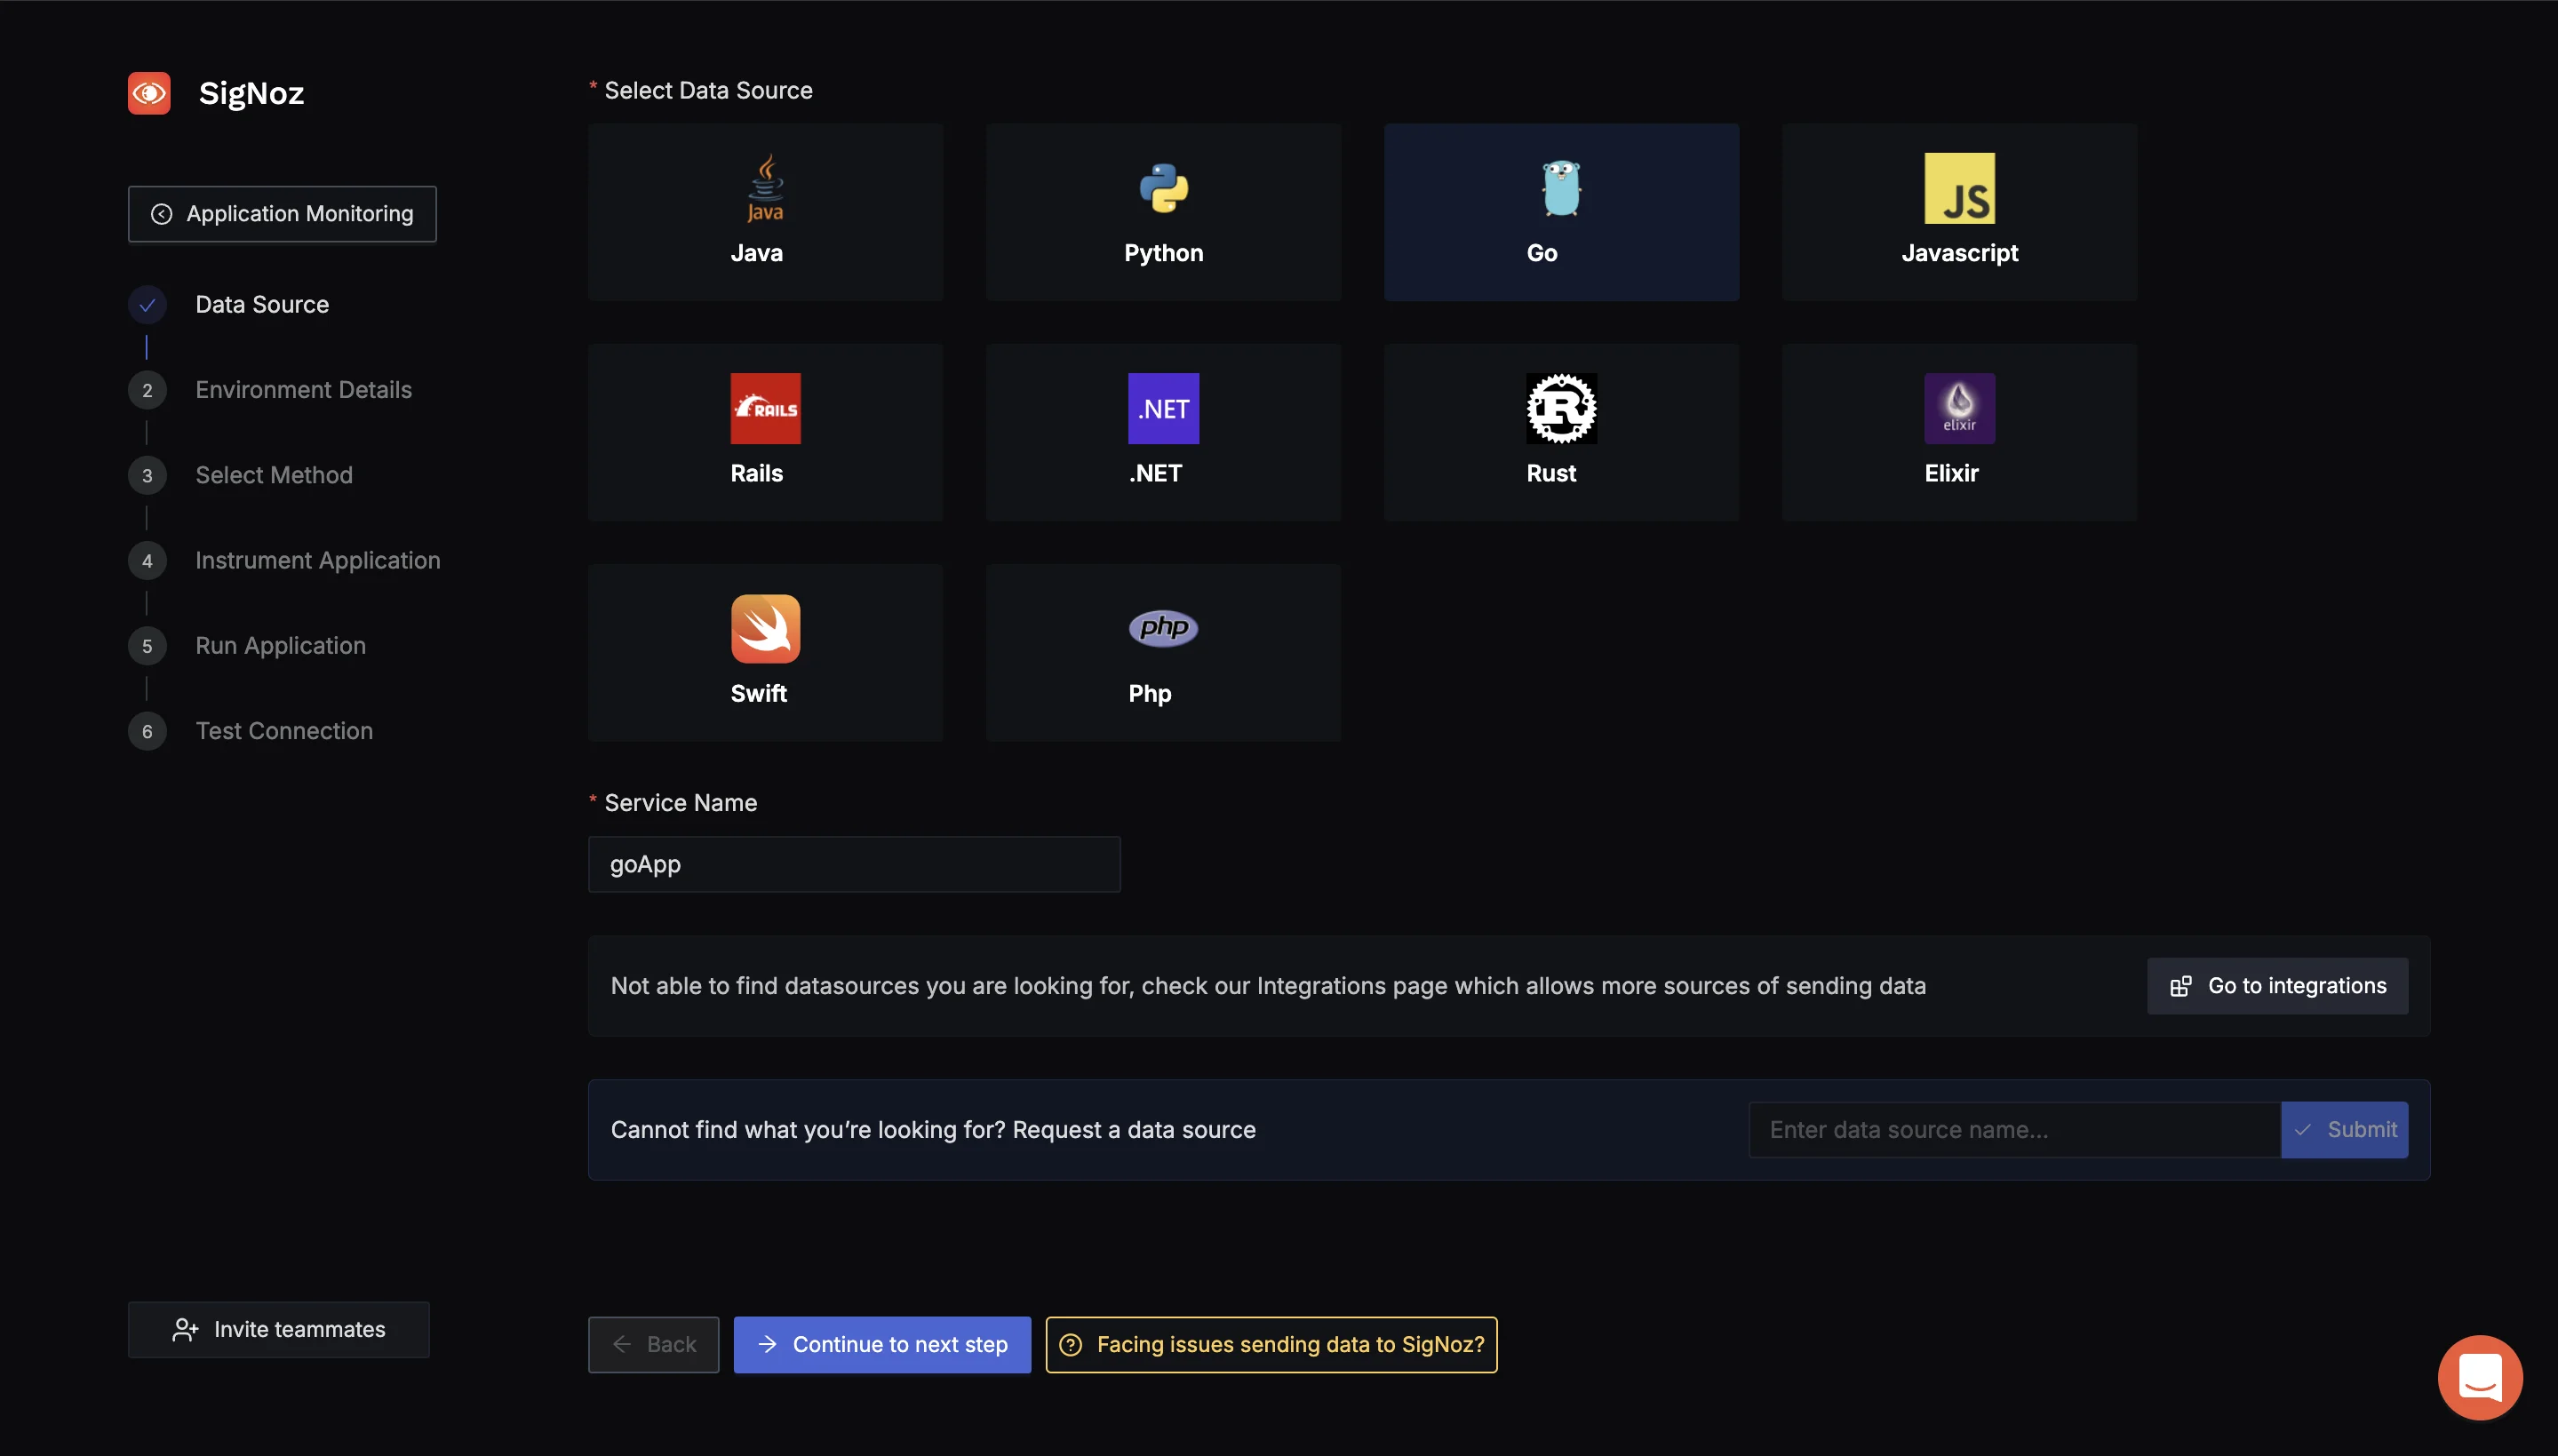
SigNoz Application Monitoring (Select Data Source) Choose environment your app is running on Choose from the environment options that match your setup. Since I'm running this on my Mac, I'm choosing the ARM option.
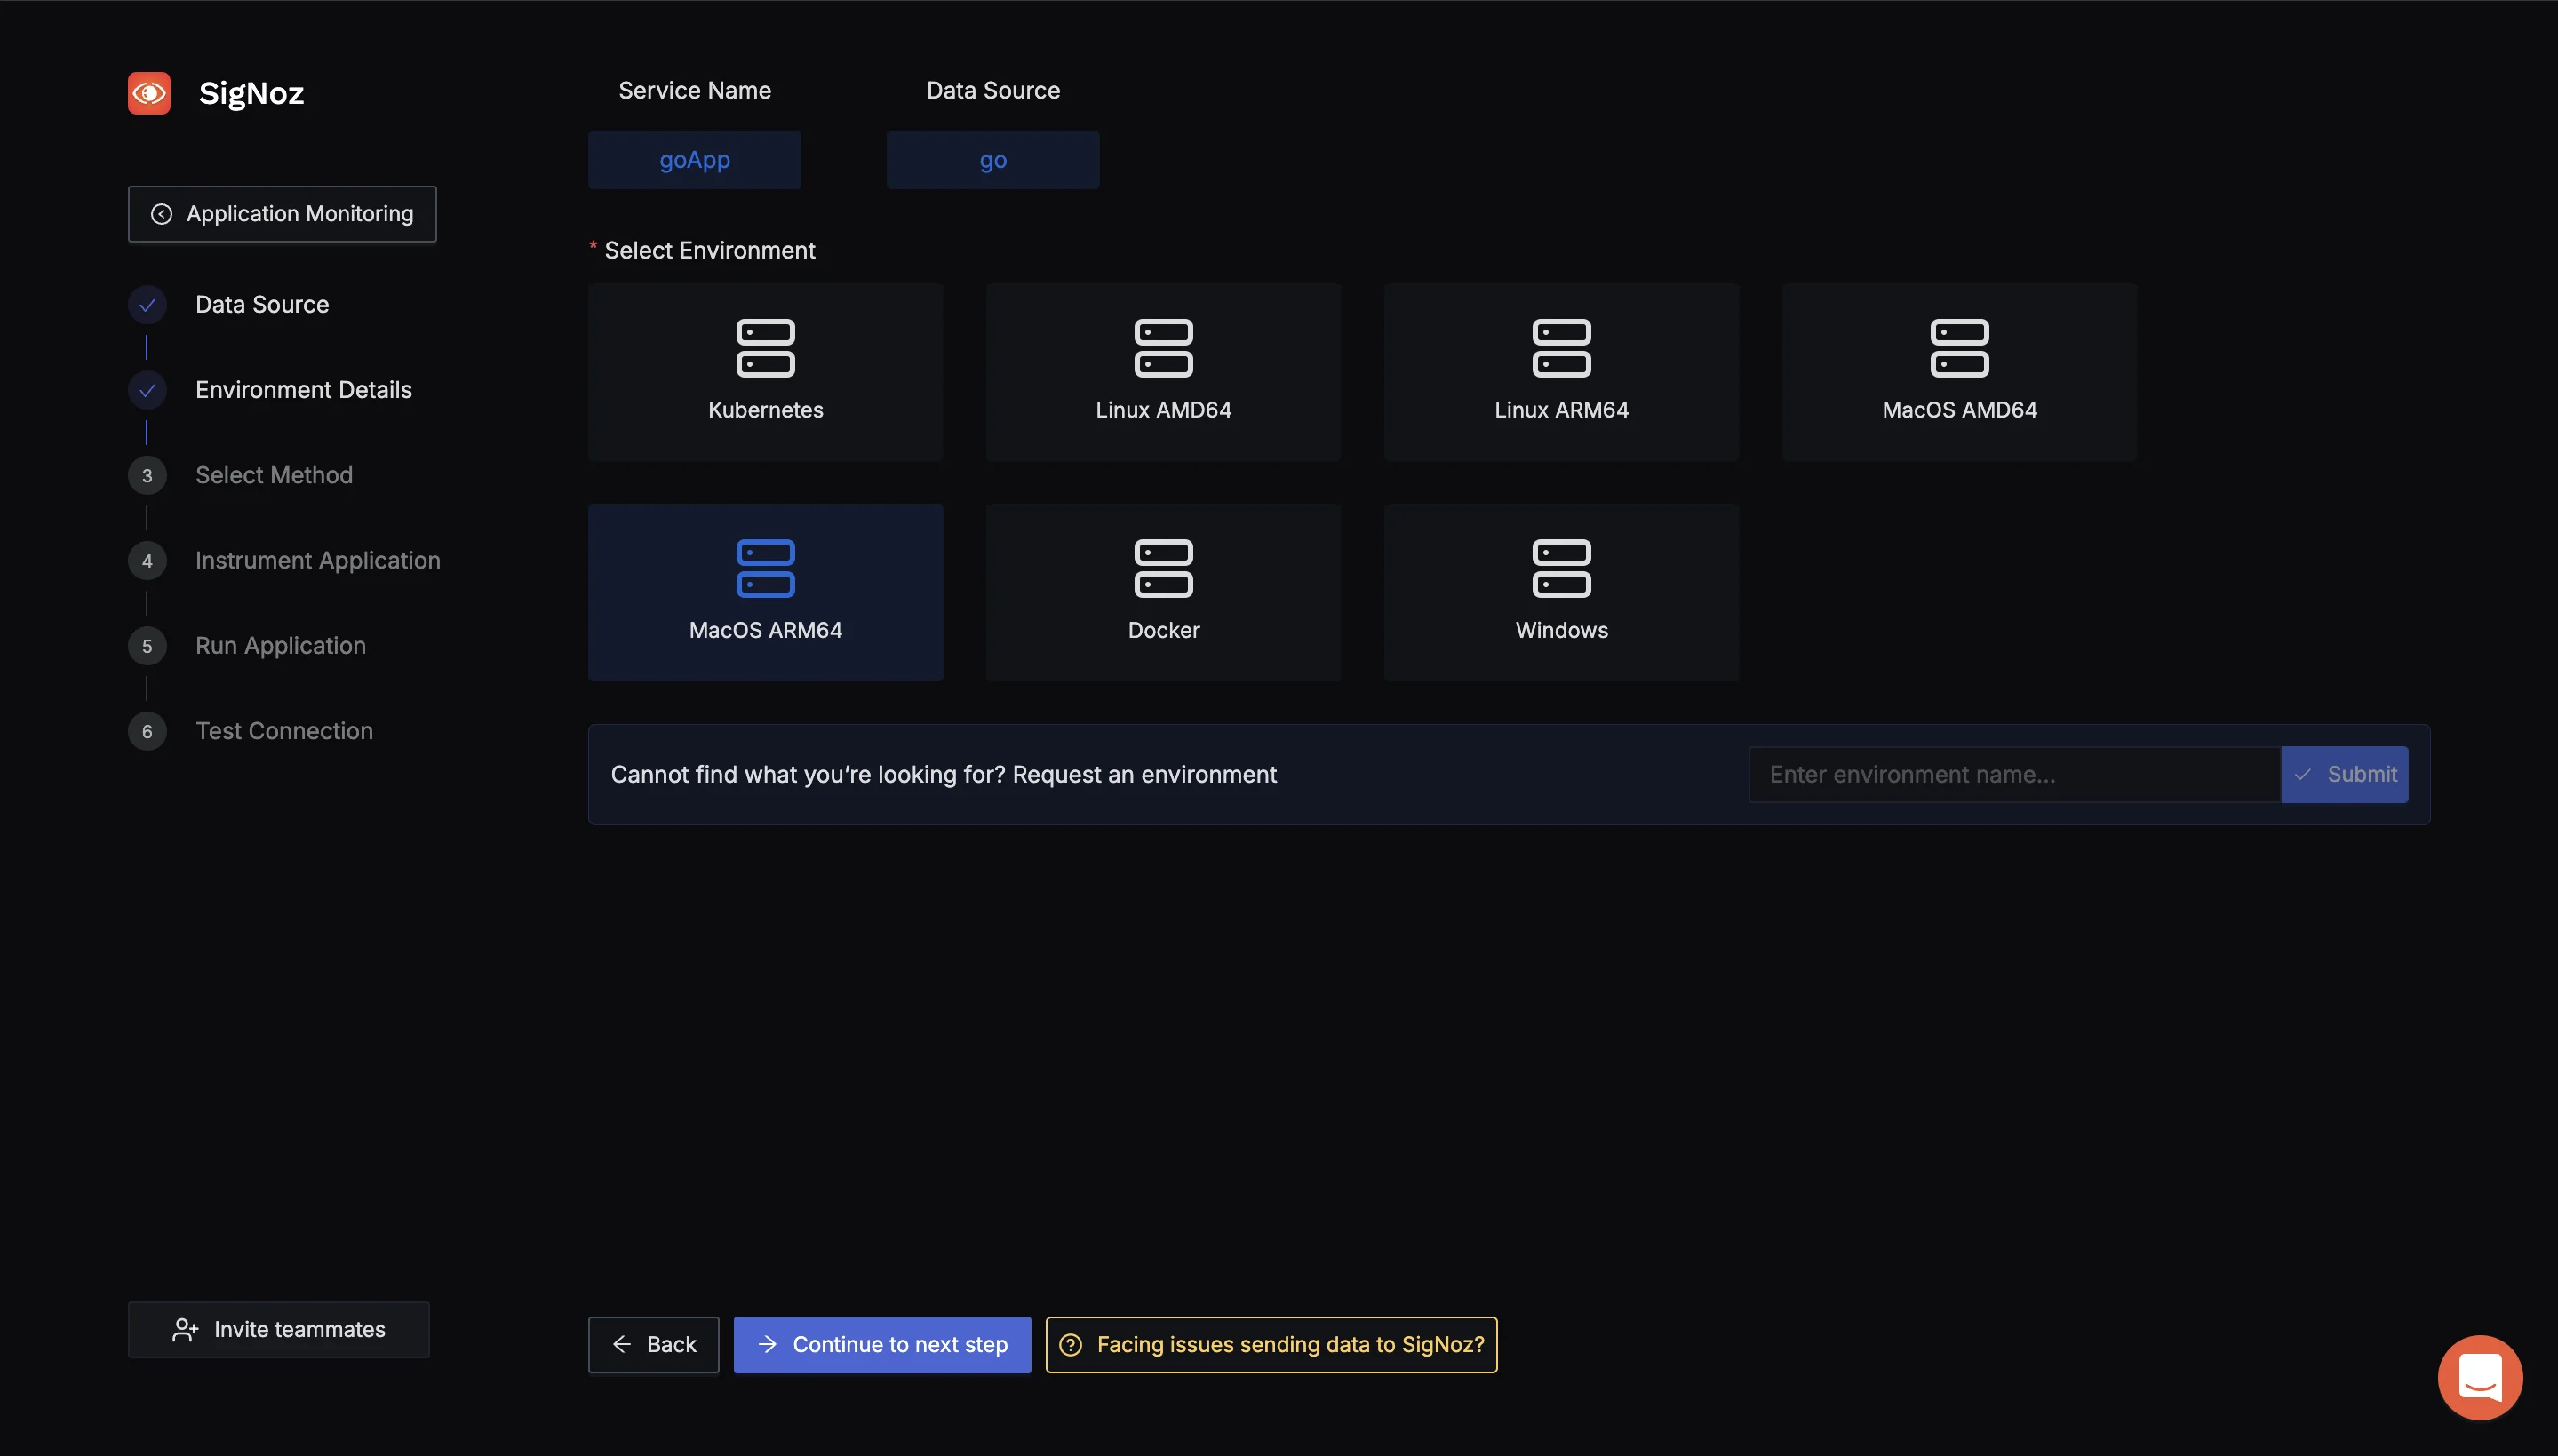
SigNoz Env Details Using OpenTelemtry SDK or Collector to send data to SigNoz To send data to SigNoz, we will use the OpenTelemetry Collector. The OpenTelemetry Collector is a vendor-agnostic service that receives, processes, and exports telemetry data (metrics, logs, and traces) from various sources to various destinations. For more details, visit OpenTelemetry Collector Guide.
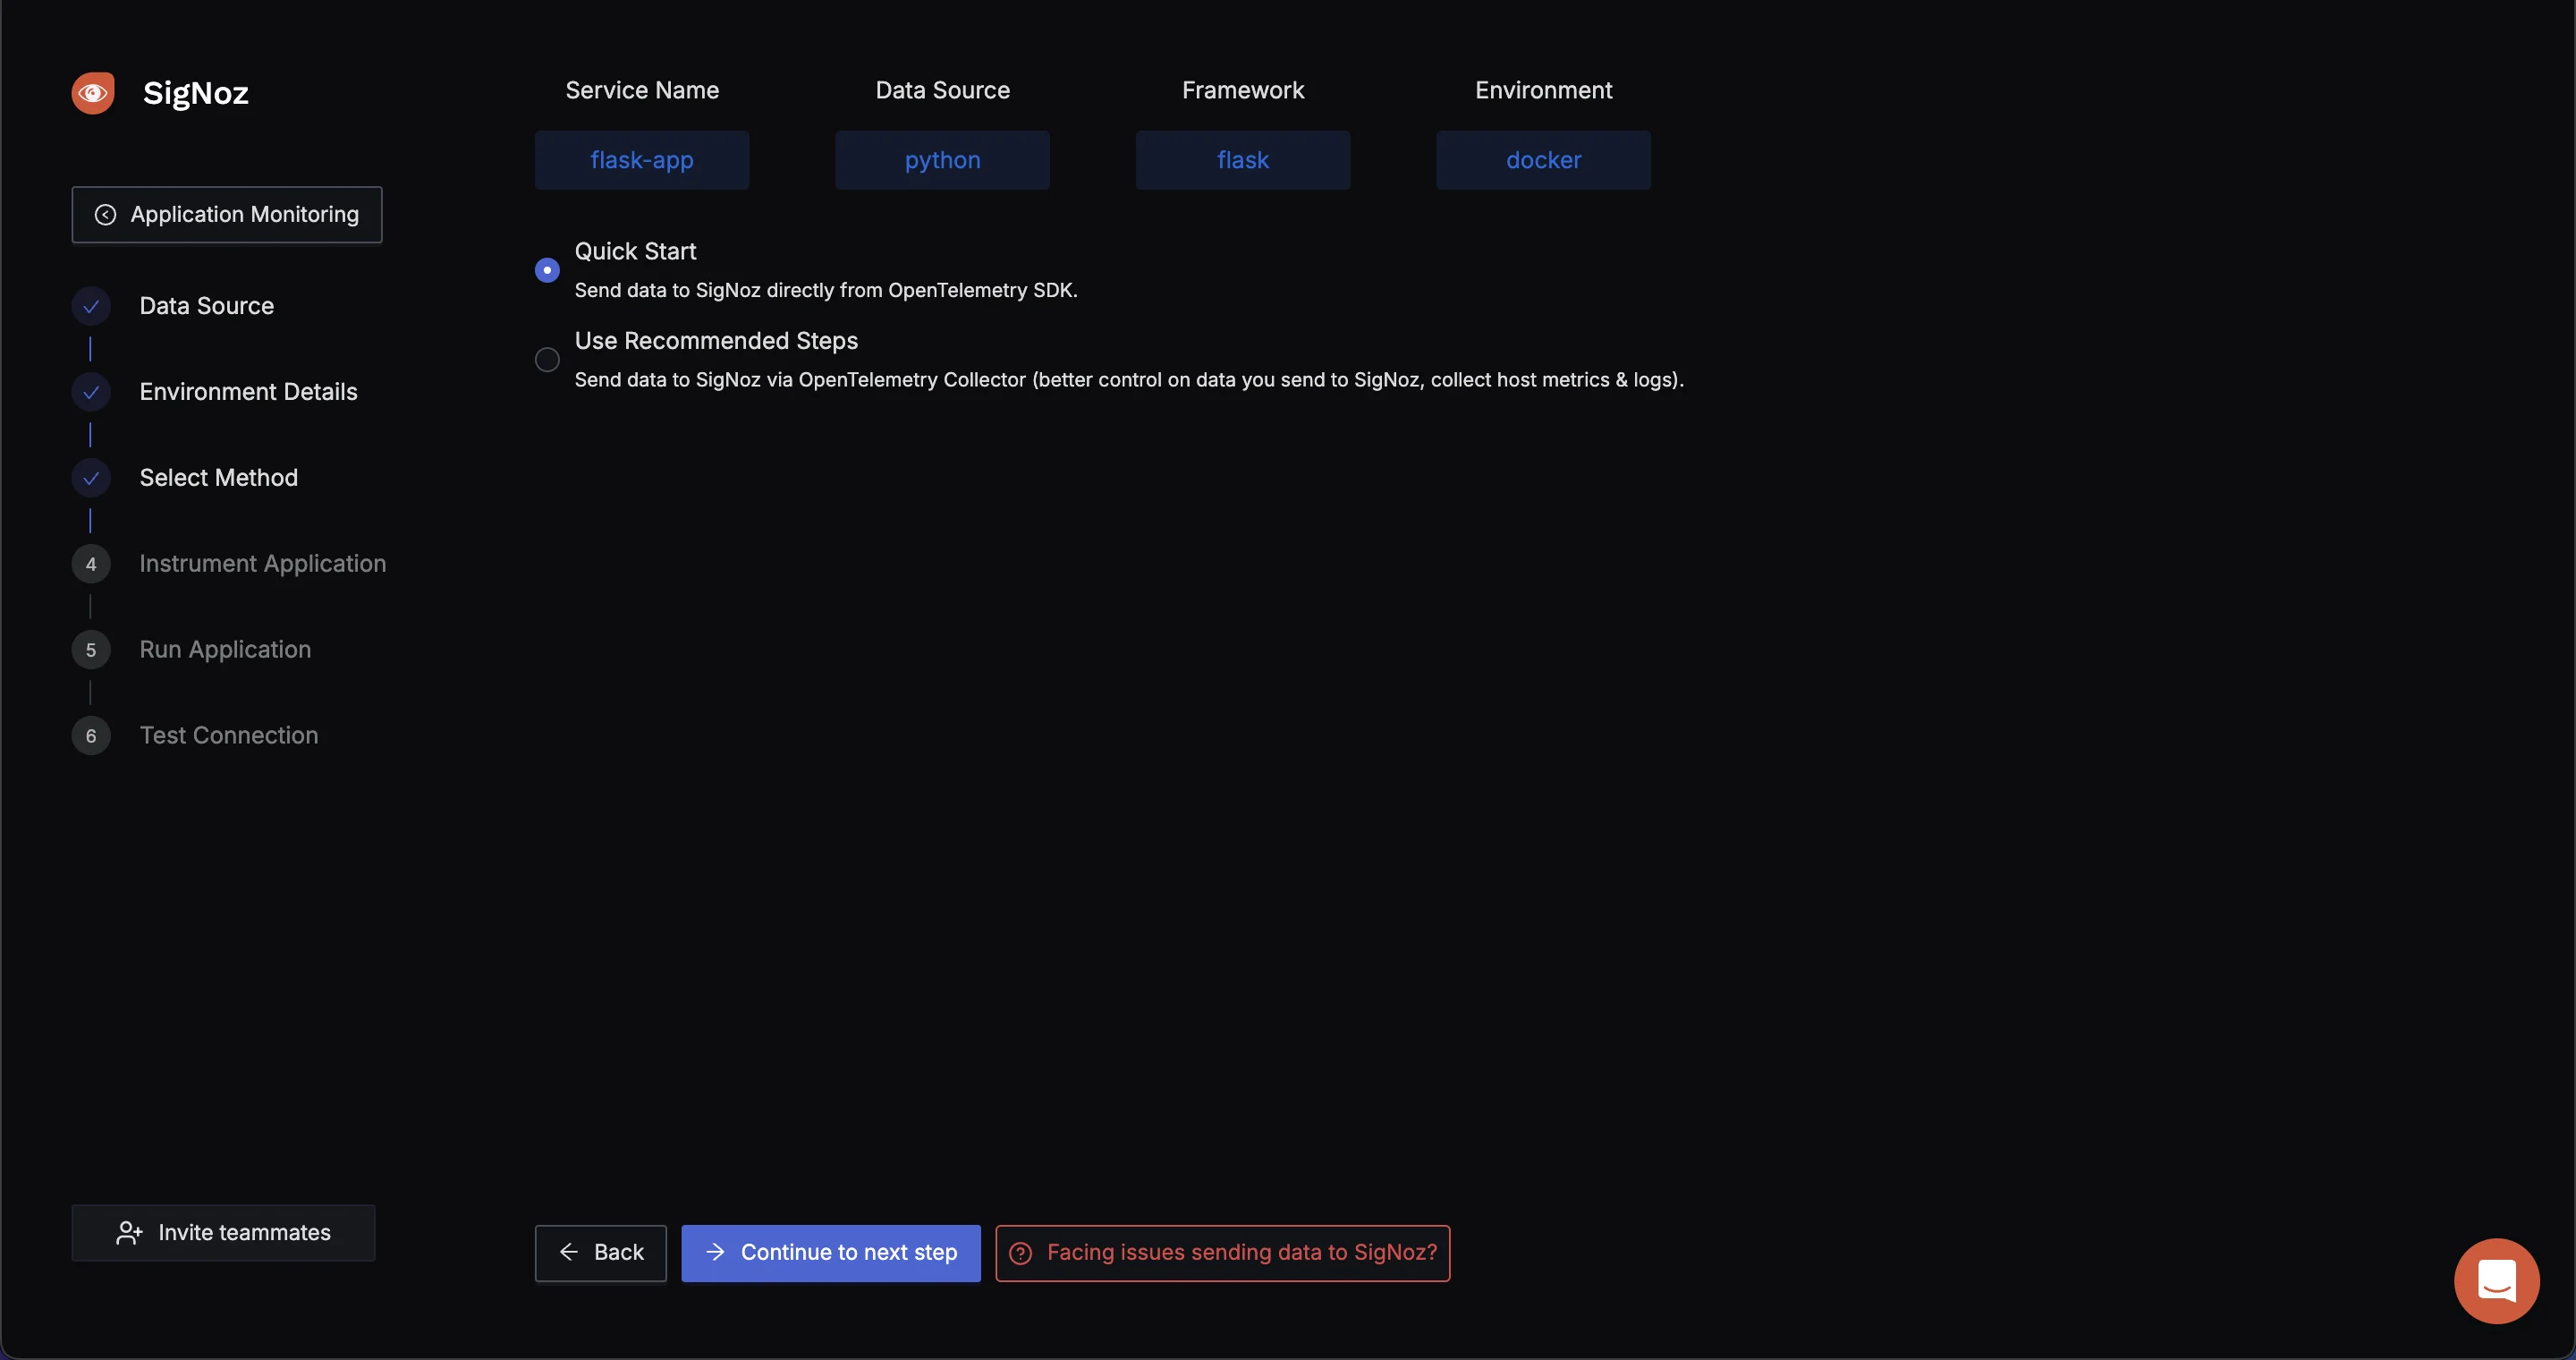
Select the method using to send data to SigNoz OTEL SDK or OTEL Collector to send data. Start Your Application with SigNoz To begin sending telemetry data from your application to SigNoz, use the following command to start your app. This command specifies key configuration details like the service name, access token, and the endpoint for the OpenTelemetry collector.
SERVICE_NAME=goApp INSECURE_MODE=false
OTEL_EXPORTER_OTLP_HEADERS=signoz-ingestion-key=<SIGNOZ-ACCESS_TOKEN-HERE> OTEL_EXPORTER_OTLP_ENDPOINT=ingest.{region}.signoz.cloud:443 go run main.go
Verify Your Application in the SigNoz Dashboard: Once your application is running, navigate to the Services tab in the SigNoz dashboard. If everything is set up correctly, you should see your app listed here. From this tab, you can monitor your app's performance metrics, including latency, error rates, and throughput, gaining valuable insights into how your application is performing in real time
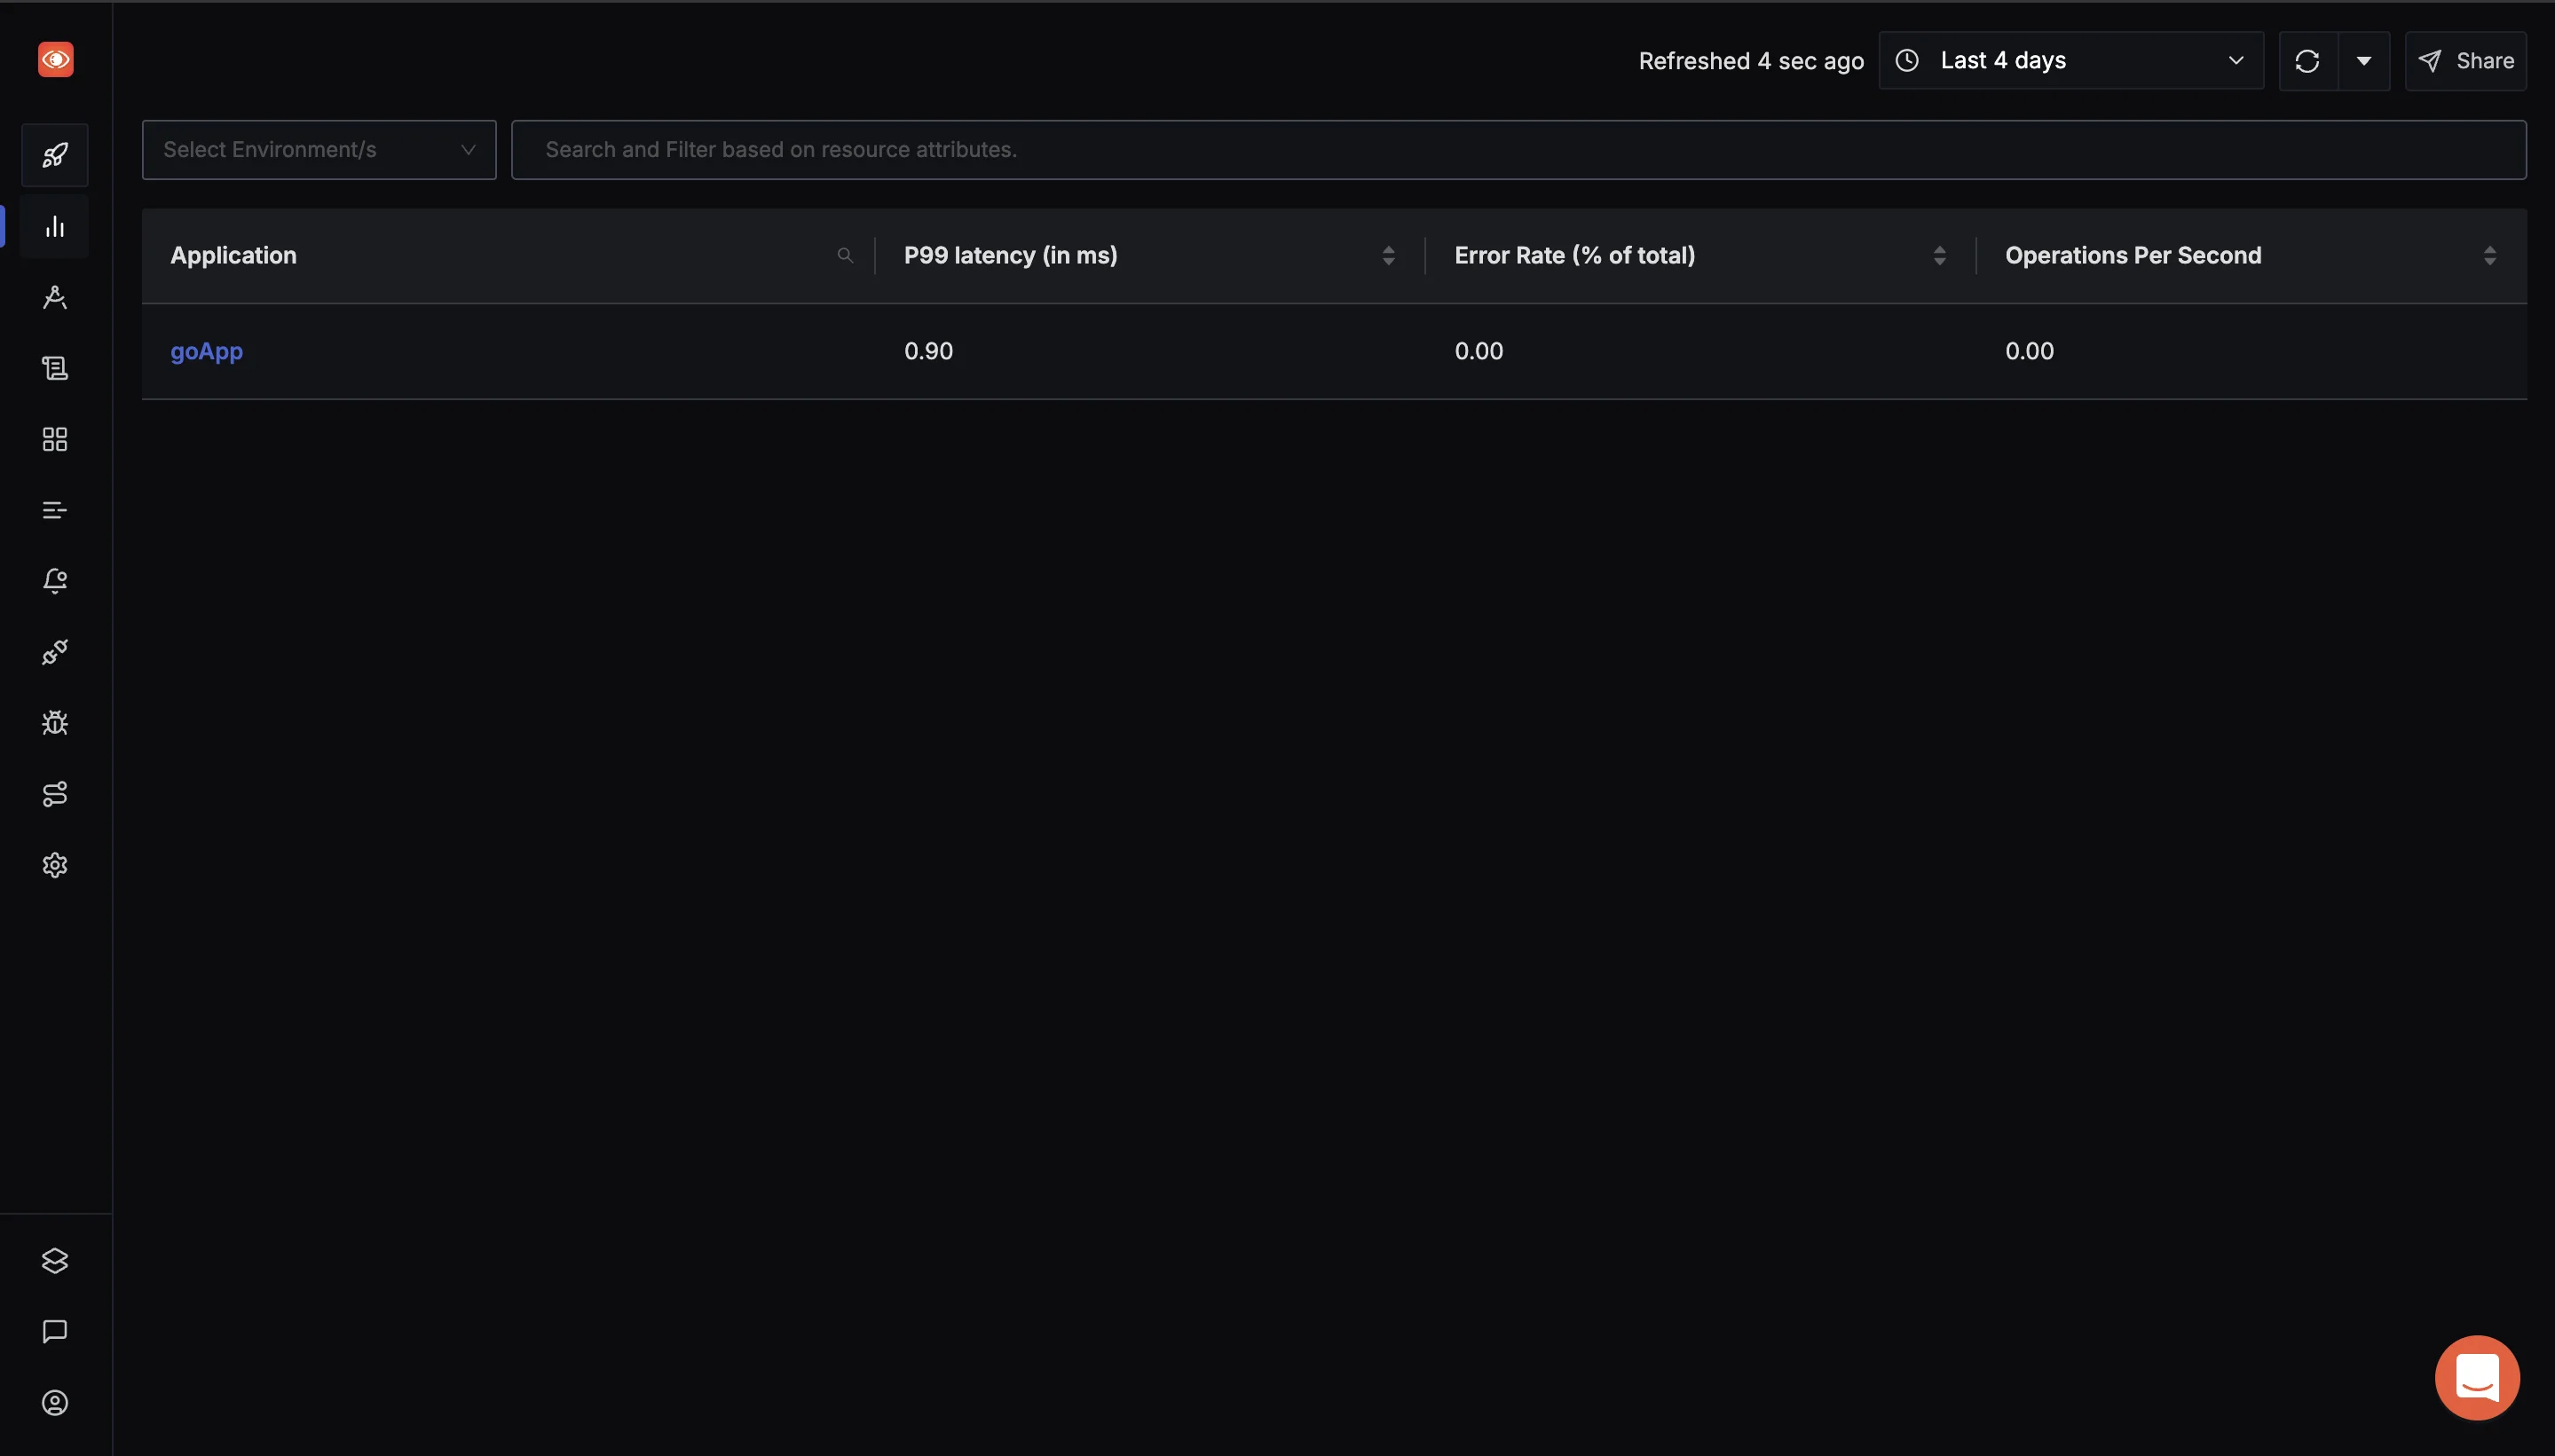
SigNoz Services tab Using
histogram_quantileto Analyze Metrics: Navigate to the Traces section via the sidebar menu in the SigNoz dashboard. In the Search Filter section, input the necessary query expressions. This allows you to filter and analyze specific metrics.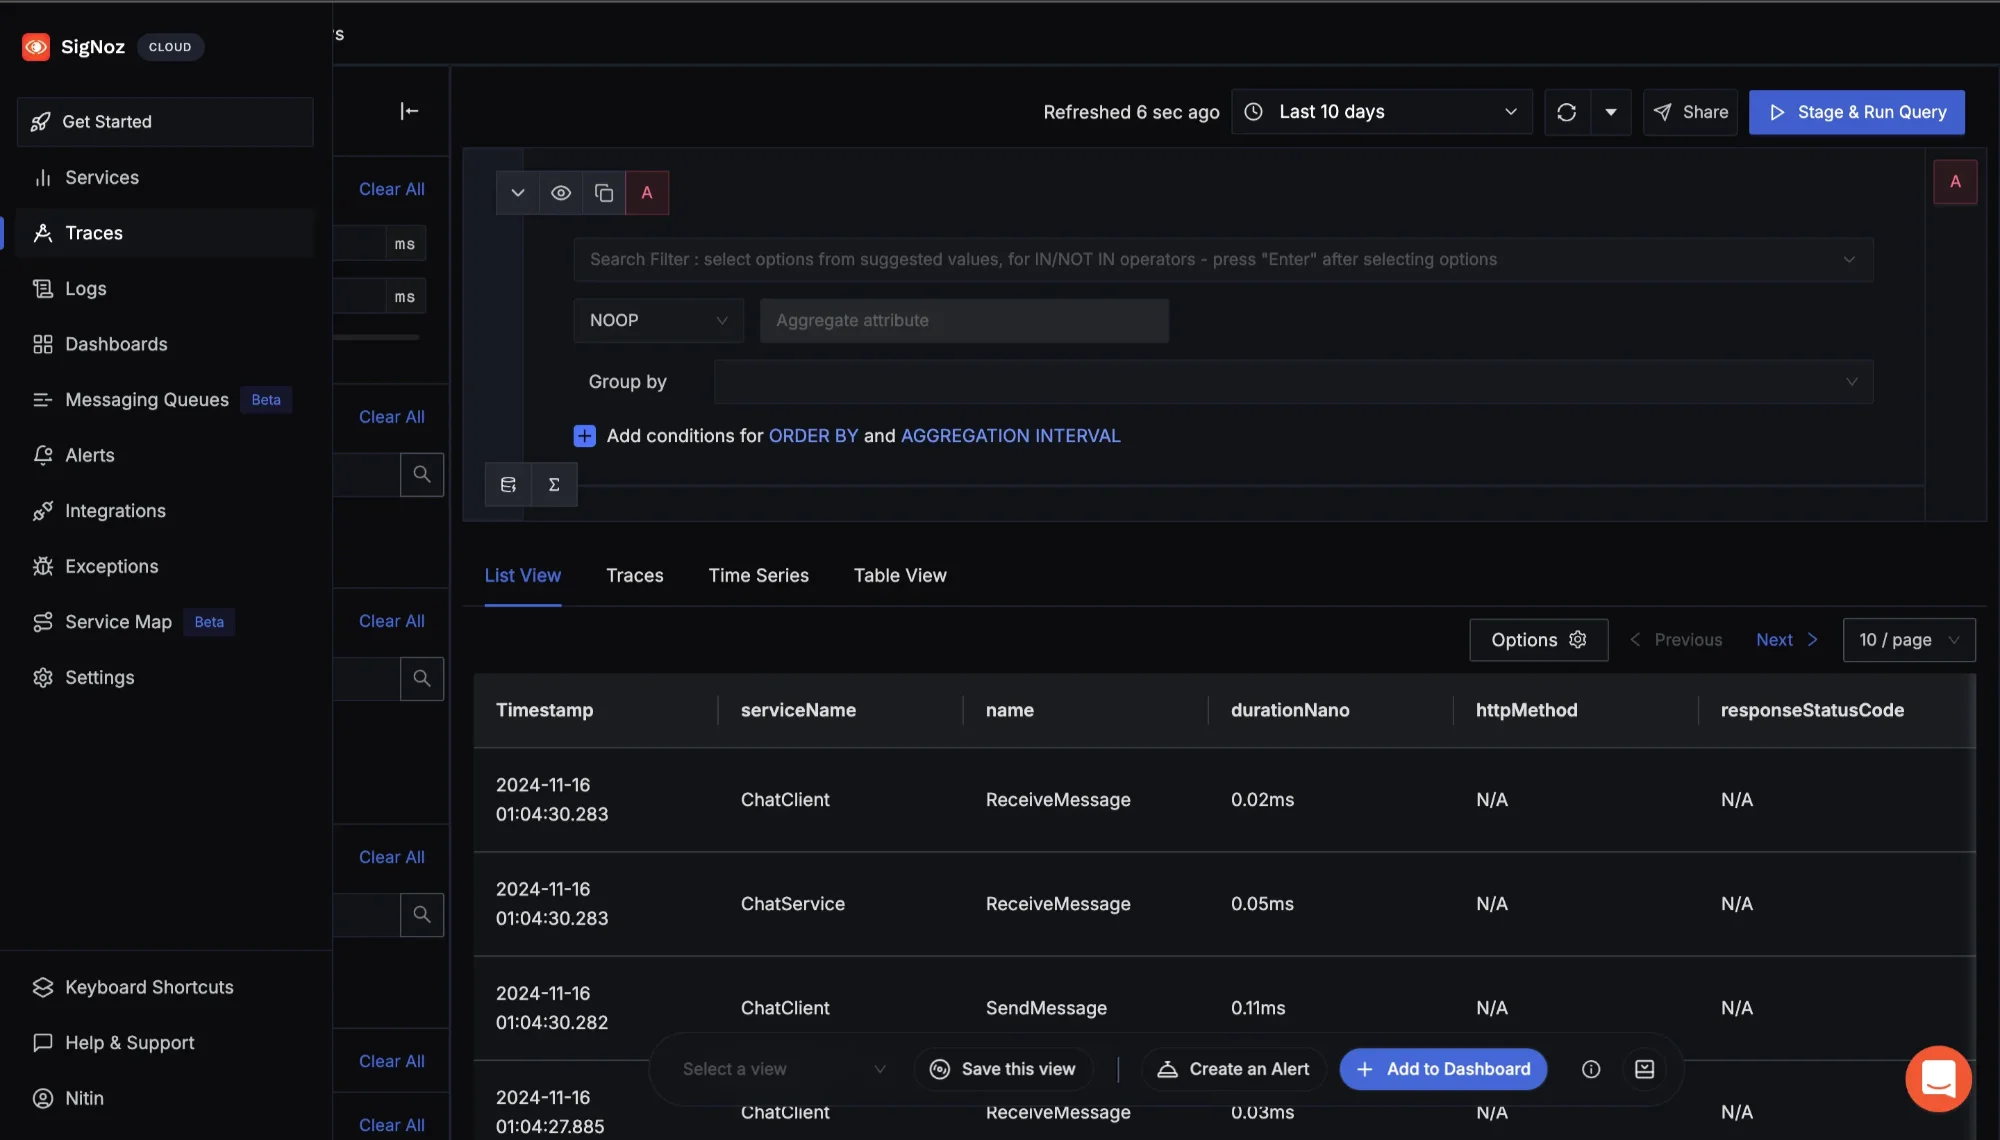
Navigate to Traces to use the Search Filter To calculate a specific quantile (e.g., 90th percentile) for a metric, use a query like the following:
histogram_quantile(0.90, sum(rate(http_request_duration_seconds_bucket[15d])) by (le))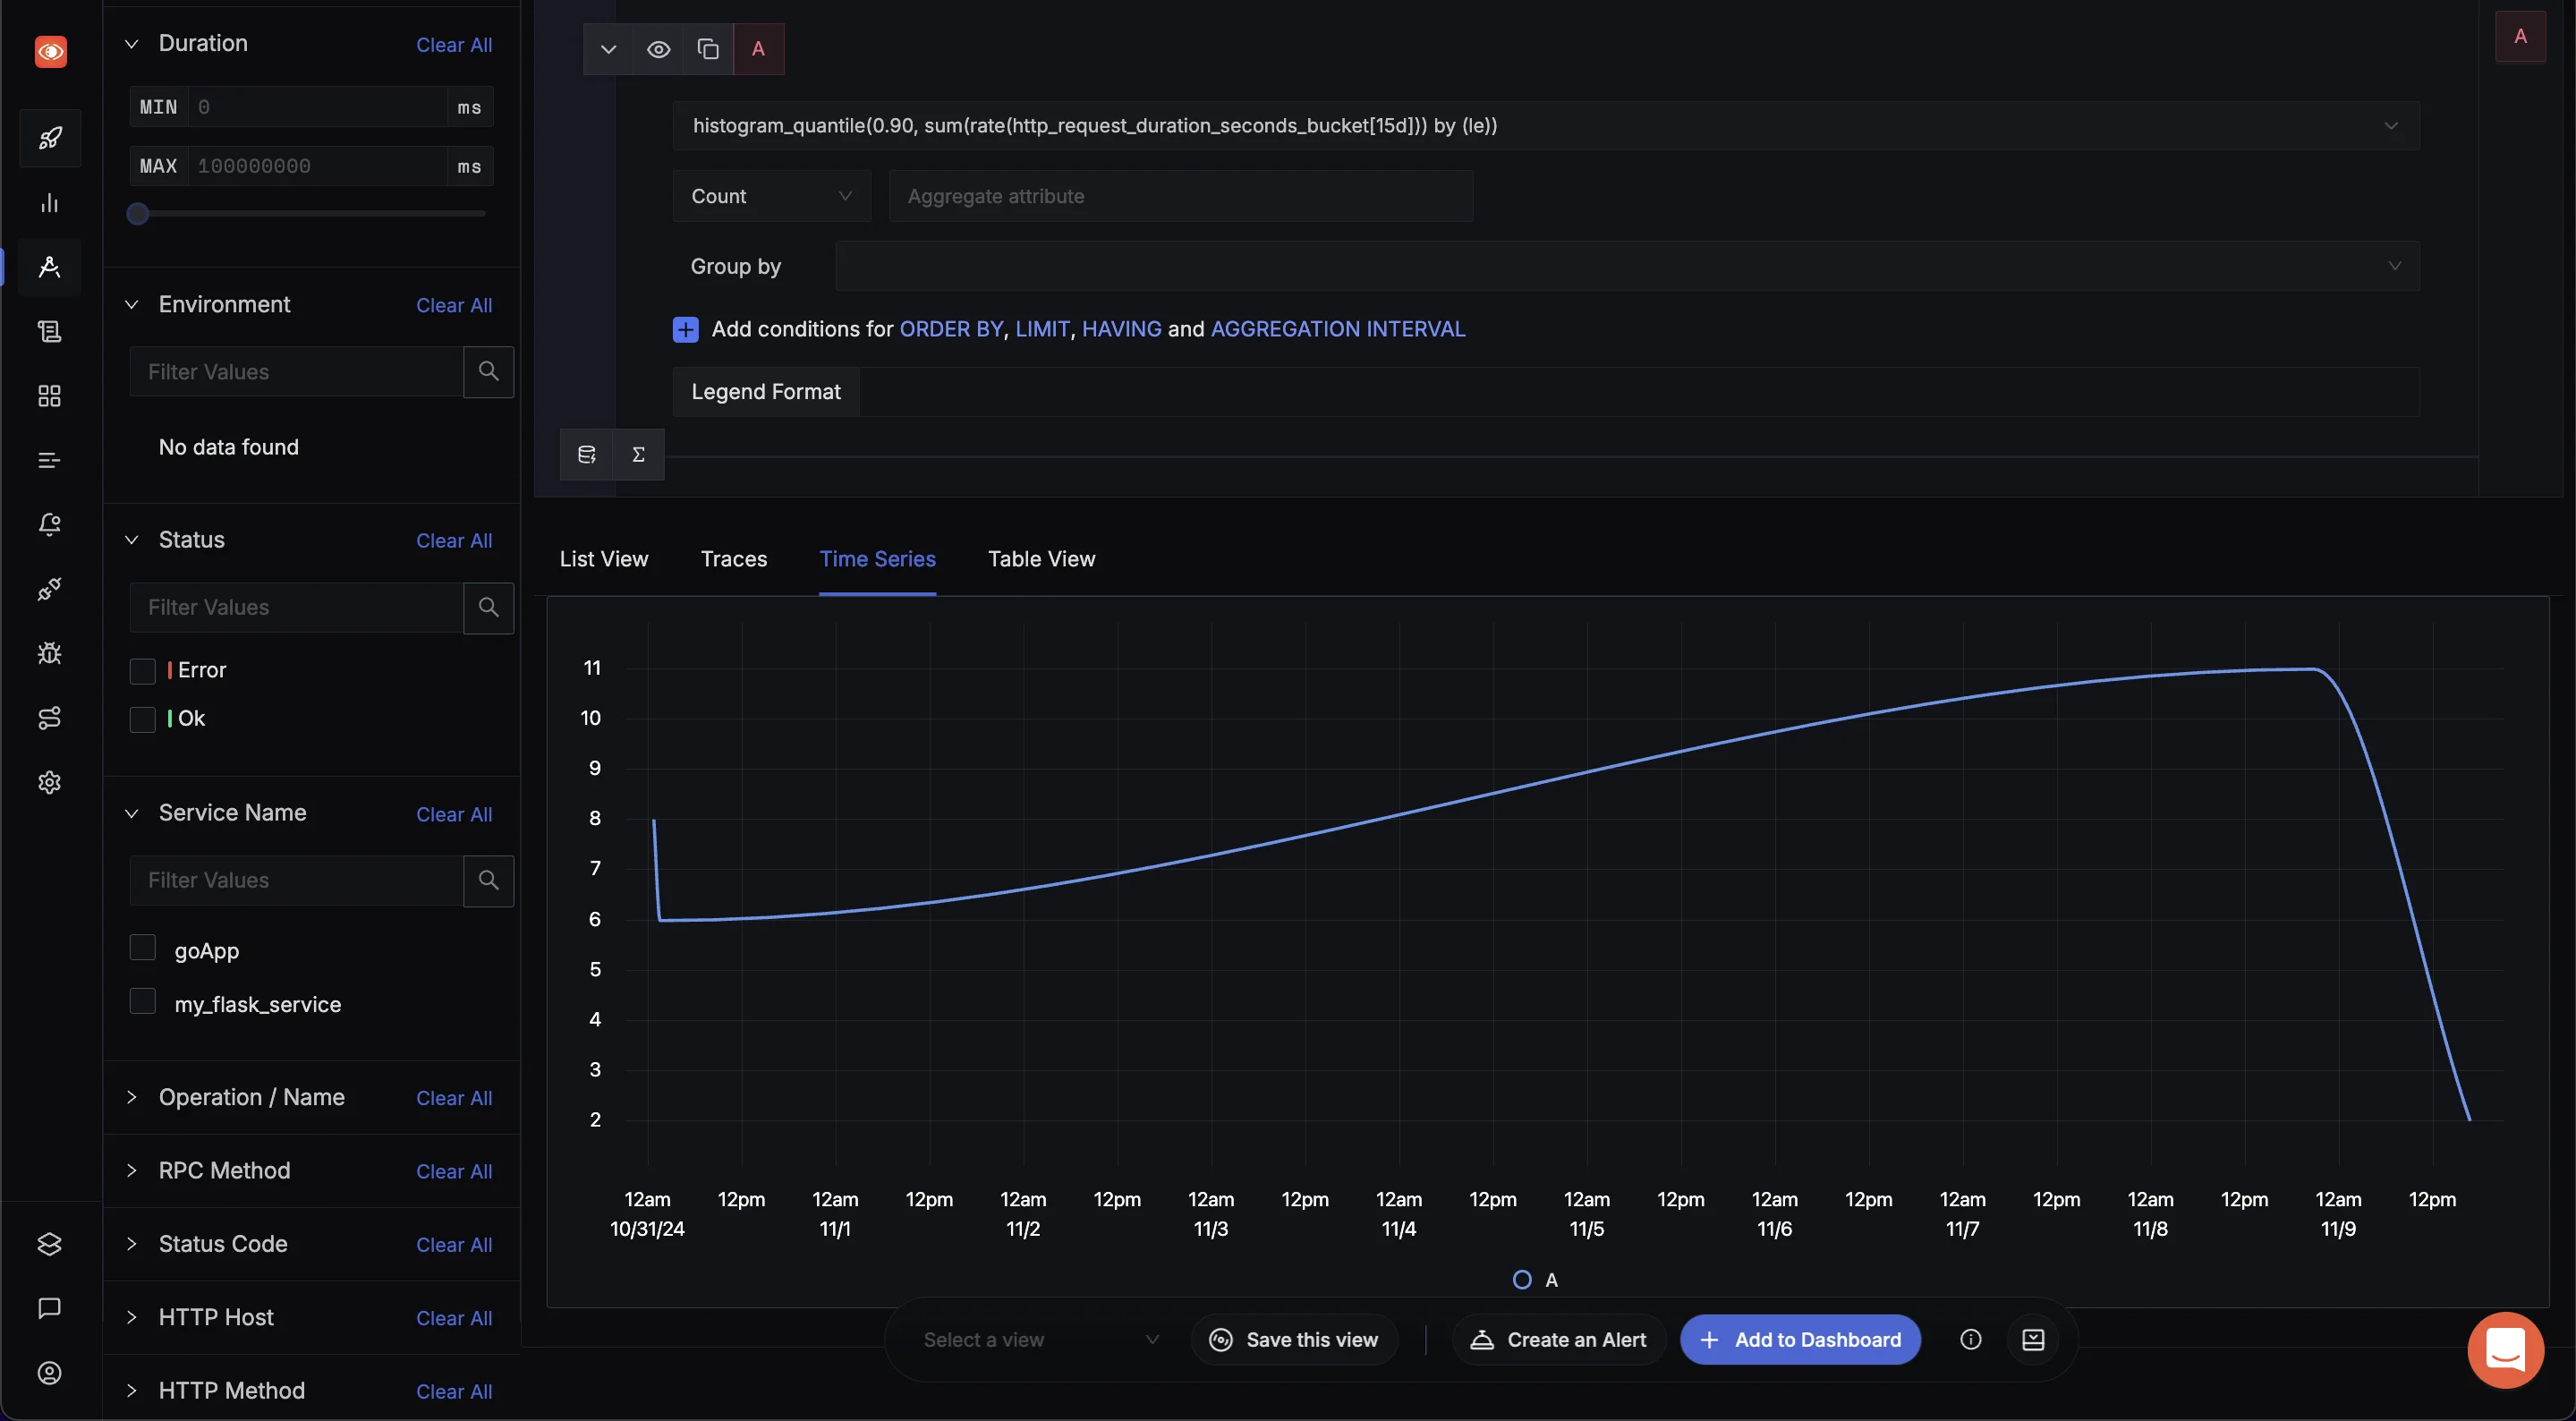
SigNoz Explorers tab This query retrieves the 90th percentile latency over the last 15 days, allowing you to monitor high-latency request patterns and potential performance issues over a longer timeframe. Adjust the quantile or time range (
5m,1d, etc.) to suit the specific behavior you wish to analyze.
By leveraging histogram_quantile, you can gain actionable insights into latency distributions and optimize your application performance efficiently.
SigNoz cloud is the easiest way to run SigNoz. Sign up for a free account and get 30 days of unlimited access to all features.
You can also install and self-host SigNoz yourself since it is open-source. With 19,000+ GitHub stars, open-source SigNoz is loved by developers. Find the instructions to self-host SigNoz.
Best Practices for using histogram_quantile and rate
When using histogram_quantile and rate functions in Prometheus, applying best practices will help you get the most accurate and meaningful insights from your data. Here’s a beginner-friendly guide to optimizing their usage:
Choose Appropriate Time Windows
Time windows define the range over which data is analyzed. Using shorter time windows, such as 1 minute, offers a more granular view of data, capturing rapid changes or spikes in metrics. However, shorter windows can also make data appear noisier, showing more variation that might not reflect long-term trends. For stable insights, consider balancing granularity with smoothness—e.g., 5- or 15-minute windows.
Optimize Query Performance with Recording Rules
If you frequently query certain metrics, using recording rules can speed up response times. Recording rules precompute specific queries and store their results, allowing you to access them faster in dashboards or alerts. For example, if you consistently track the 95th percentile of response times, set up a recording rule to avoid recalculating it each time you access the metric.
Avoid Common Pitfalls
histogram_quantileRequires Histogram Metrics: Thehistogram_quantilefunction is designed specifically for Prometheus histogram metrics, which organize data into configurable "buckets" (ranges). Using it on non-histogram data will lead to inaccurate results. Always verify that your metric is a histogram type before usinghistogram_quantile.- Ensure Sufficient Data Points for Accuracy: Calculating accurate percentiles requires enough data points. For example, in high-traffic applications, calculating a 99th percentile with minimal data might not be meaningful. Monitoring data density can help ensure that your percentiles reliably reflect real behavior.
Create Meaningful Dashboards
To provide a clear view of application performance, it’s best to display multiple percentiles—such as the 50th (median), 95th, and 99th percentiles—in dashboards. This approach gives a comprehensive overview: the median shows typical performance, while higher percentiles reveal the worst-case scenarios users might encounter.
Key Takeaways
- Histograms are essential for analyzing value distributions over time. They organize data into buckets, allowing you to see how frequently certain values occur, which helps identify patterns and anomalies in system performance.
- The
ratefunction calculates the per-second increase of counter metrics, making it crucial for understanding changes in system activity. It helps track metrics like request counts, providing insights into server load. - The
histogram_quantilefunction allows for accurate percentile calculations from histogram data. This enables you to determine thresholds, like the 90th percentile response time, which is vital for assessing service performance and setting service level objectives (SLOs). - Using
rateandhistogram_quantiletogether gives a comprehensive view of system performance over time, helping to monitor both average metrics and their distribution under varying conditions. - Effective use of these functions requires an understanding of their mechanics and limitations. For example, carefully configuring histogram buckets is crucial for accurate data representation, while the
ratefunction is best applied to counters that may reset. Recognizing these nuances will enhance your monitoring strategy.
FAQs
What is the difference between histogram_quantile and rate in Prometheus?
rate calculates the per-second increase of a counter metric, while histogram_quantile computes specific percentiles from histogram data. Typically, rate is used as input for histogram_quantile when analyzing histogram metrics to provide context on how metrics change over time.
How does histogram_quantile calculate percentiles?
histogram_quantile estimates desired percentiles by interpolating between histogram bucket boundaries. It uses the cumulative counts in each bucket to determine where the specified quantile falls, allowing for an accurate representation of the distribution of values.
Can I use histogram_quantile without rate? Why or why not?
While technically possible, using histogram_quantile without rate is generally not recommended for time-series data. The rate function provides a per-second rate, which normalizes the data and accounts for counter resets, making the results more meaningful over time.
What are some common pitfalls when using histogram_quantile in Prometheus queries?
Common pitfalls include:
- Using
histogram_quantileon non-histogram metrics - Having insufficient data points for accurate percentile calculation
- Choosing inappropriate bucket sizes, leading to loss of precision
- Not accounting for the cumulative nature of histogram buckets in calculations
By understanding these potential issues, you can ensure more accurate and reliable results when working with histogram_quantile in your Prometheus queries.

