Understanding and monitoring your network traffic is vital for maintaining security, optimizing performance, and ensuring compliance across all traffic entering and exiting your Virtual Private Cloud (VPC).
In this guide, you will learn about VPC flow logs, how they work, their importance, and limitations. You will also understand what each flow log is comprised of and how they can be created and forwarded to a monitoring tool for analysis.
What are VPC Flow Logs?
VPC flow logs are a network monitoring feature that captures detailed information about the IP traffic entering and leaving your Virtual Private Cloud (VPC). This includes details like source/destination IP addresses, ports, protocols, and data volume.
Flow logs are the source of truth for all network activity in your cloud environment. They help with network troubleshooting, security analysis, and traffic optimization.
How do VPC Flow Logs work?
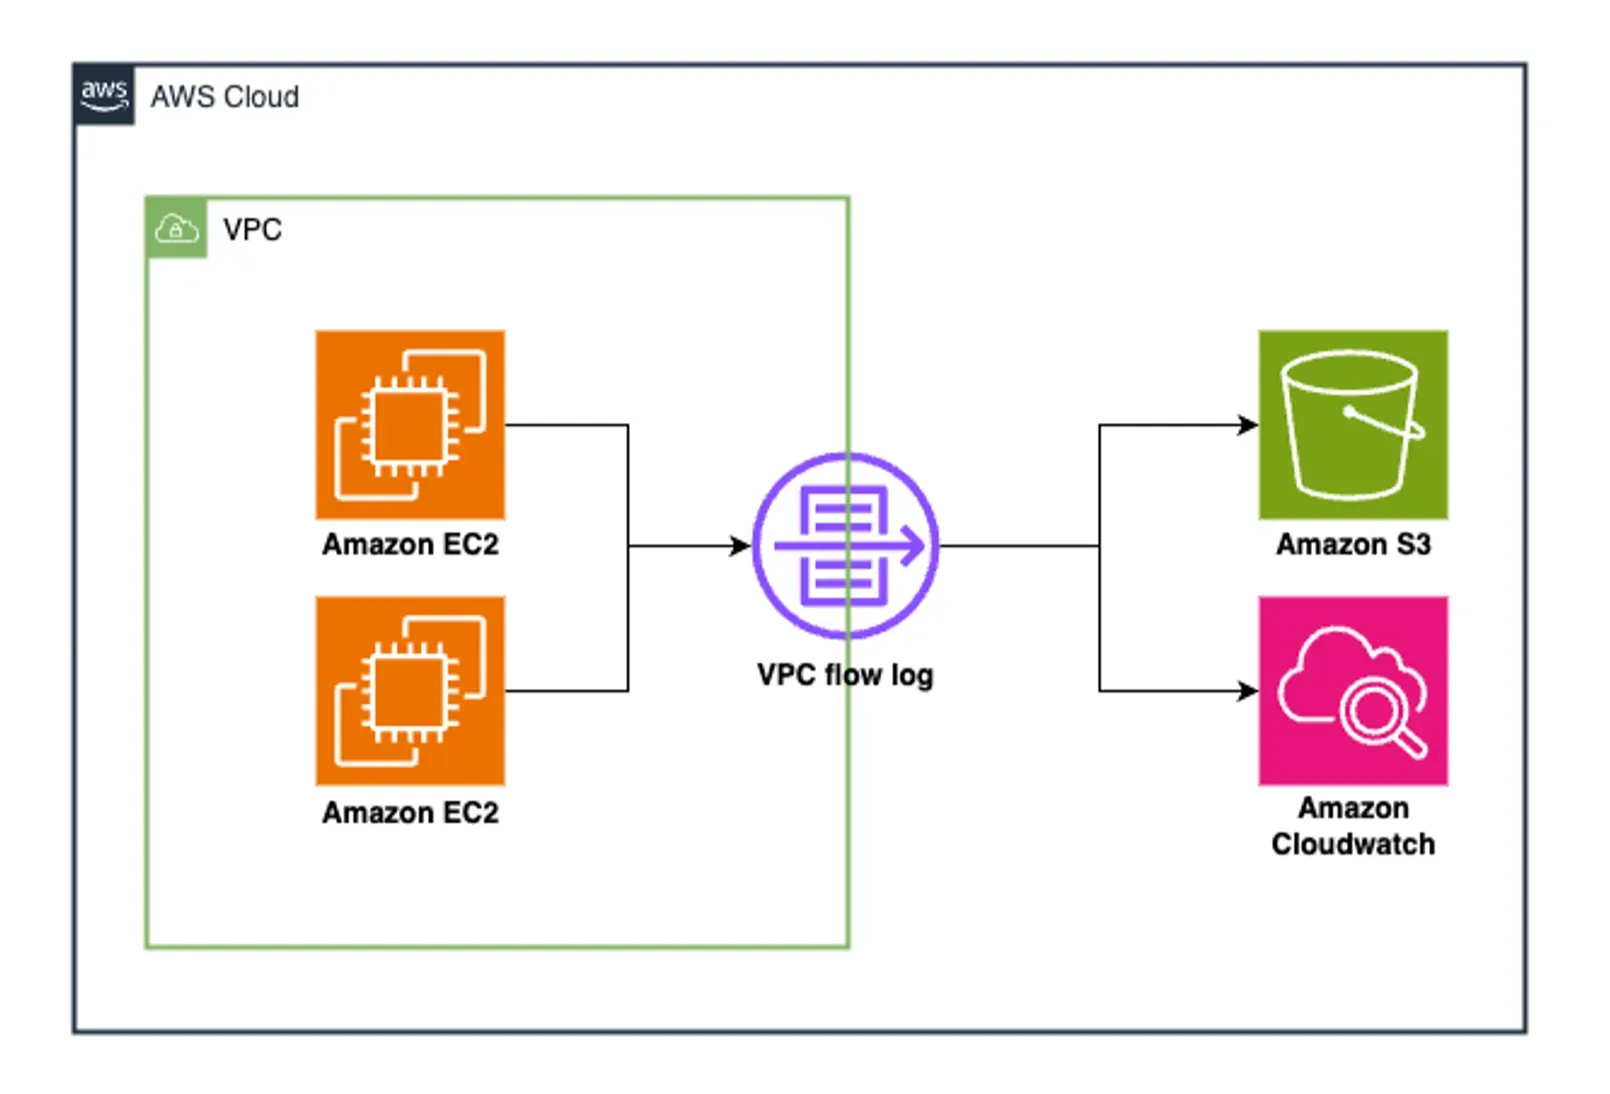
Within a VPC, there are various subnets containing different network interfaces, such as those associated with EC2 instances, Elastic Load Balancers, and other AWS resources. When you enable VPC flow logs, you can configure them to capture metadata—information about the traffic, not the content itself—flowing within the VPC through these network interfaces. This traffic can originate from various sources, including other AWS accounts, VPC peering connections, VPNs, or the internet.
Once the flow logs are enabled, the log data is aggregated and stored in the specified log destination for analysis and retention. Depending on your cloud platform, these are the destinations where the flow log can be stored:
- AWS: Amazon CloudWatch Logs, Amazon S3, or Amazon Kinesis Data Firehose.
- Google Cloud: Cloud Logging.
- Azure: Azure Storage.
Users can create VPC flow logs for an entire VPC, a specific subnet, or an individual network interface. They can also customize the fields captured in the logs to meet their specific needs, such as logging only specific IP ranges or traffic types.
Importance of VPC Flow Logs
There are several benefits VPC flow logs provide in understanding network traffic within your VPC. They include:
- Network Visibility: VPC flow logs provide detailed visibility into the traffic patterns within your Virtual Private Cloud (VPC). This is useful for understanding network behavior and identifying bottlenecks, latency issues, or unexpected traffic flows.
- Security Monitoring: VPC flow logs can help detect potential security threats by capturing and analyzing network traffic. For instance, they can alert you to the use of non-standard ports, requests from known crypto mining domains, and traffic to non-approved DNS servers, which could indicate malicious activities such as attempts to compromise systems or exfiltrate data.
- Troubleshooting and Performance Optimization: VPC flow logs facilitate diagnosing issues with security policies, monitoring traffic reaching instances, and determining the direction of traffic. This information is essential for troubleshooting network problems and optimizing network performance.
- Compliance and Audit Trails: VPC flow logs document network activities and serve as an audit trail for organizations subject to regulatory compliance.
Components of VPC Flow Logs
VPC flow logs provide a comprehensive record of all network traffic within a Virtual Private Cloud (VPC). This record is composed of individual entries called flow log records. Each flow log record offers detailed, structured information about a specific network interaction, including the source and destination IP addresses, ports, protocol, and data transfer volume.
A VPC flow log record follows the below syntax:
<version> <account-id> <interface-id> <srcaddr> <dstaddr> <srcport> <dstport> <protocol> <packets> <bytes> <start> <end> <action> <log-status>
| Version | The version of the flow log format |
|---|---|
| Account-id | The AWS account ID associated with the flow log. |
| Interface-id | The ID of the network interface for which the traffic is recorded. |
| Srcaddr | The source IP address of the traffic. |
| Dstaddr | The destination IP address of the traffic. |
| Srcport | The source port of the traffic. |
| Dstport | The destination port of the traffic. |
| Protocol | The protocol used (e.g., TCP, UDP). |
| Packets | The number of packets transferred. |
| Bytes | The number of bytes transferred. |
| Start | The start time of the flow. |
| End | The end time of the flow. |
| Action | The action taken (e.g., accept, reject). |
| Log-status | The status of the log (e.g., OK, NODATA). |
Example of a VPC flow log record:
2 123456789012 eni-abcdef01 10.0.1.1 203.0.113.5 54321 80 TCP 10 3456 1510868790 1510868850 ACCEPT OK
A complete VPC flow log would include multiple flow log records, typically in a tabular format:
version account-id interface-id srcaddr dstaddr srcport dstport protocol packets bytes start end action log-status
2 901660615925 eni-00257d510cfc77a72 74.82.47.48 10.0.12.216 34888 123 17 1 40 1718806751 1718806806 REJECT OK
2 901660615925 eni-00257d510cfc77a72 80.75.212.75 10.0.12.216 34752 25836 6 1 40 1718806751 1718806806 REJECT OK
2 901660615925 eni-00257d510cfc77a72 212.70.149.34 10.0.12.216 51989 8099 6 1 40 1718806751 1718806806 REJECT OK
2 901660615925 eni-00257d510cfc77a72 91.189.91.157 10.0.12.216 123 40995 17 1 76 1718806751 1718806806 ACCEPT OK
Limitations of VPC Flow log
While VPC flow logs provide valuable insights into network traffic, there are several important limitations you should be aware of:
- Unsupported Traffic Types: VPC flow logs do not capture all types of traffic. For example, they do not log traffic generated by instances when they contact the Amazon DNS server, nor do they log traffic to and from 169.254.169.254 for instance metadata.
- Packet Data: VPC flow logs capture metadata about IP traffic but do not capture the actual packet payload. This means you can't inspect the contents of the packets.
- Immutable Configuration: Once a flow log is created, its settings and log record format cannot be modified. Any necessary changes require setting up a new flow log.
- VPC Peering: Flow logs cannot be enabled for VPCs peered with your VPC unless the peered VPC resides within your own account.
These are a few of the flow log limitations. If you want to see a complete list of the limitations, you can visit the AWS documentation.
How to Create VPC Flow Logs
VPC Flow logs can be created across different cloud platforms. In this tutorial, you will learn how to create them specifically in AWS.
Prerequisites
- An AWS account with Admin privileges
- A SigNoz cloud account
Create/Configure the S3 Bucket
As stated earlier, VPC flow logs can be stored in Amazon CloudWatch Logs, Amazon S3, or Amazon Kinesis Data Firehose. In this tutorial, Amazon S3 will be utilized as the storage medium, so you need to create an S3 bucket.
An S3 bucket is an Amazon S3 storage service that acts as a container for storing objects, which can be any type of data such as files, images, videos, or documents. This bucket will be used to house the VPC flow logs that will later be created.
To create an s3 bucket, follow the below steps:
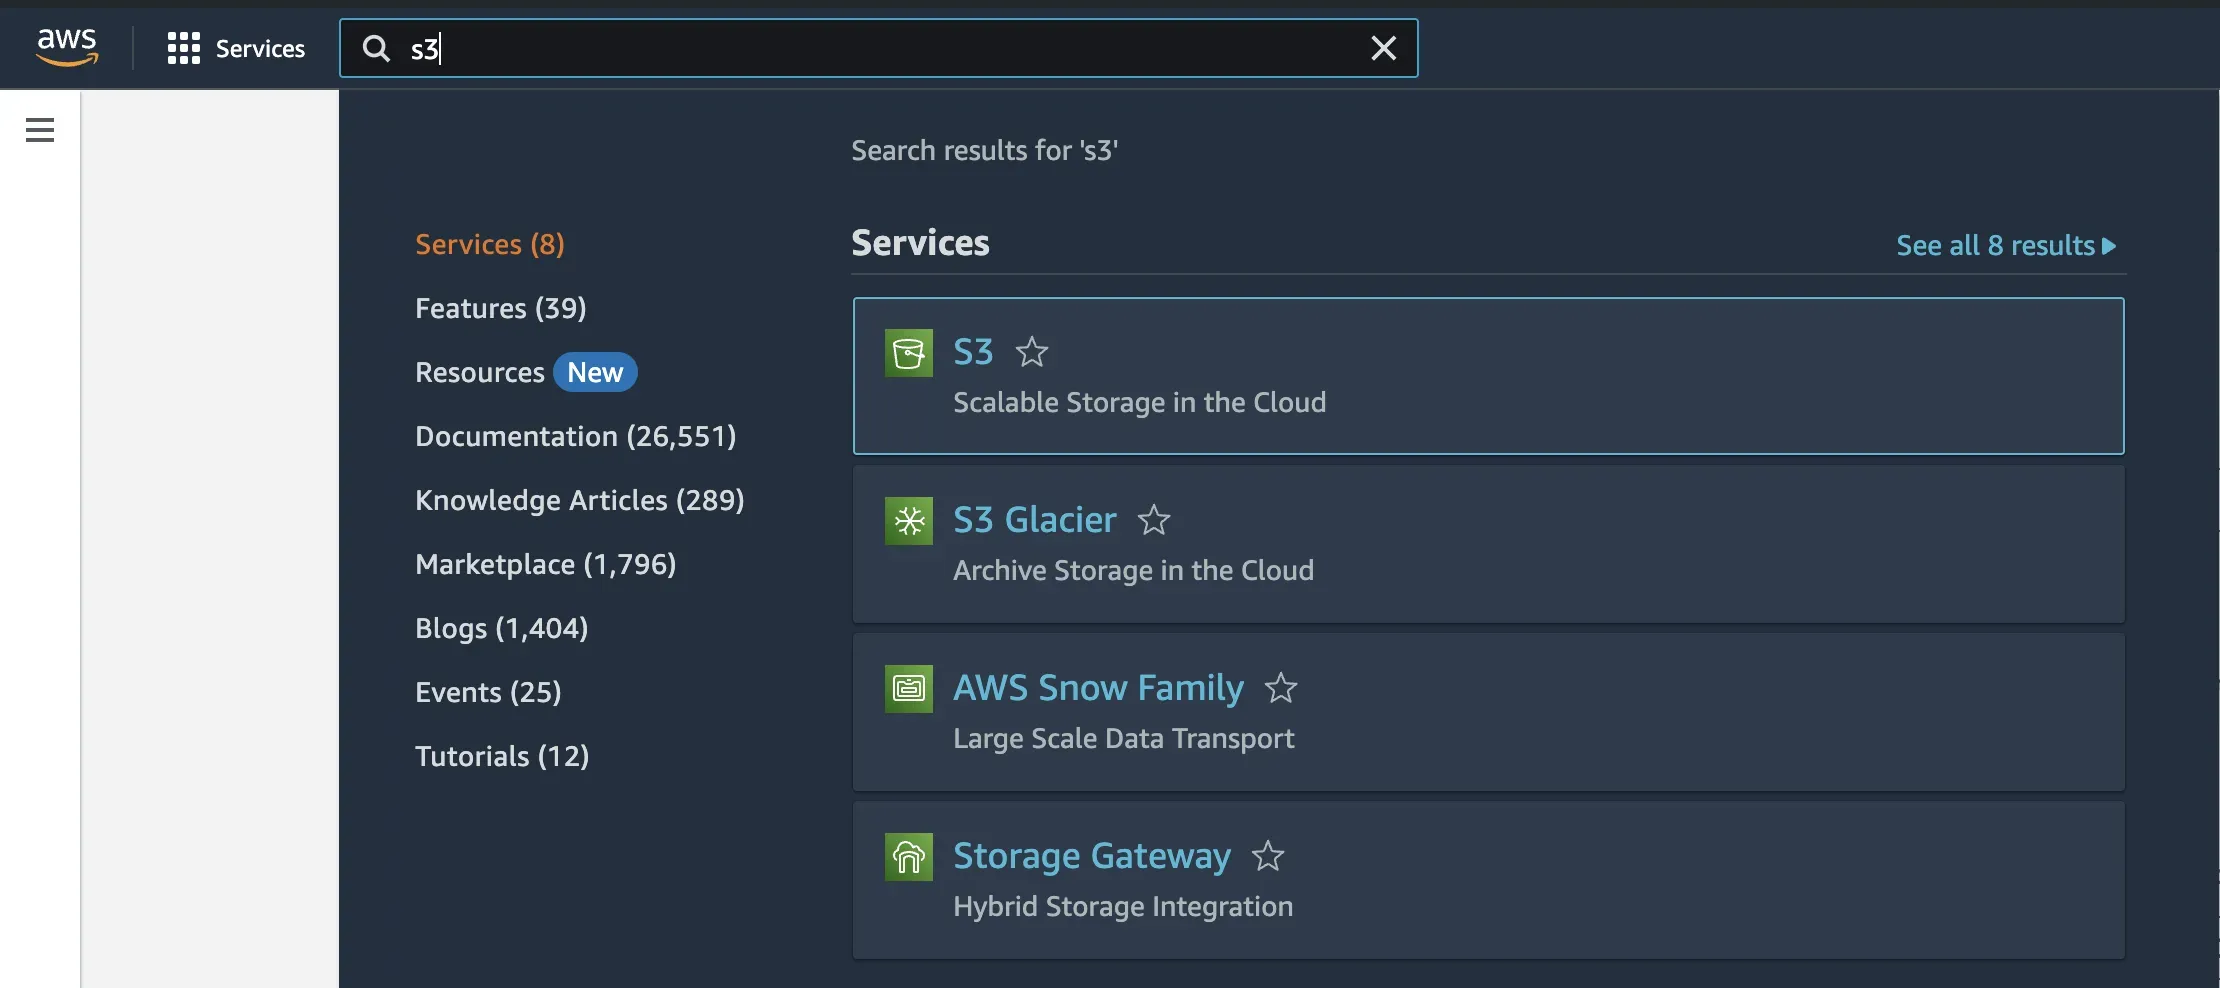
Step 1: Navigate to your AWS account. In the AWS management console, search for S3 and click on the first option.
Step 2: Click on the Create bucket button.

Give the bucket a unique name and leave all other settings as default.
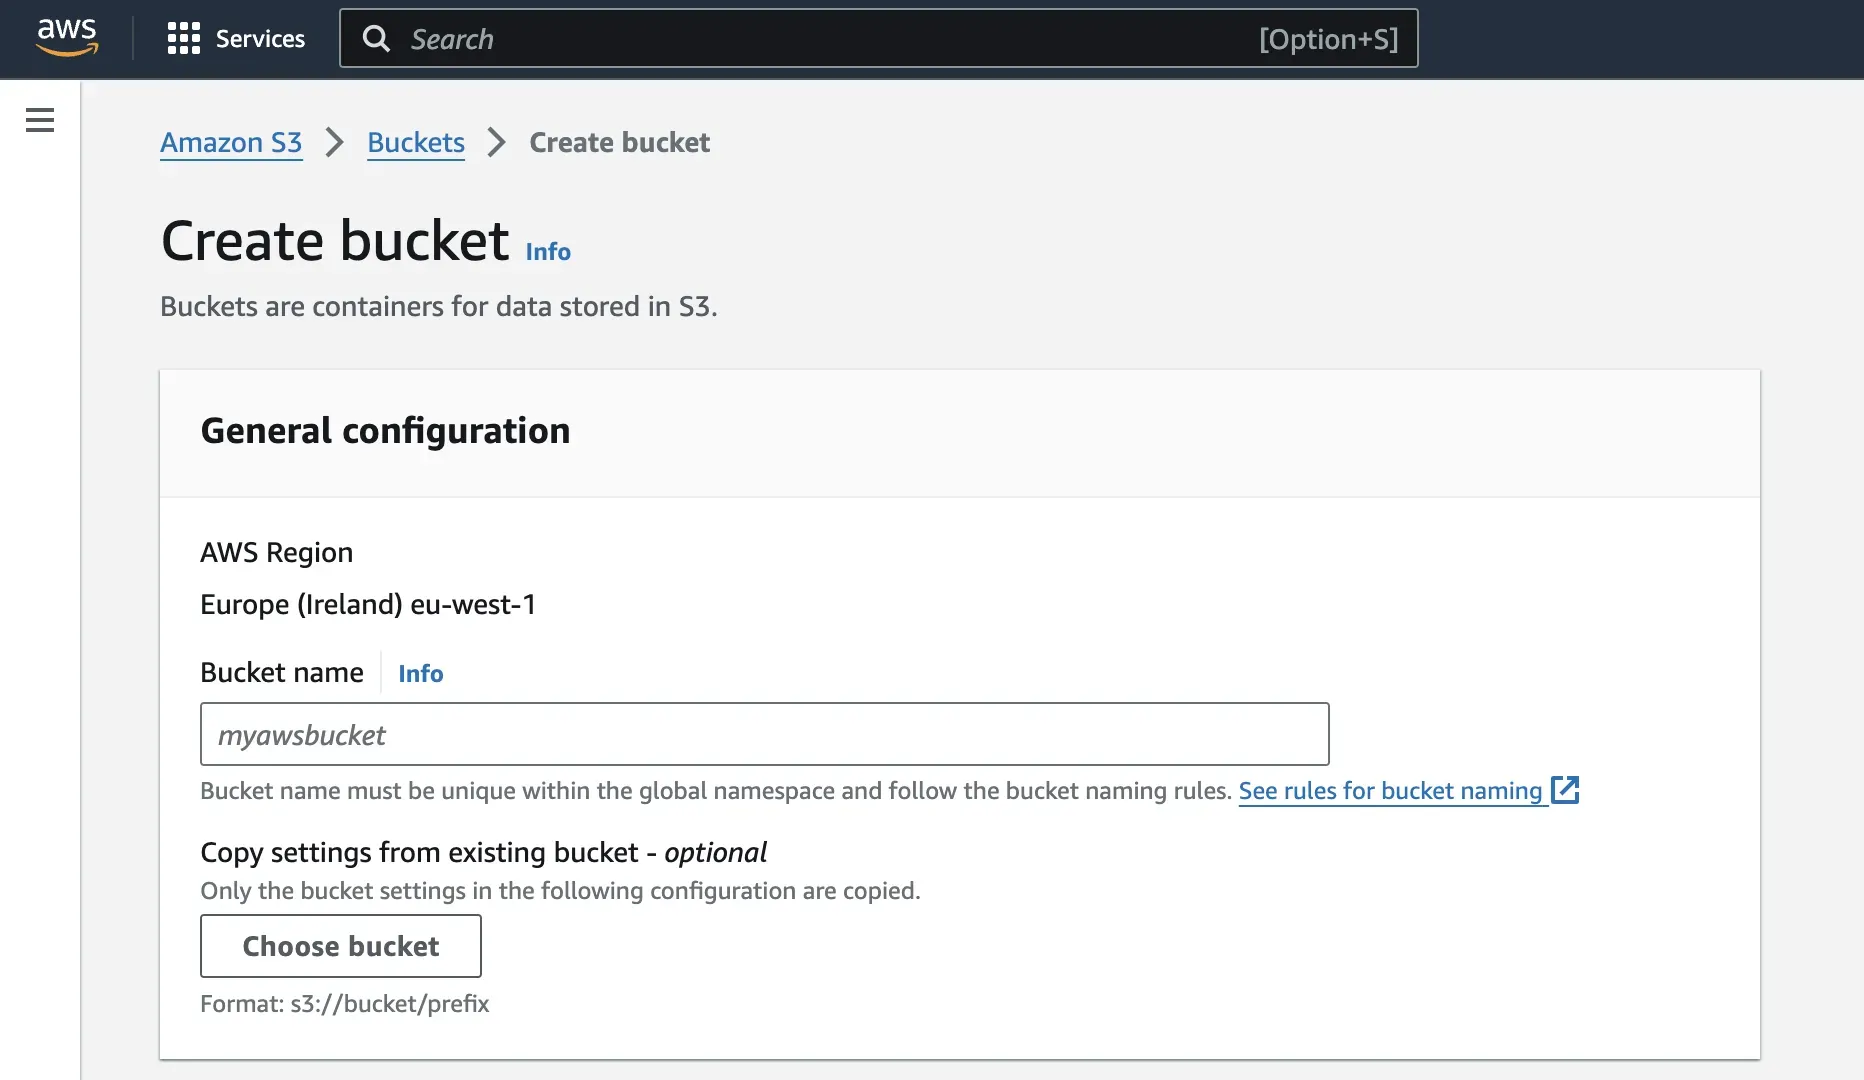
Scroll to the bottom of the page and click on the Create bucket button.

Create the VPC
VPC Flow Logs can only be created within an existing Virtual Private Cloud, in this case, Amazon VPC. This virtual network, logically isolated within AWS, allows you to launch and manage resources like servers, databases, and applications securely.
To create a VPC, follow the below steps:
Step 1: In the AWS management console, search for VPC and select it.
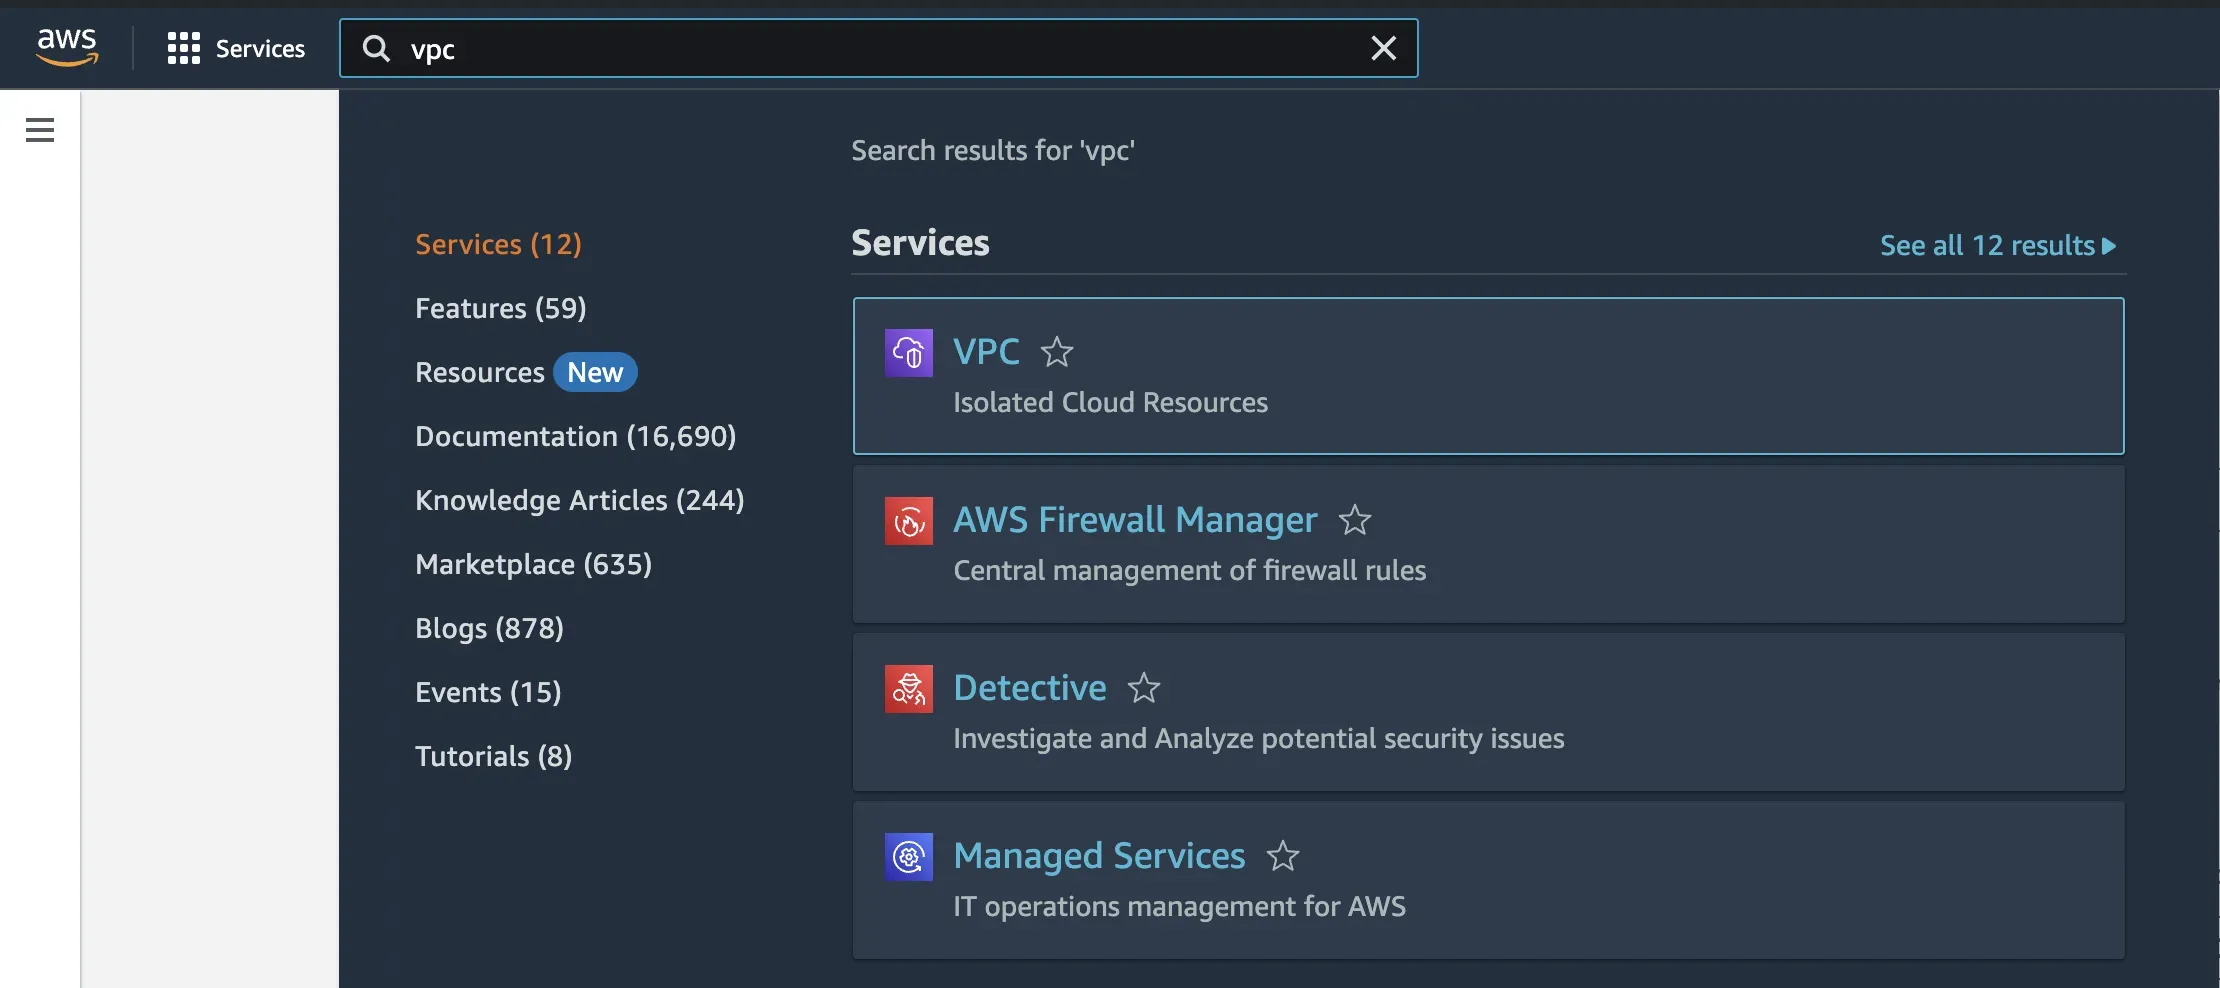
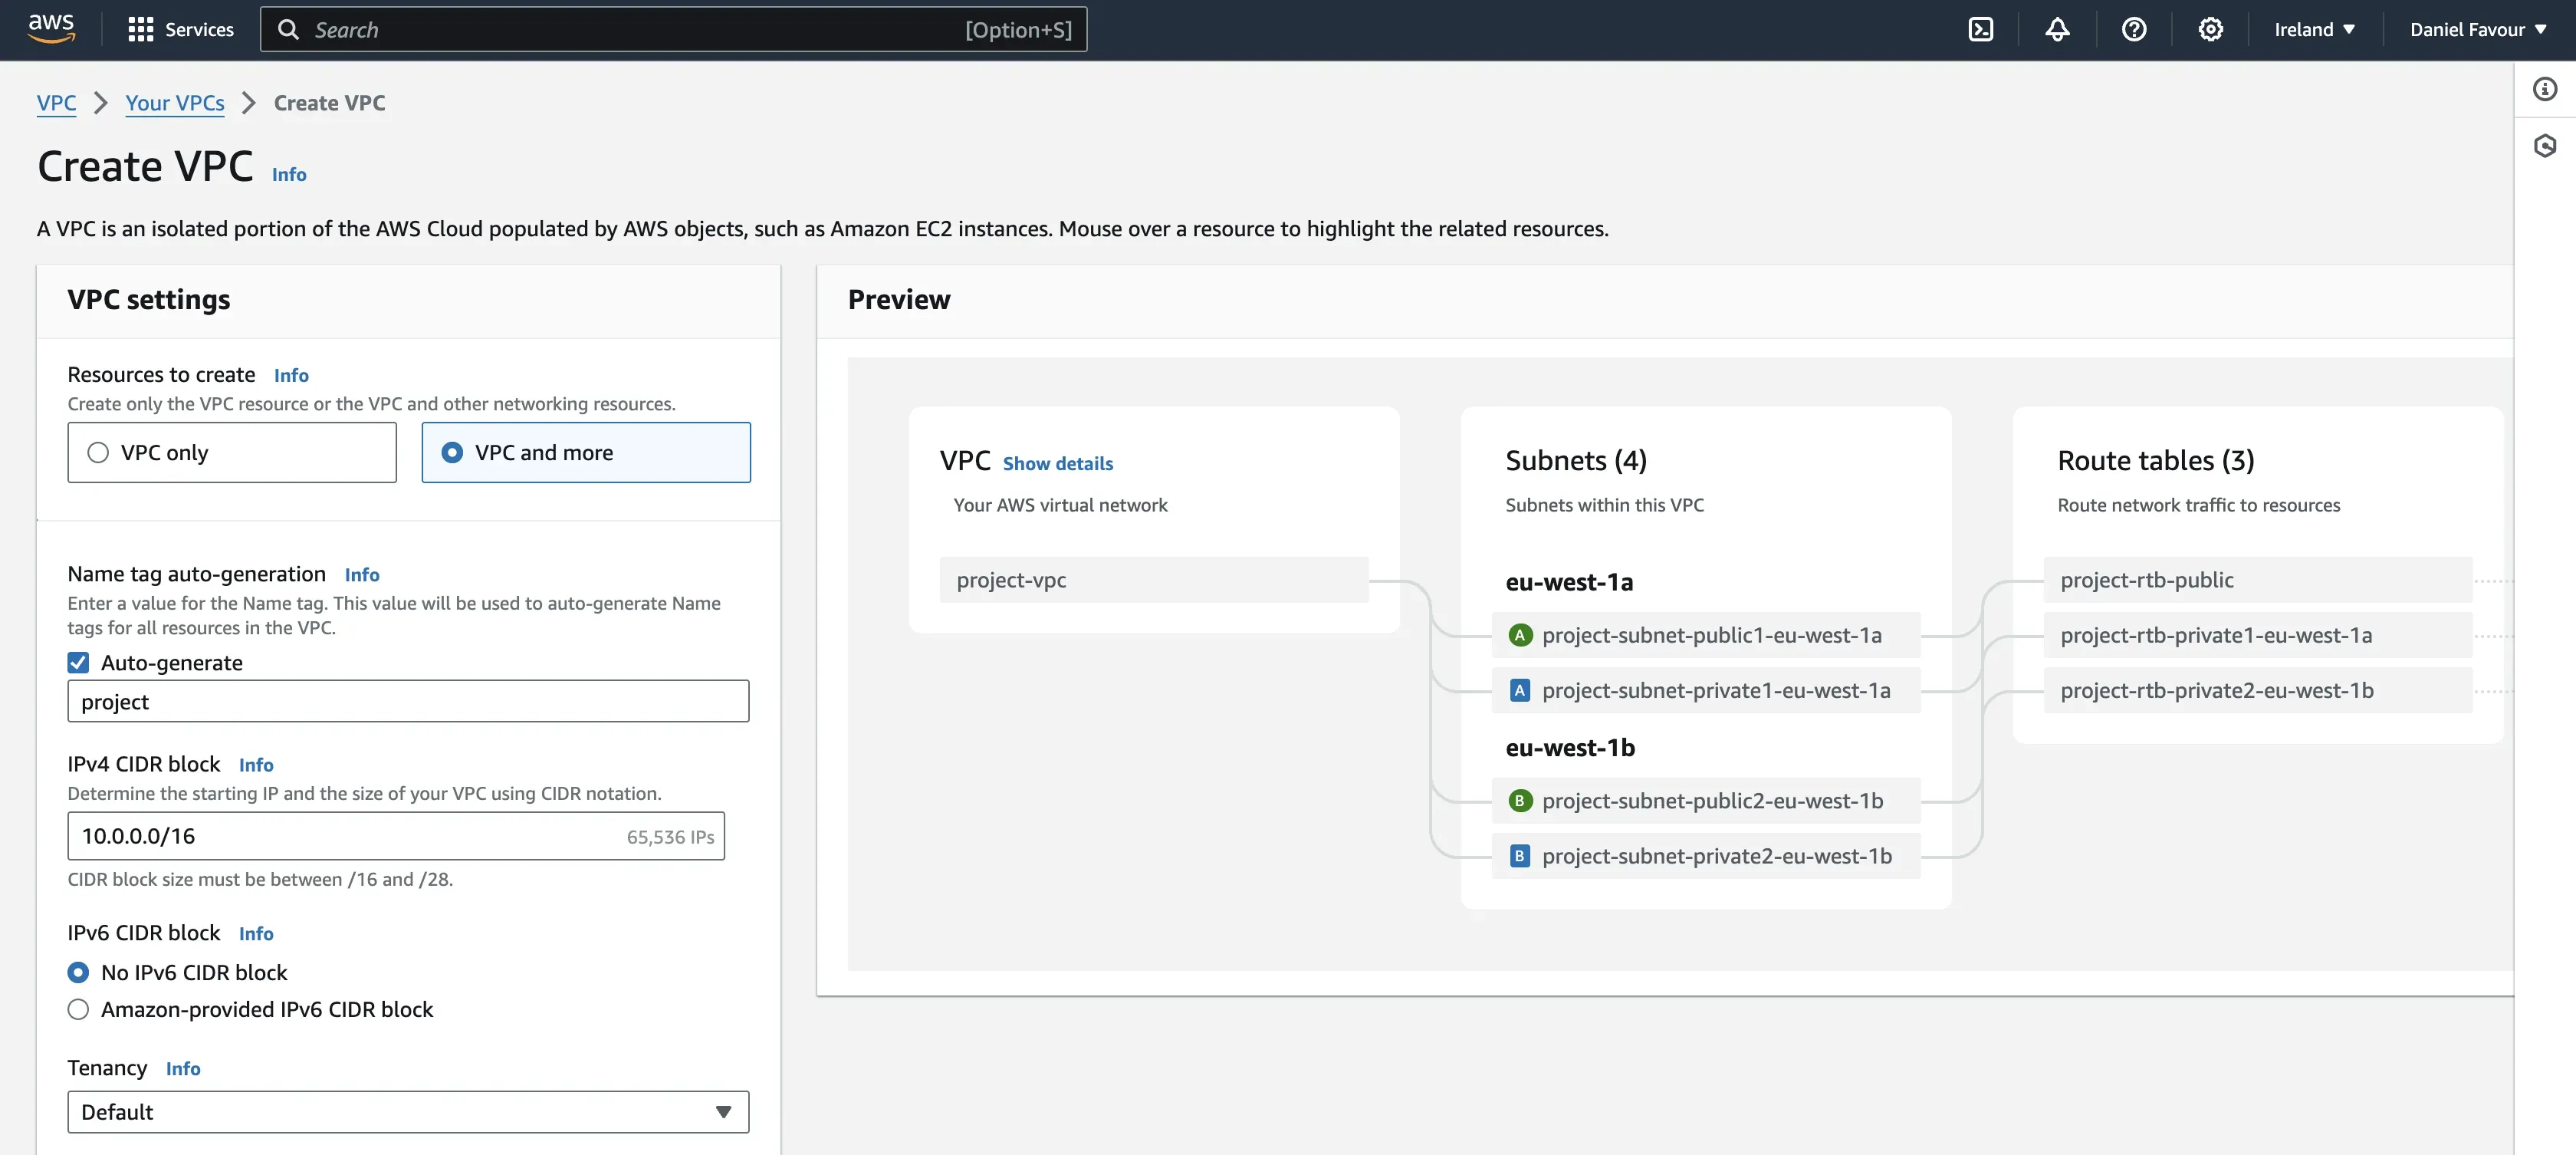
Step 2: Once redirected to the VPC page, click on the Create VPC button.

For your VPC settings, select VPC and more, give the VPC a name, and leave other settings as default. Scroll to the bottom of the page and click on Create VPC.
Create the VPC Flow Logs
Once the VPC has been created, you can proceed to create the VPC flow logs using the below steps:
Step 1: Right-click on the VPC you created and select Create flow log.

Step 2: Give the flow log a name and set the filter to all. This allows the flow log to capture all traffic. For destination, select Send to an Amazon S3 bucket and paste the ARN of the S3 bucket you created.
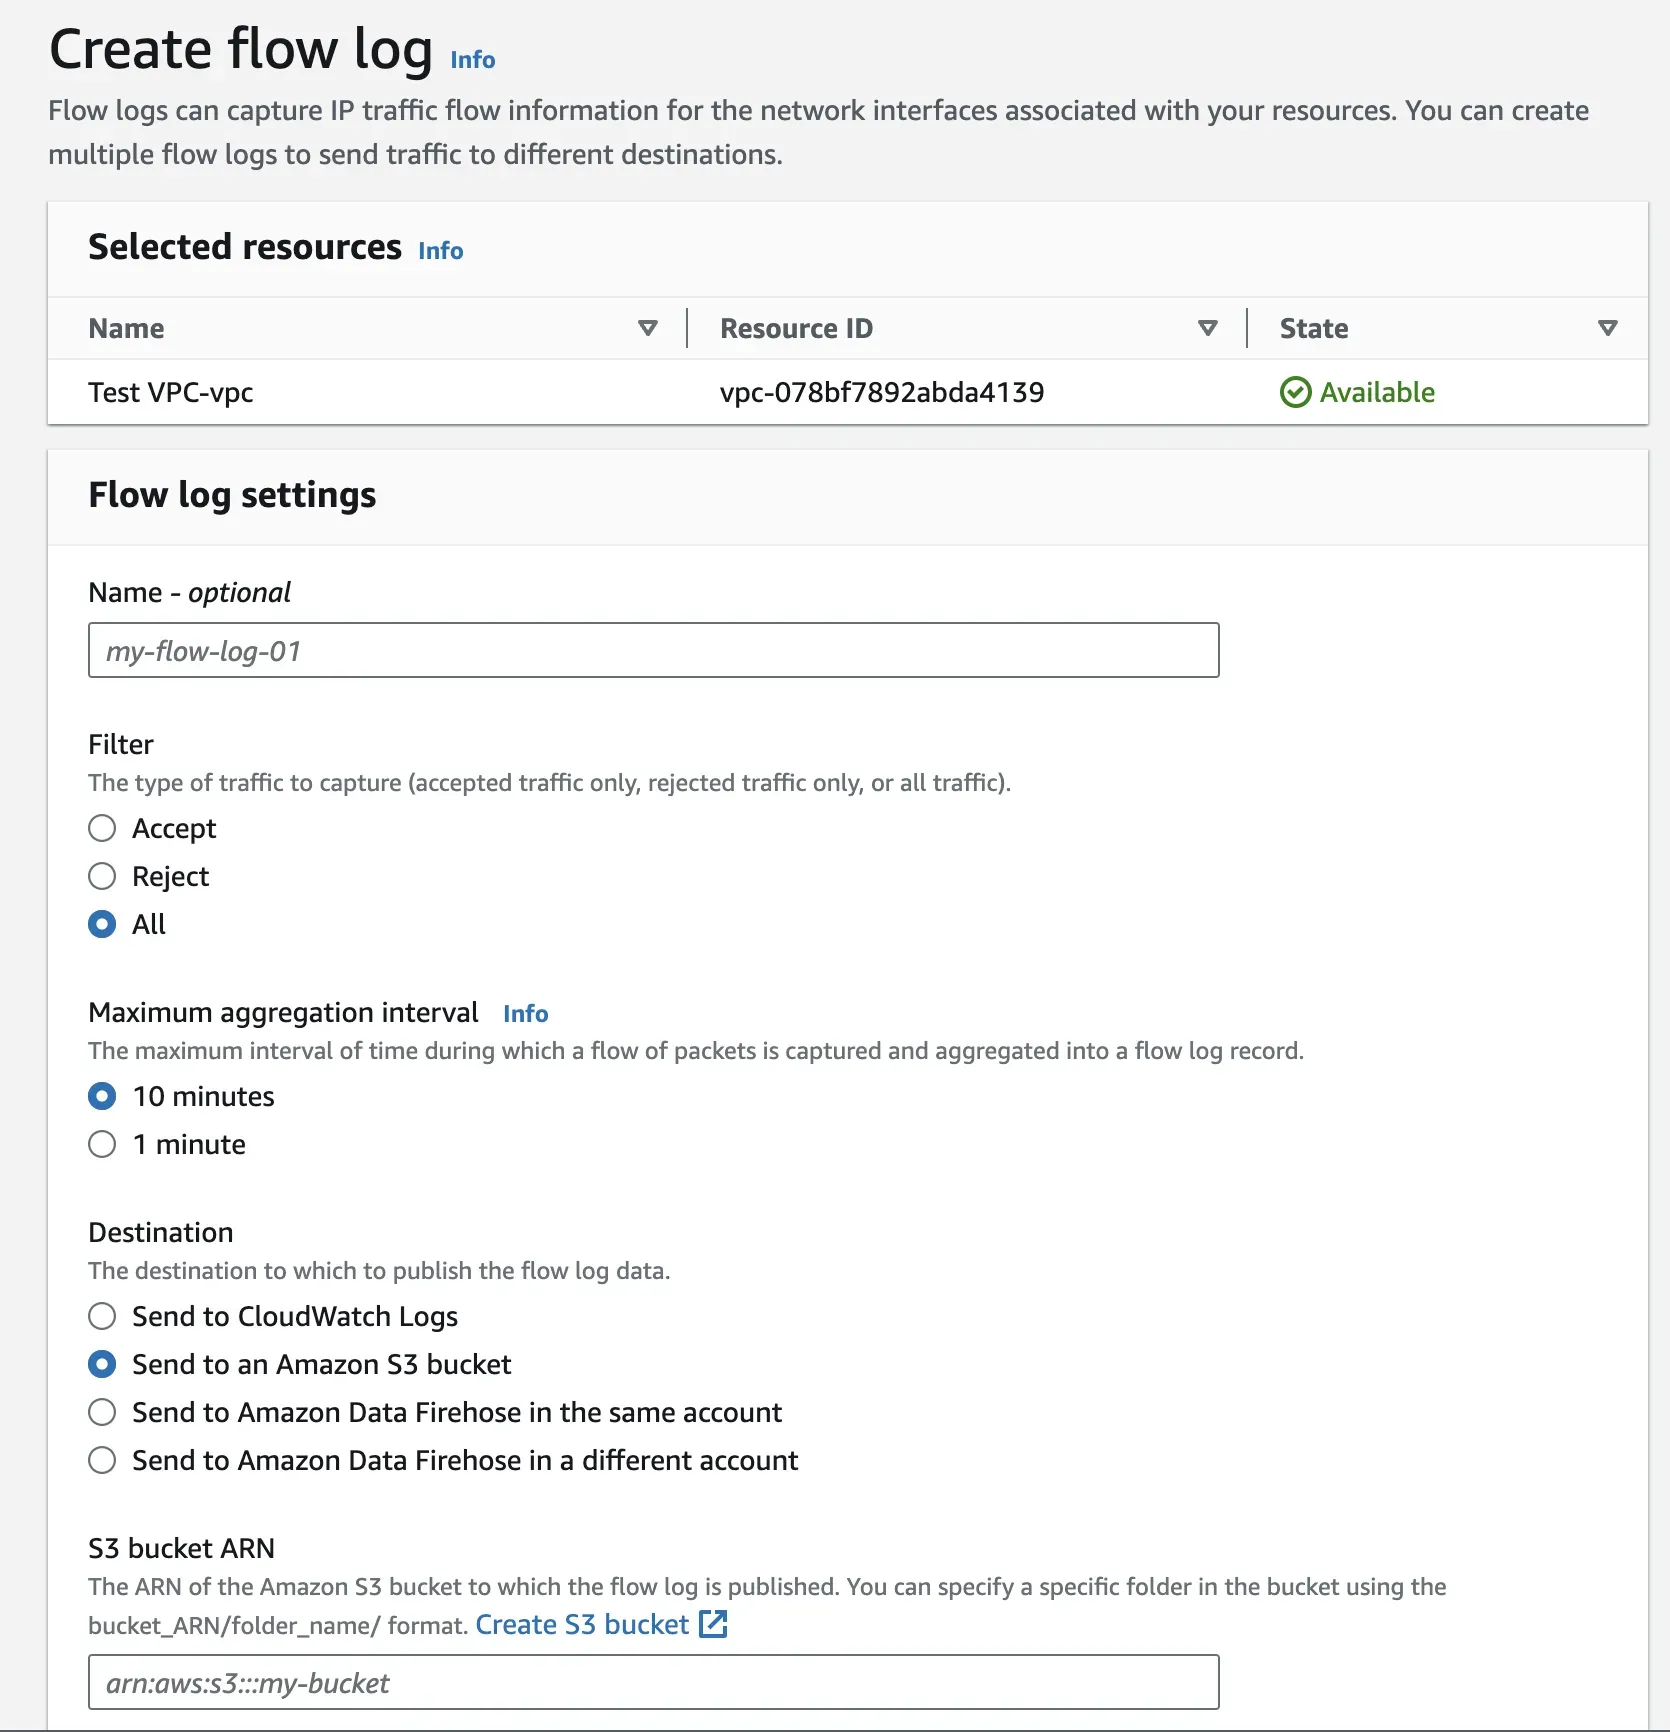
To get your bucket’s ARN, navigate to the Amazon S3 page on a different tab. Open the bucket you created and copy the ARN under the bucket’s properties.

Go back to the VPC flow log creation tab, paste the copied ARN, leave all other settings as default, and create the flow log.
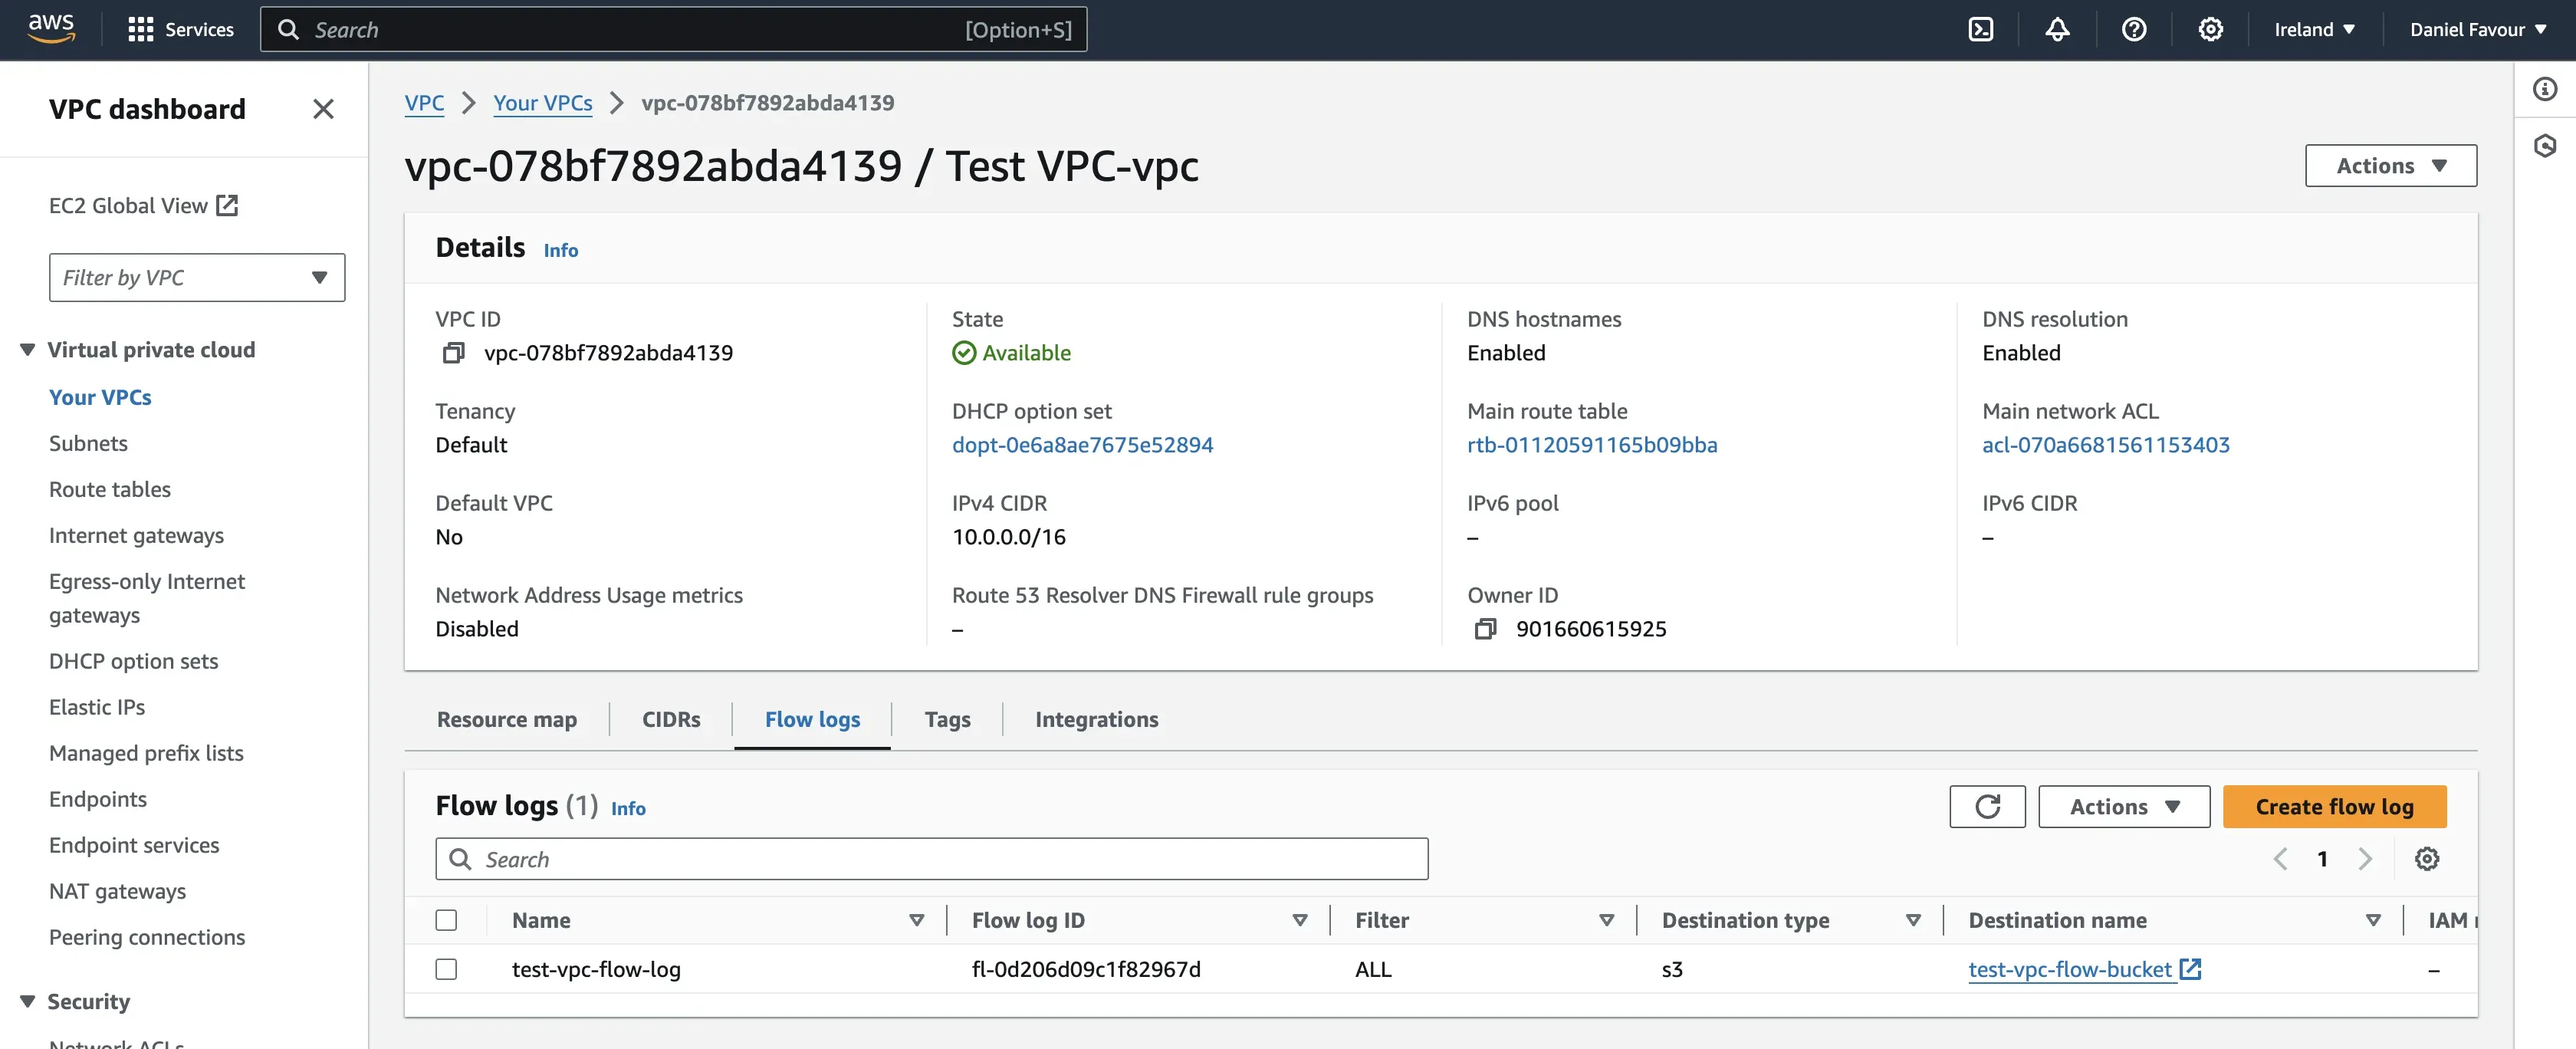
Generate traffic for the VPC
Once you have created the VPC and the VPC flow log, the process of generating logs is automatic. VPC flow logs are continuously generated as network traffic flows through your VPC.
To generate some network traffic, you can create an EC2 instance under that VPC and access it via the browser. This traffic would be recorded in the VPC flow logs.
Step 1: In the AWS management console, search EC2, and open the page.
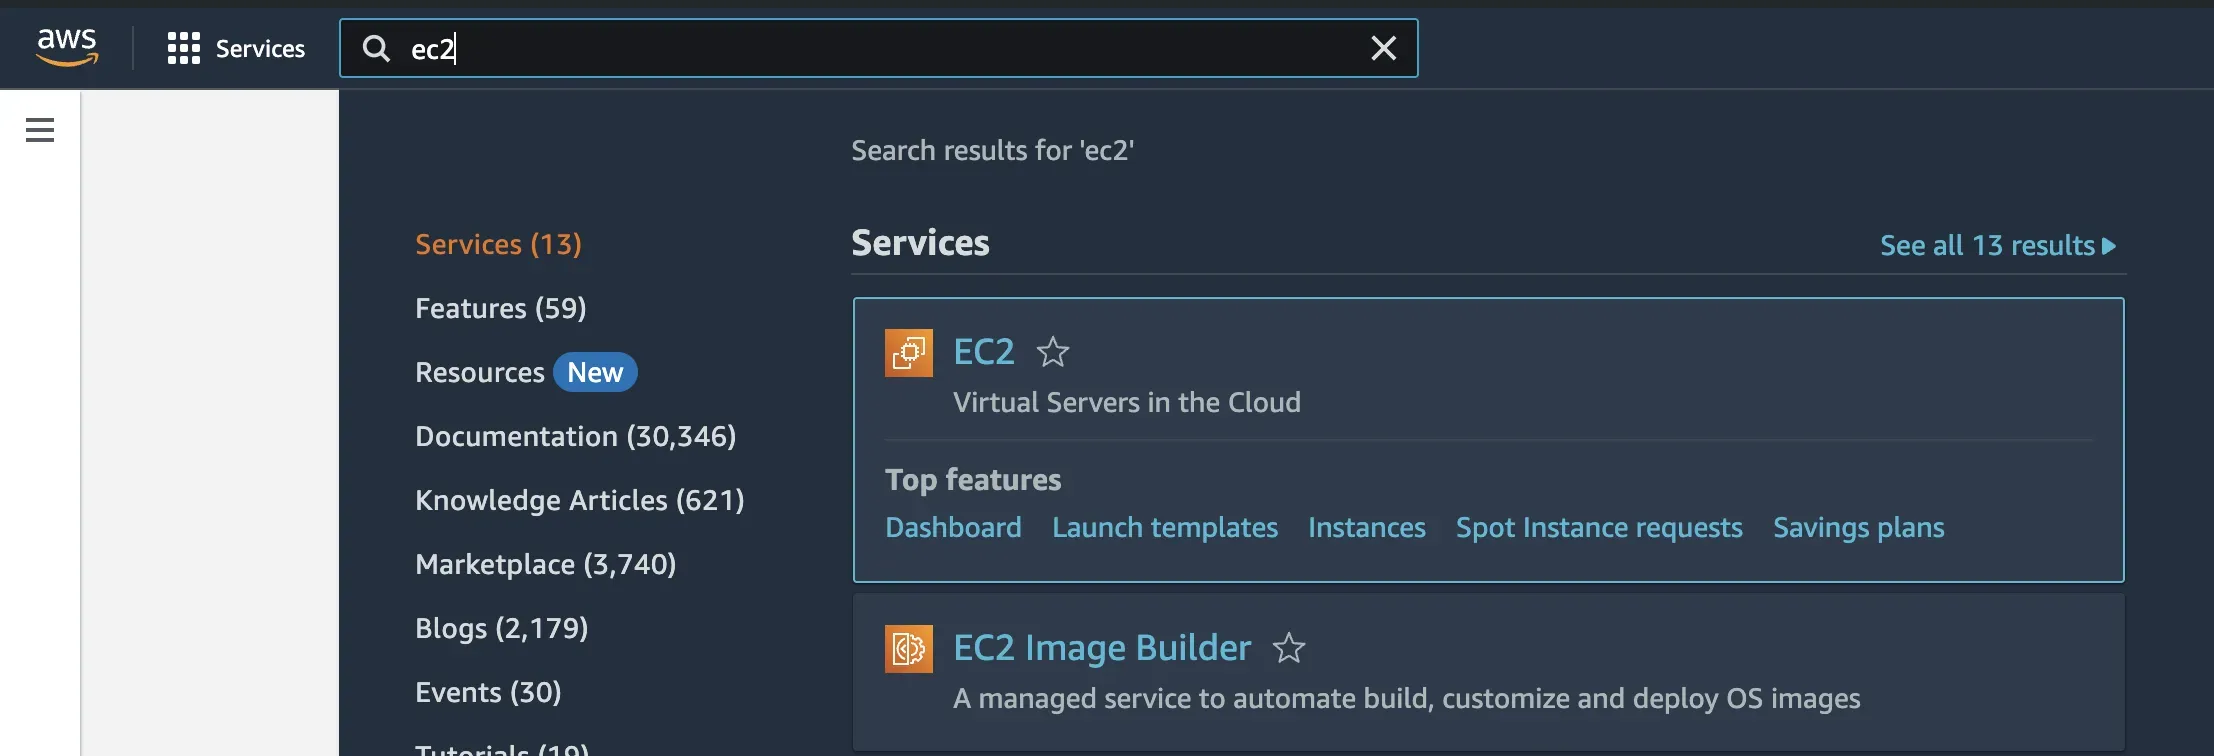
Step 2: Click on the Launch instance button to create an instance. Give the instance a name and select the Ubuntu image.
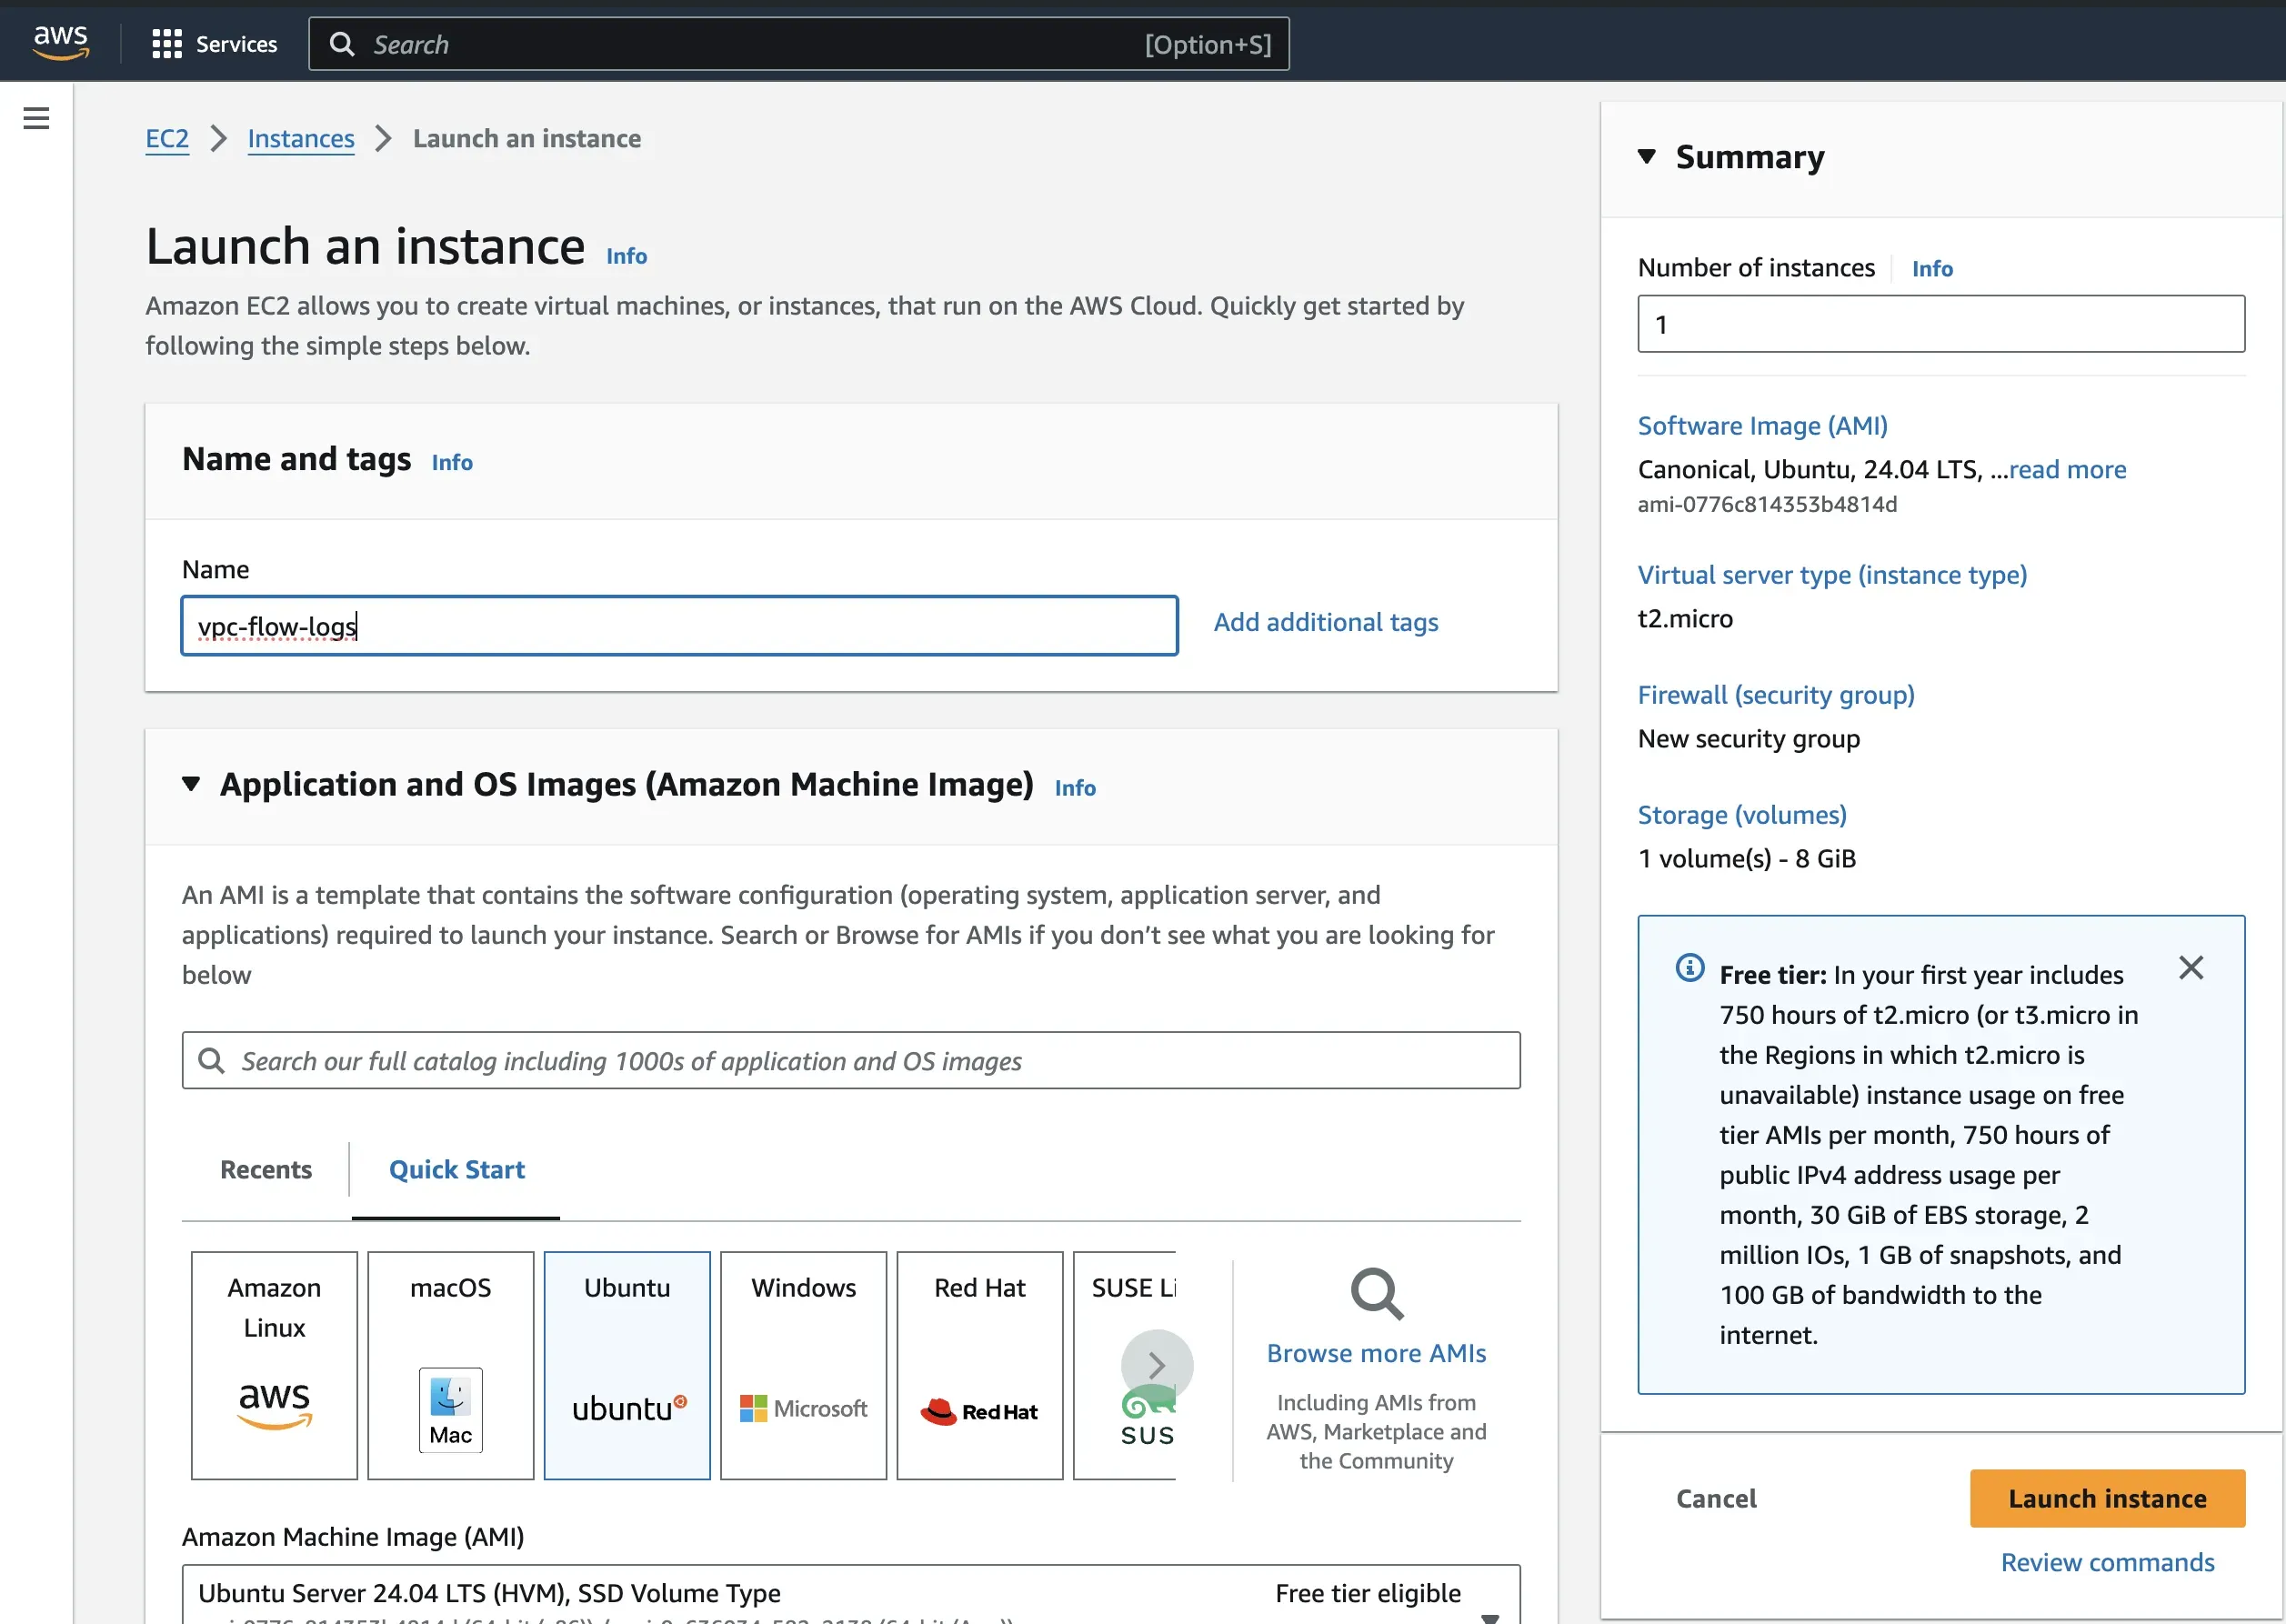
Create a key pair if you don’t have an existing one to use. For the network settings, create a new security group and allow SSH and HTTP traffic.
Note: In a production environment, you should be careful when opening up these ports and ensure access is limited to your IP address.
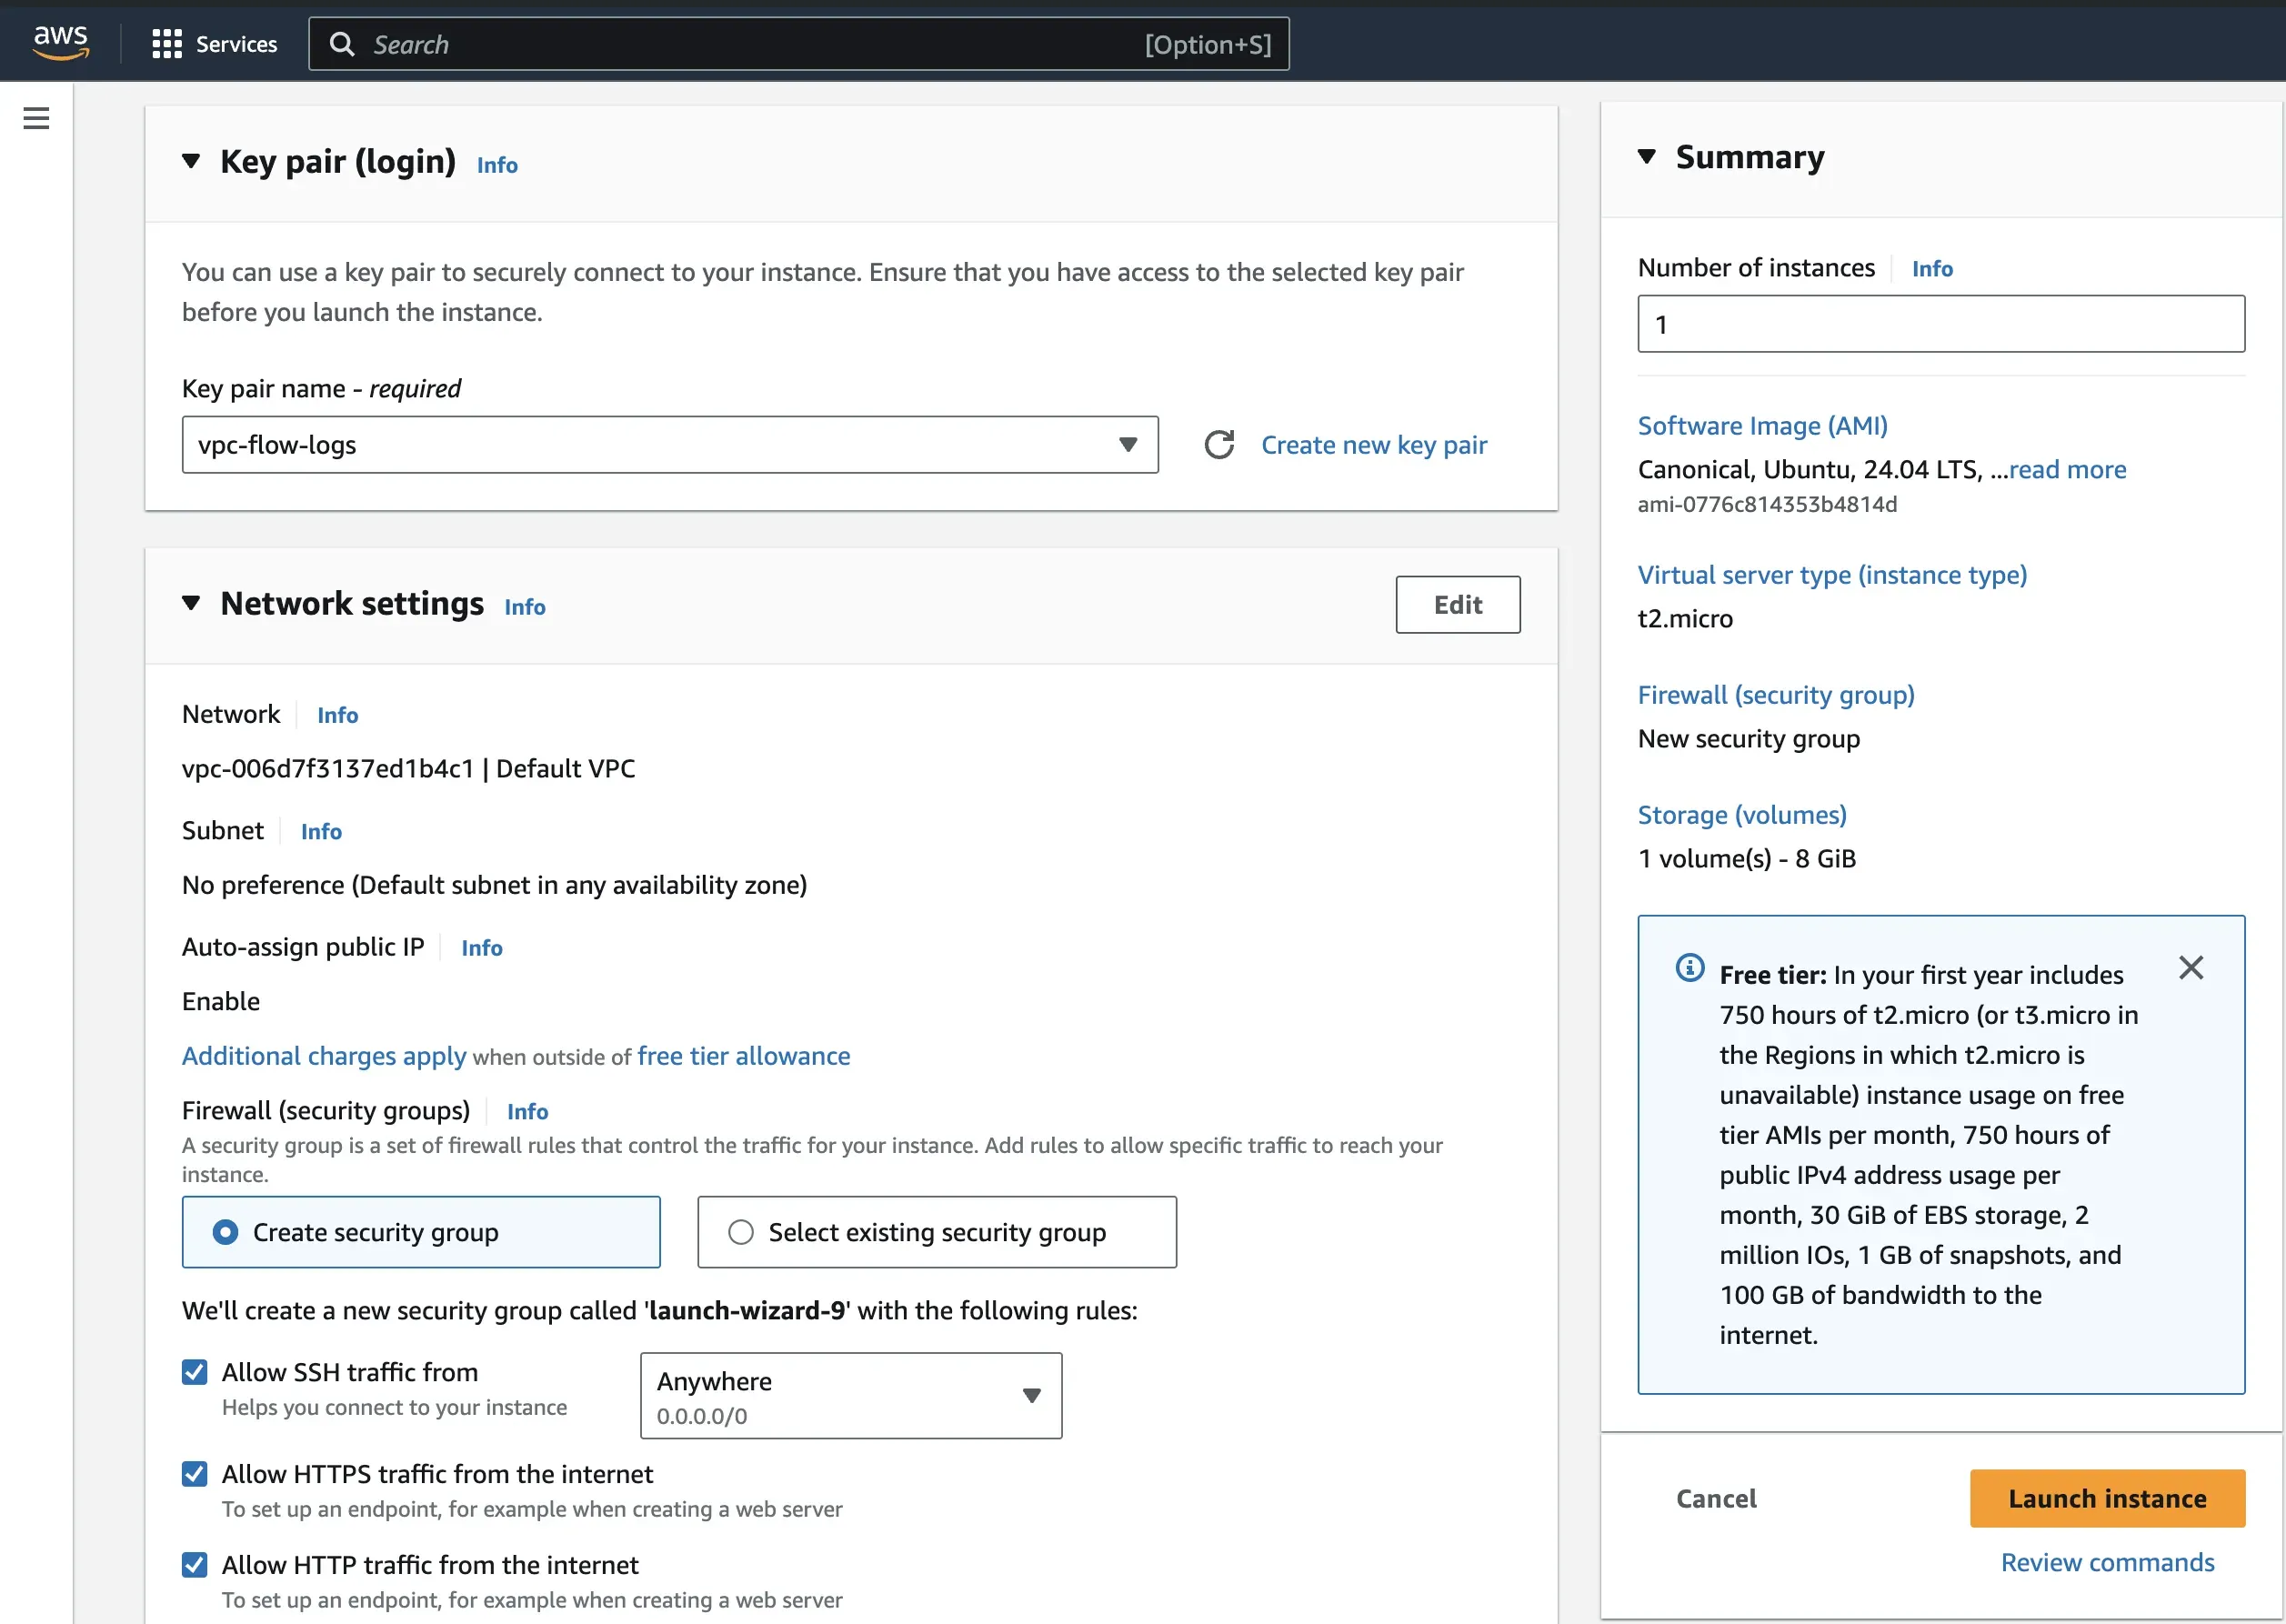
Leave all other settings as default and create the VPC.
Step 3: Log into your instance using the created key pair. Once logged in, run the following commands:
sudo apt-get update
sudo apt install apache2 -y
sudo systemctl status apache2
cd /var/www/html
echo "VPC flog logs server test" | sudo tee /var/www/html/index.html
sudo systemctl restart apache2
The above commands install the Apache2 web server on the instance, overwrite the default index.html file content in the web server’s root directory (which is usually /var/www/html in Apache) with the content "VPC flog logs server test" and restart the web server.
On the EC2 page, copy the public IP address of the instance and load it in the browser.

You can reload the page multiple times to generate traffic.
Step 4: Navigate back to the Amazon S3 page. Open the bucket you previously created, and you should see some compressed log files generated.
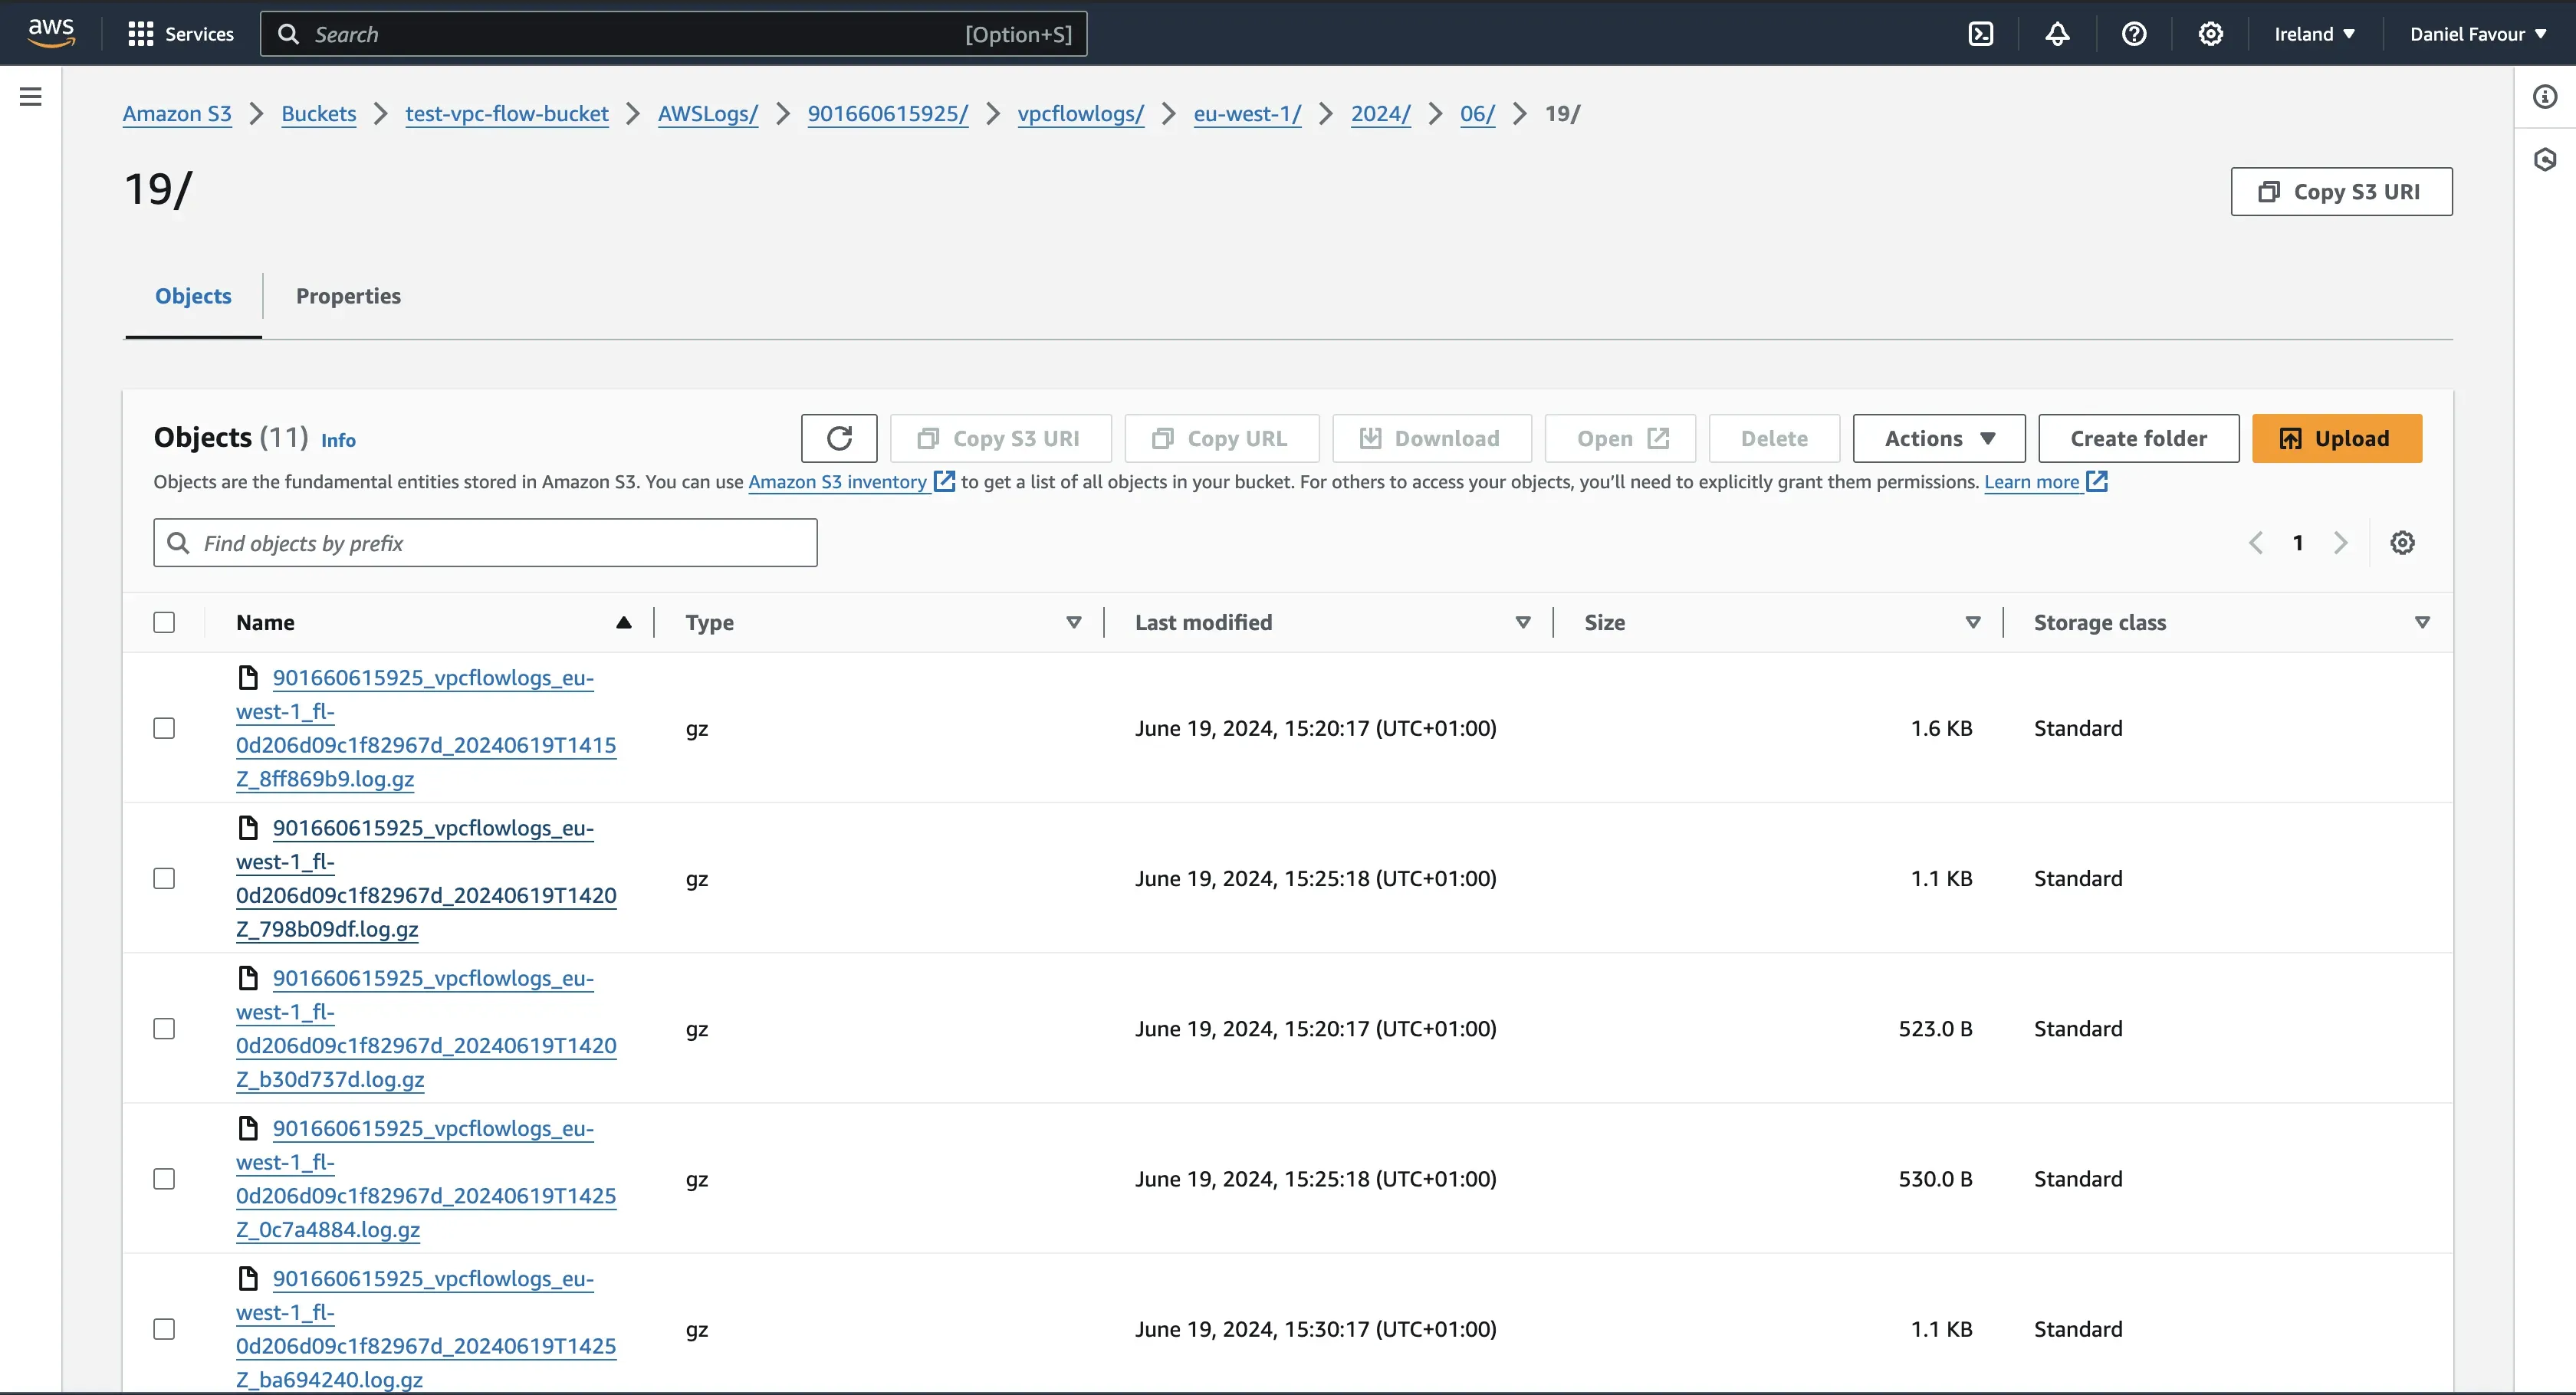
Download and open one of the log files locally to see the generated logs from your VPC.
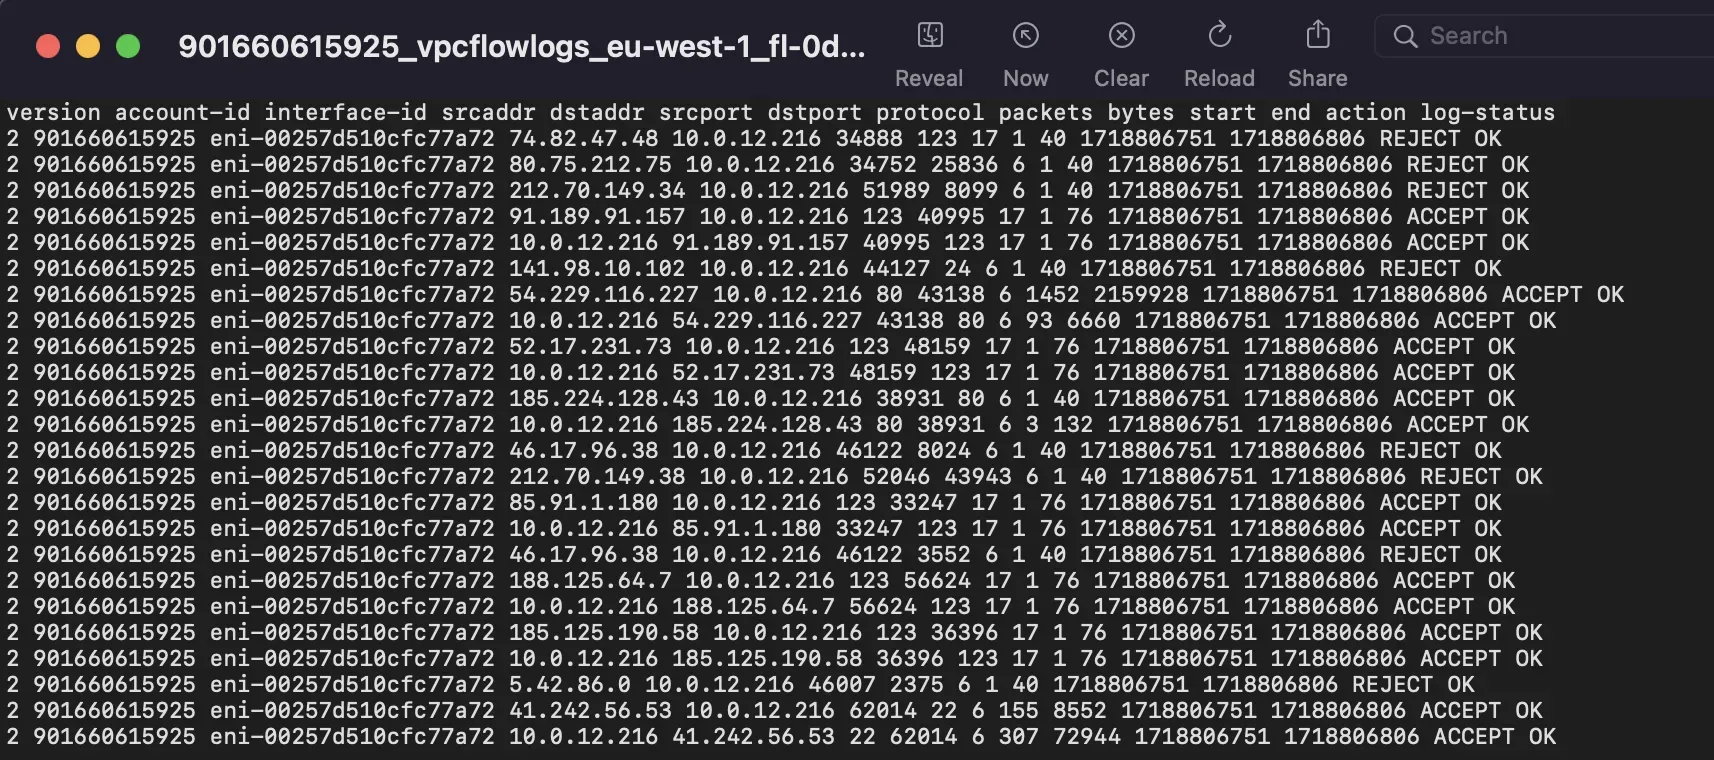
This is the default format in which VPC logs are presented:
vpc_headers = [
  'version',
  'account-id',
  'interface-id',
  'srcaddr',
  'dstaddr',
  'srcport',
  'dstport',
  'protocol',
  'packets',
  'bytes',
  'start',
  'end',
  'action',
  'log-status',
]
Forwarding VPC Flow Logs to a Visualization Tool
Once your VPC flow logs have been generated, they need to be analyzed to understand the network traffic in your VPC. While AWS offers various services for log analysis, these options can lead to vendor lock-in and potentially unpredictable pricing as your usage scales. Additionally, you may need to switch between different services for comprehensive analysis. A better alternative is to forward your VPC flow logs to a third-party tool that can visualize and analyze your logs in one place. A good option is SigNoz.
SigNoz is a full-stack, open-source monitoring tool that allows you to visualize and analyze your log data on a single pane of glass. It integrates logs, metrics, and traces with intelligent correlation, providing a holistic view of your system's performance.
Here are some key benefits of using SigNoz:
- Avoid Vendor Lock-In: As an open-source tool, SigNoz eliminates dependency on a single vendor, offering greater flexibility.
- Transparent Pricing: SigNoz provides straightforward and transparent pricing for its cloud option, making cost management easier.
- Advanced Log Management: With SigNoz, you can leverage advanced log management capabilities to gain deep insights into your log data.
- Fast Queries: SigNoz uses a columnar database, ClickHouse, to store logs. This allows for lightning-fast queries and aggregations.
- Supports OpenTelemetry: SigNoz is built to support OpenTelemetry natively for seamless telemetry data collection.
How to Forward VPC Flow Logs to SigNoz
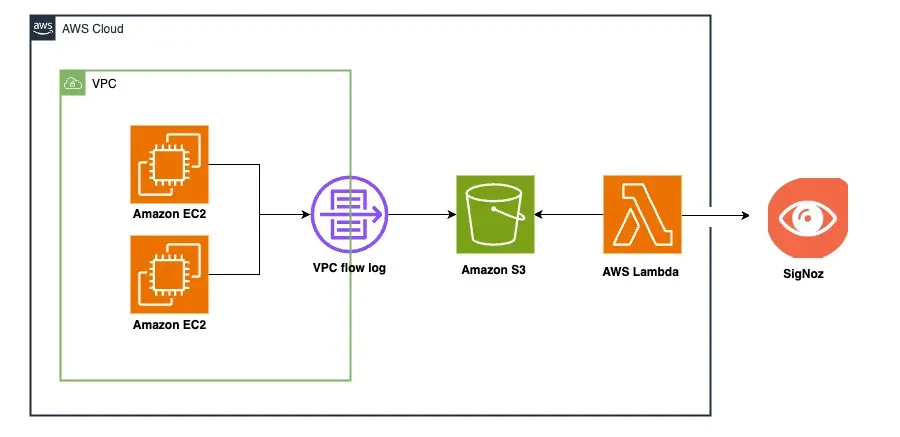
To send the VPC flow logs from the S3 buckets to SigNoz for analysis, you need to create an AWS Lambda function. A Lambda function is a piece of code that runs in the cloud when triggered by an event without you needing to manage servers. This Lambda function will serve as a bridge between S3 and SigNoz. Whenever a new VPC flow log is created or updated in the bucket, the function will be triggered, and the flow log will be forwarded to SigNoz.
The architectural diagram below shows a visualization of the process.
Create a Lambda Function
Follow the below steps to create your Lambda function.
Step 1: In the AWS management console, search Lambda. Open it and select Create a function.

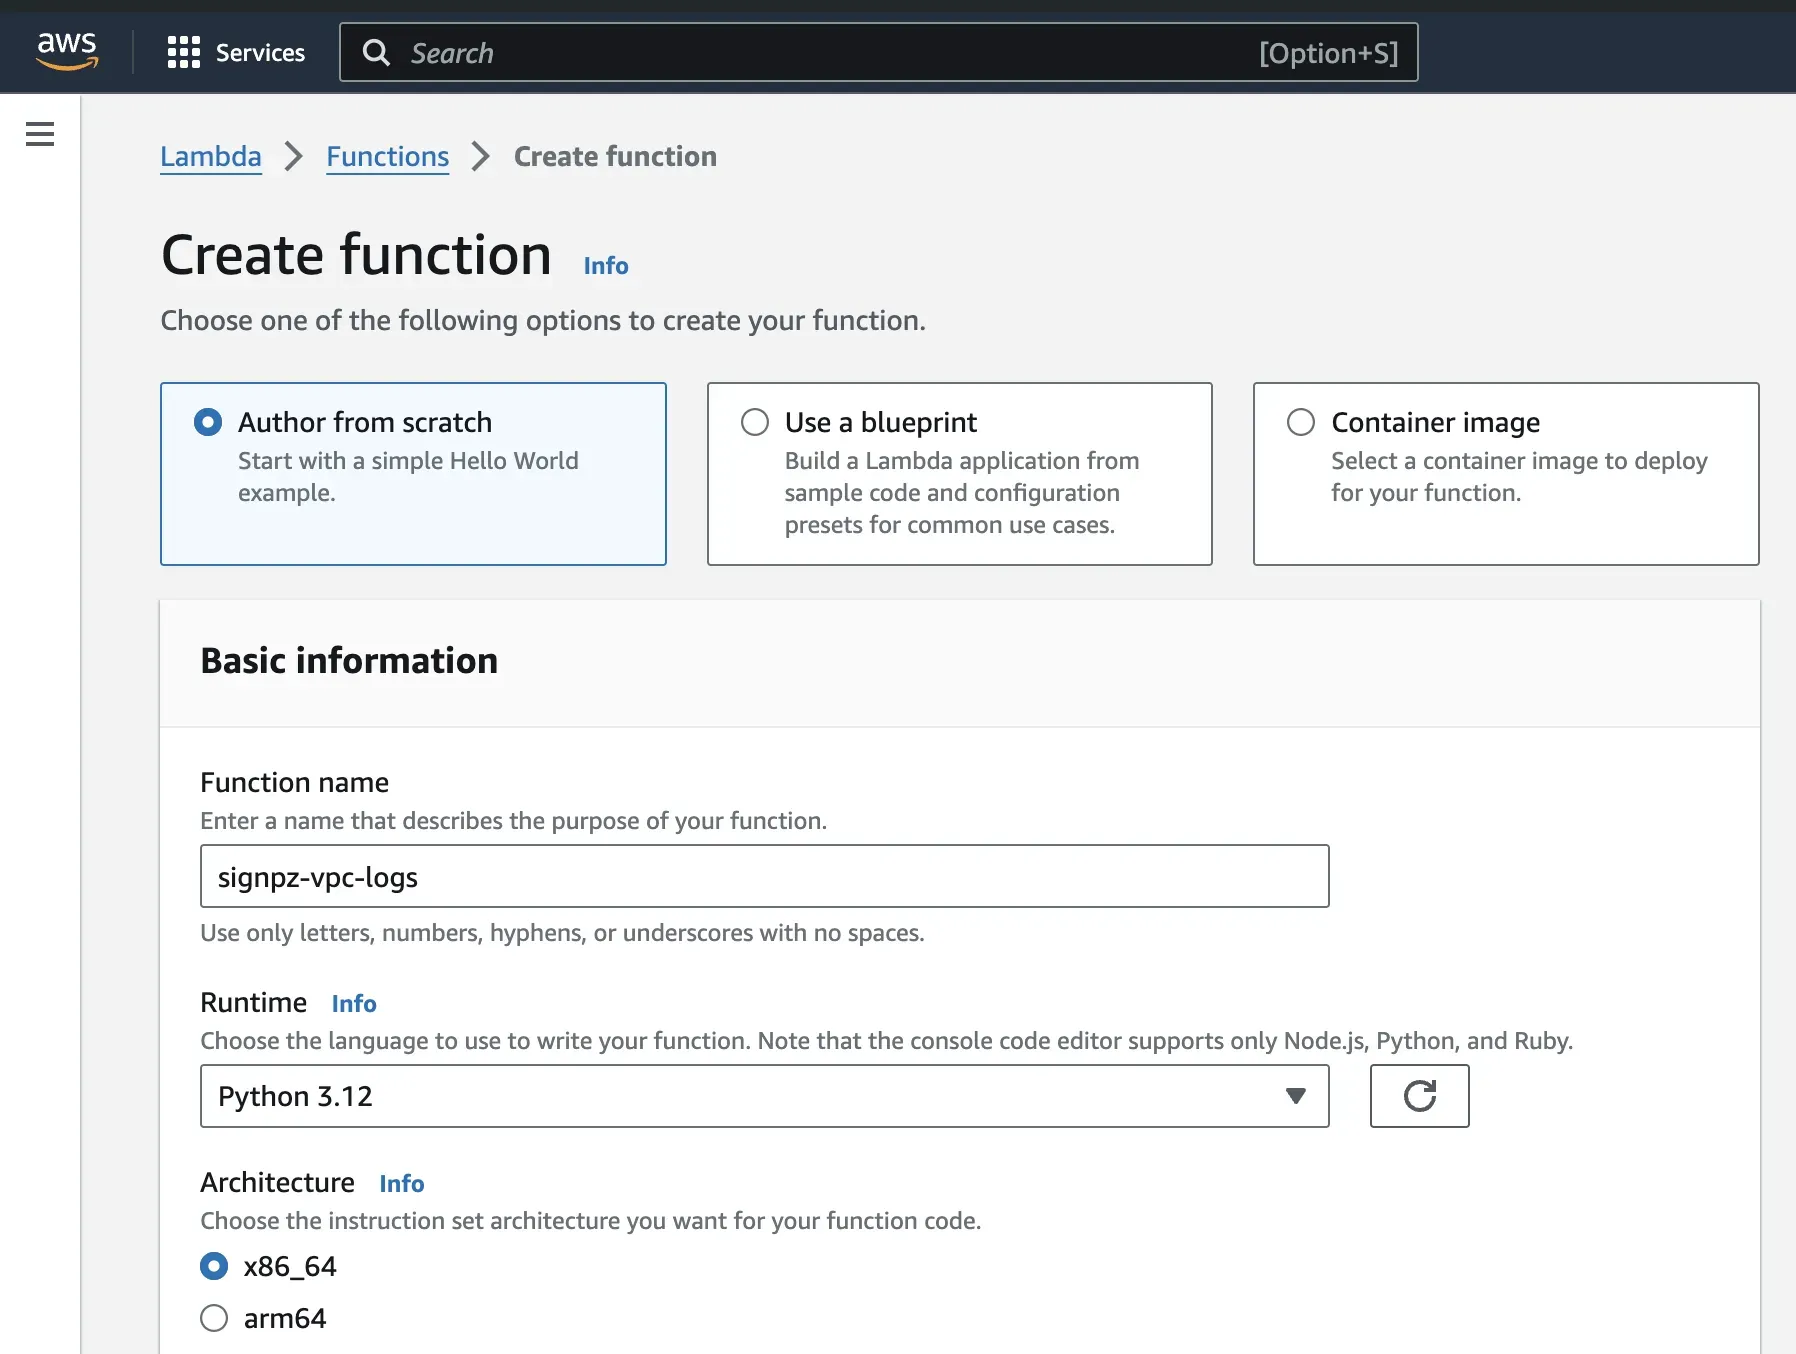
Step 2: For the configurations, select Author from scratch, give the function a name, select the latest Python version for runtime, and use x86_64 for the architecture.
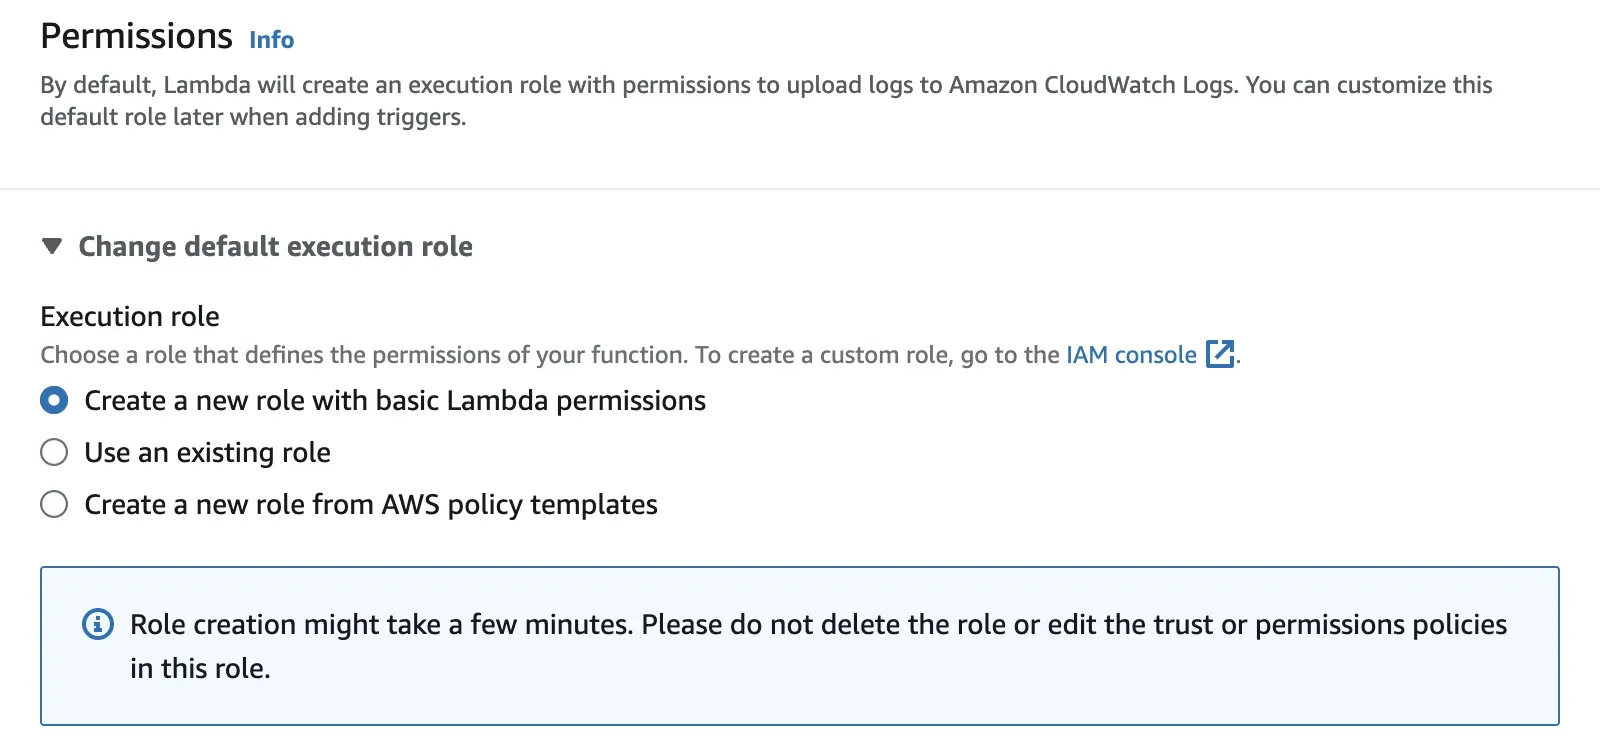
Step 3: For permissions, select Create a new role with basic Lambda permissions.
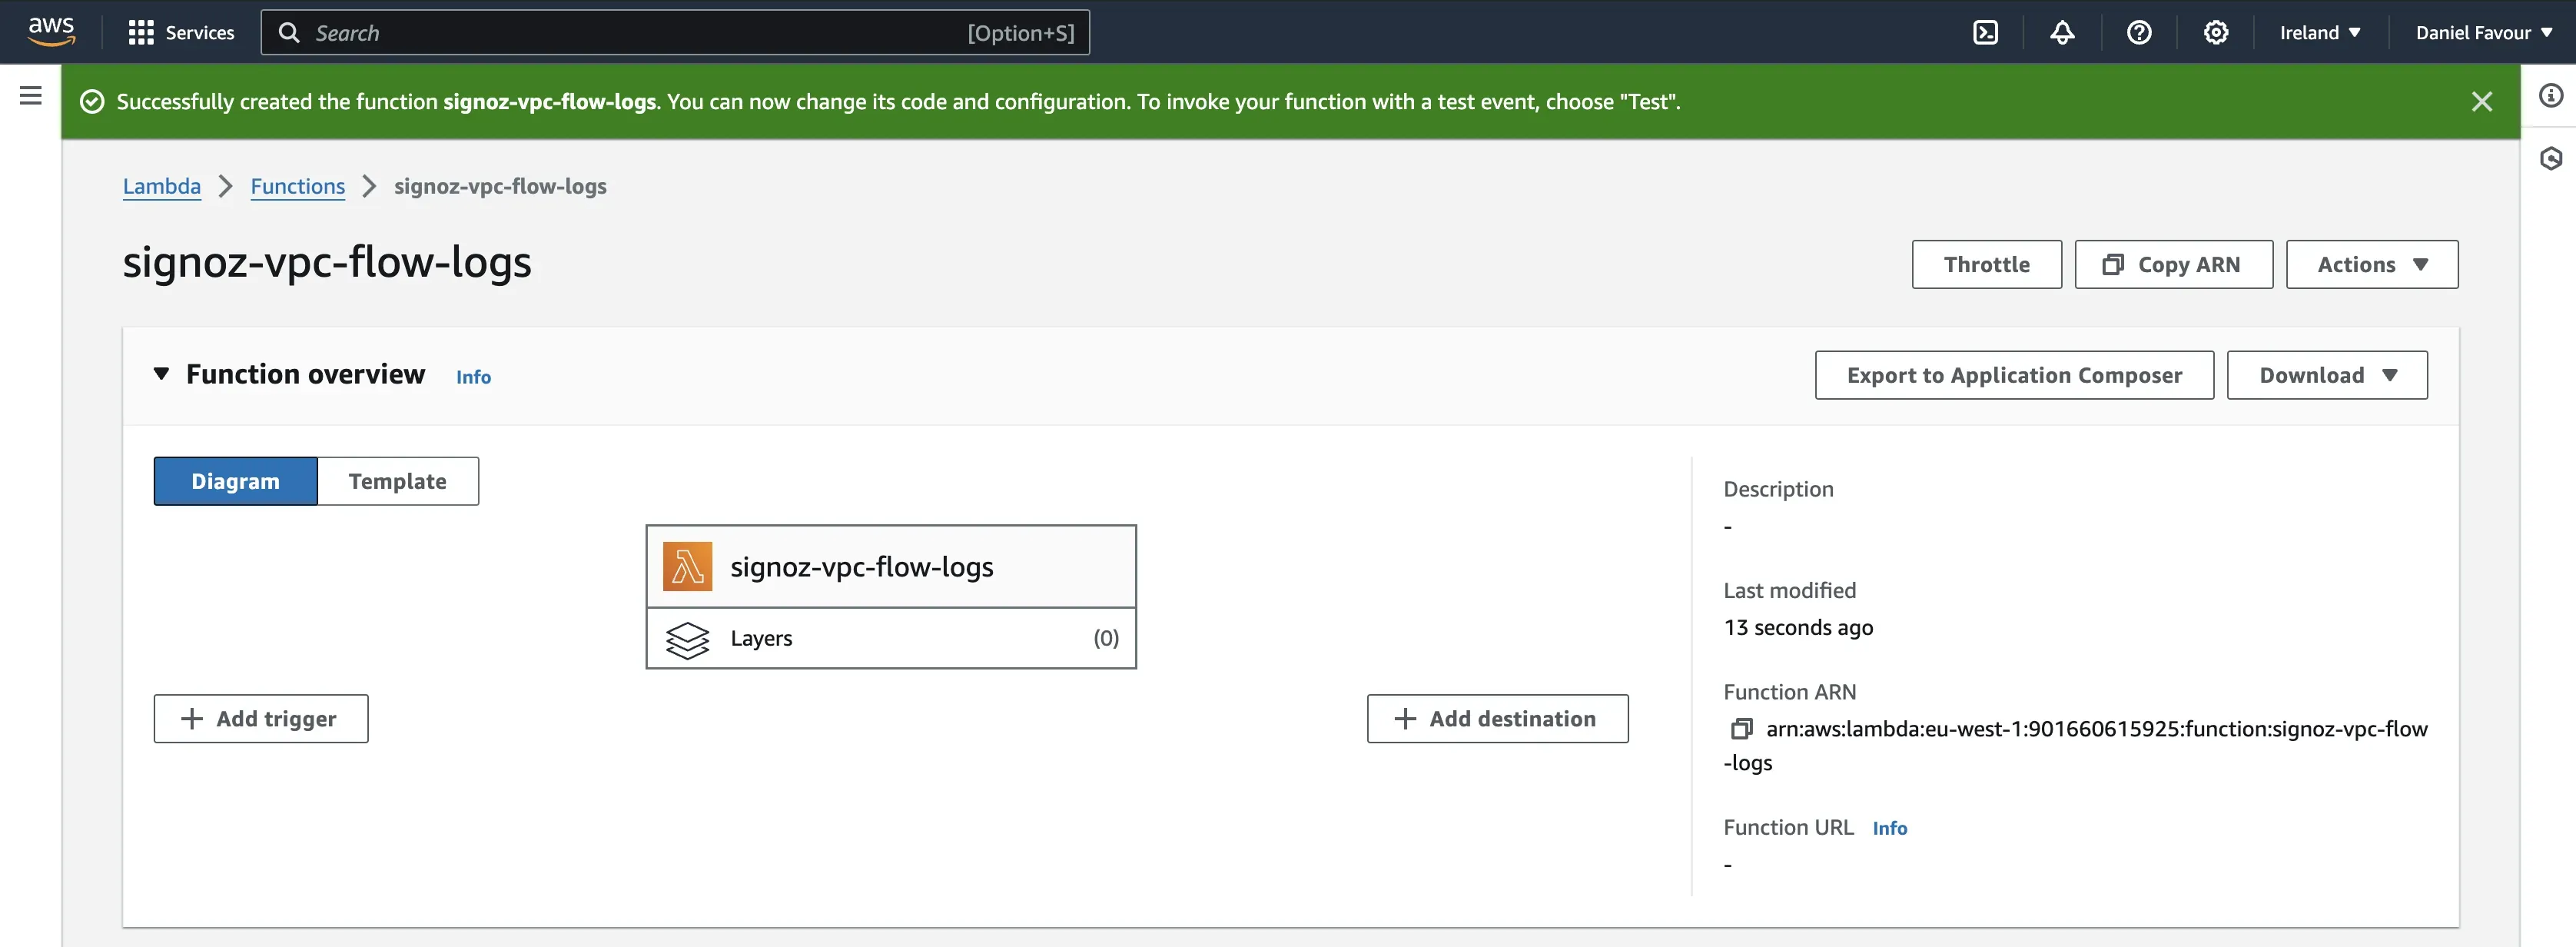
Proceed to create the function.
Configure Policies for the Function
The created Lambda function will be used to fetch new or updated VPC flow log files from the S3 bucket. To enable this communication between Lambda and S3, you need to grant your Lambda function the necessary permissions to access the S3 bucket.
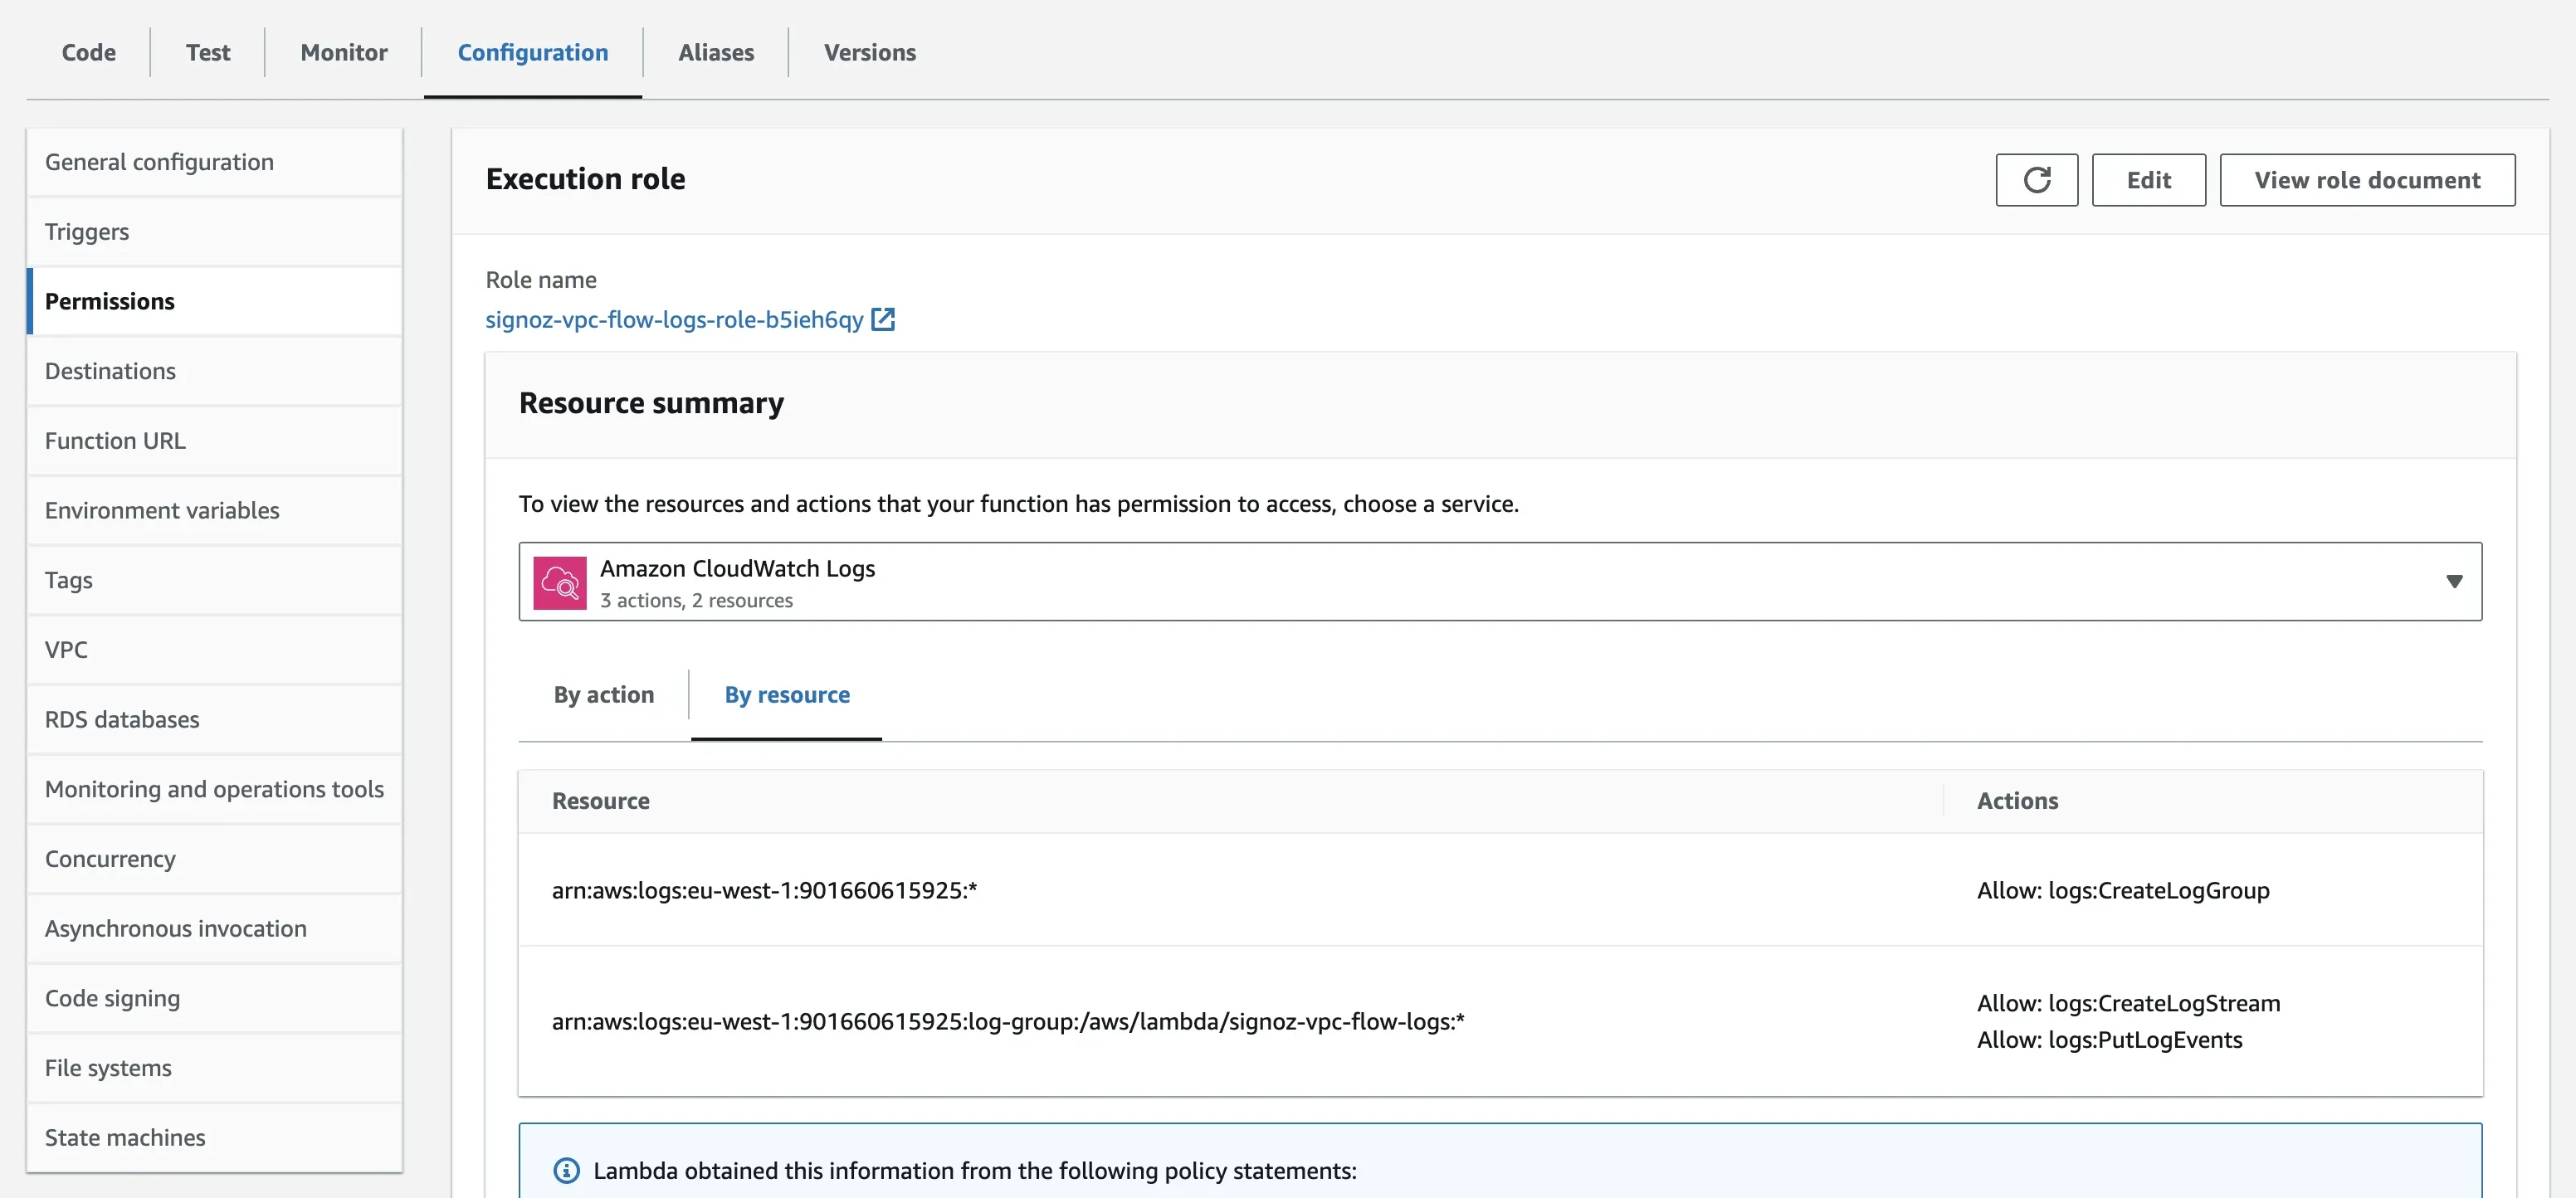
Step 1: Open the Lambda function you created, under Configuration, click on Permissions on the left-hand side and select the Role name. This will redirect you to the AWS IAM Role page.
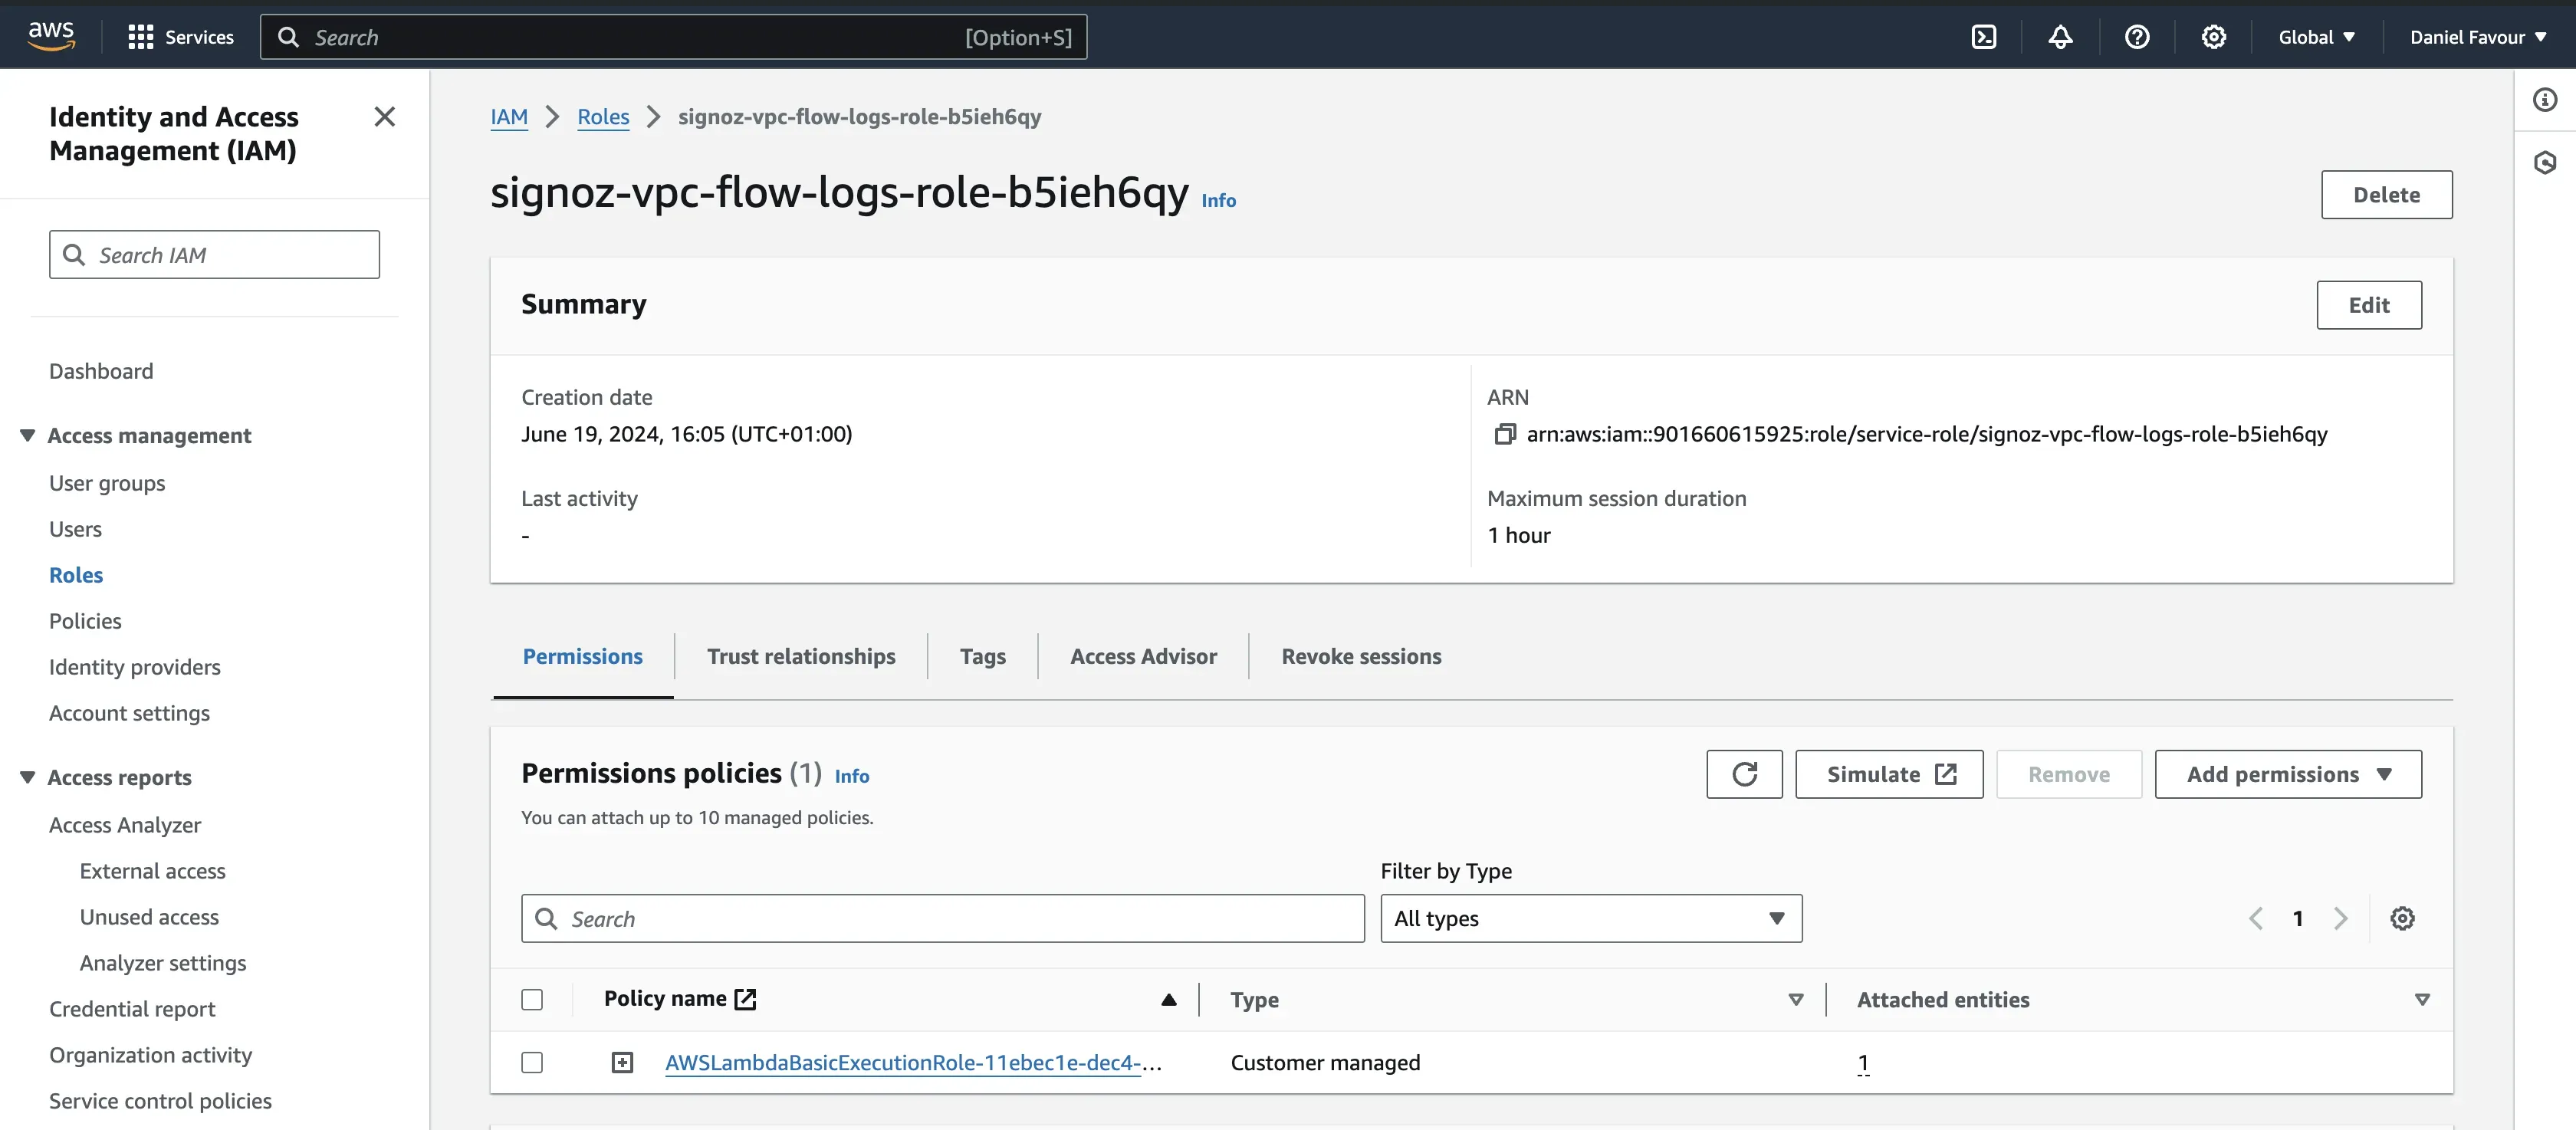
Step 2: To give permission to the role to access Amazon S3, click on Add permission, and in the drop-down, click on Attach Policies.
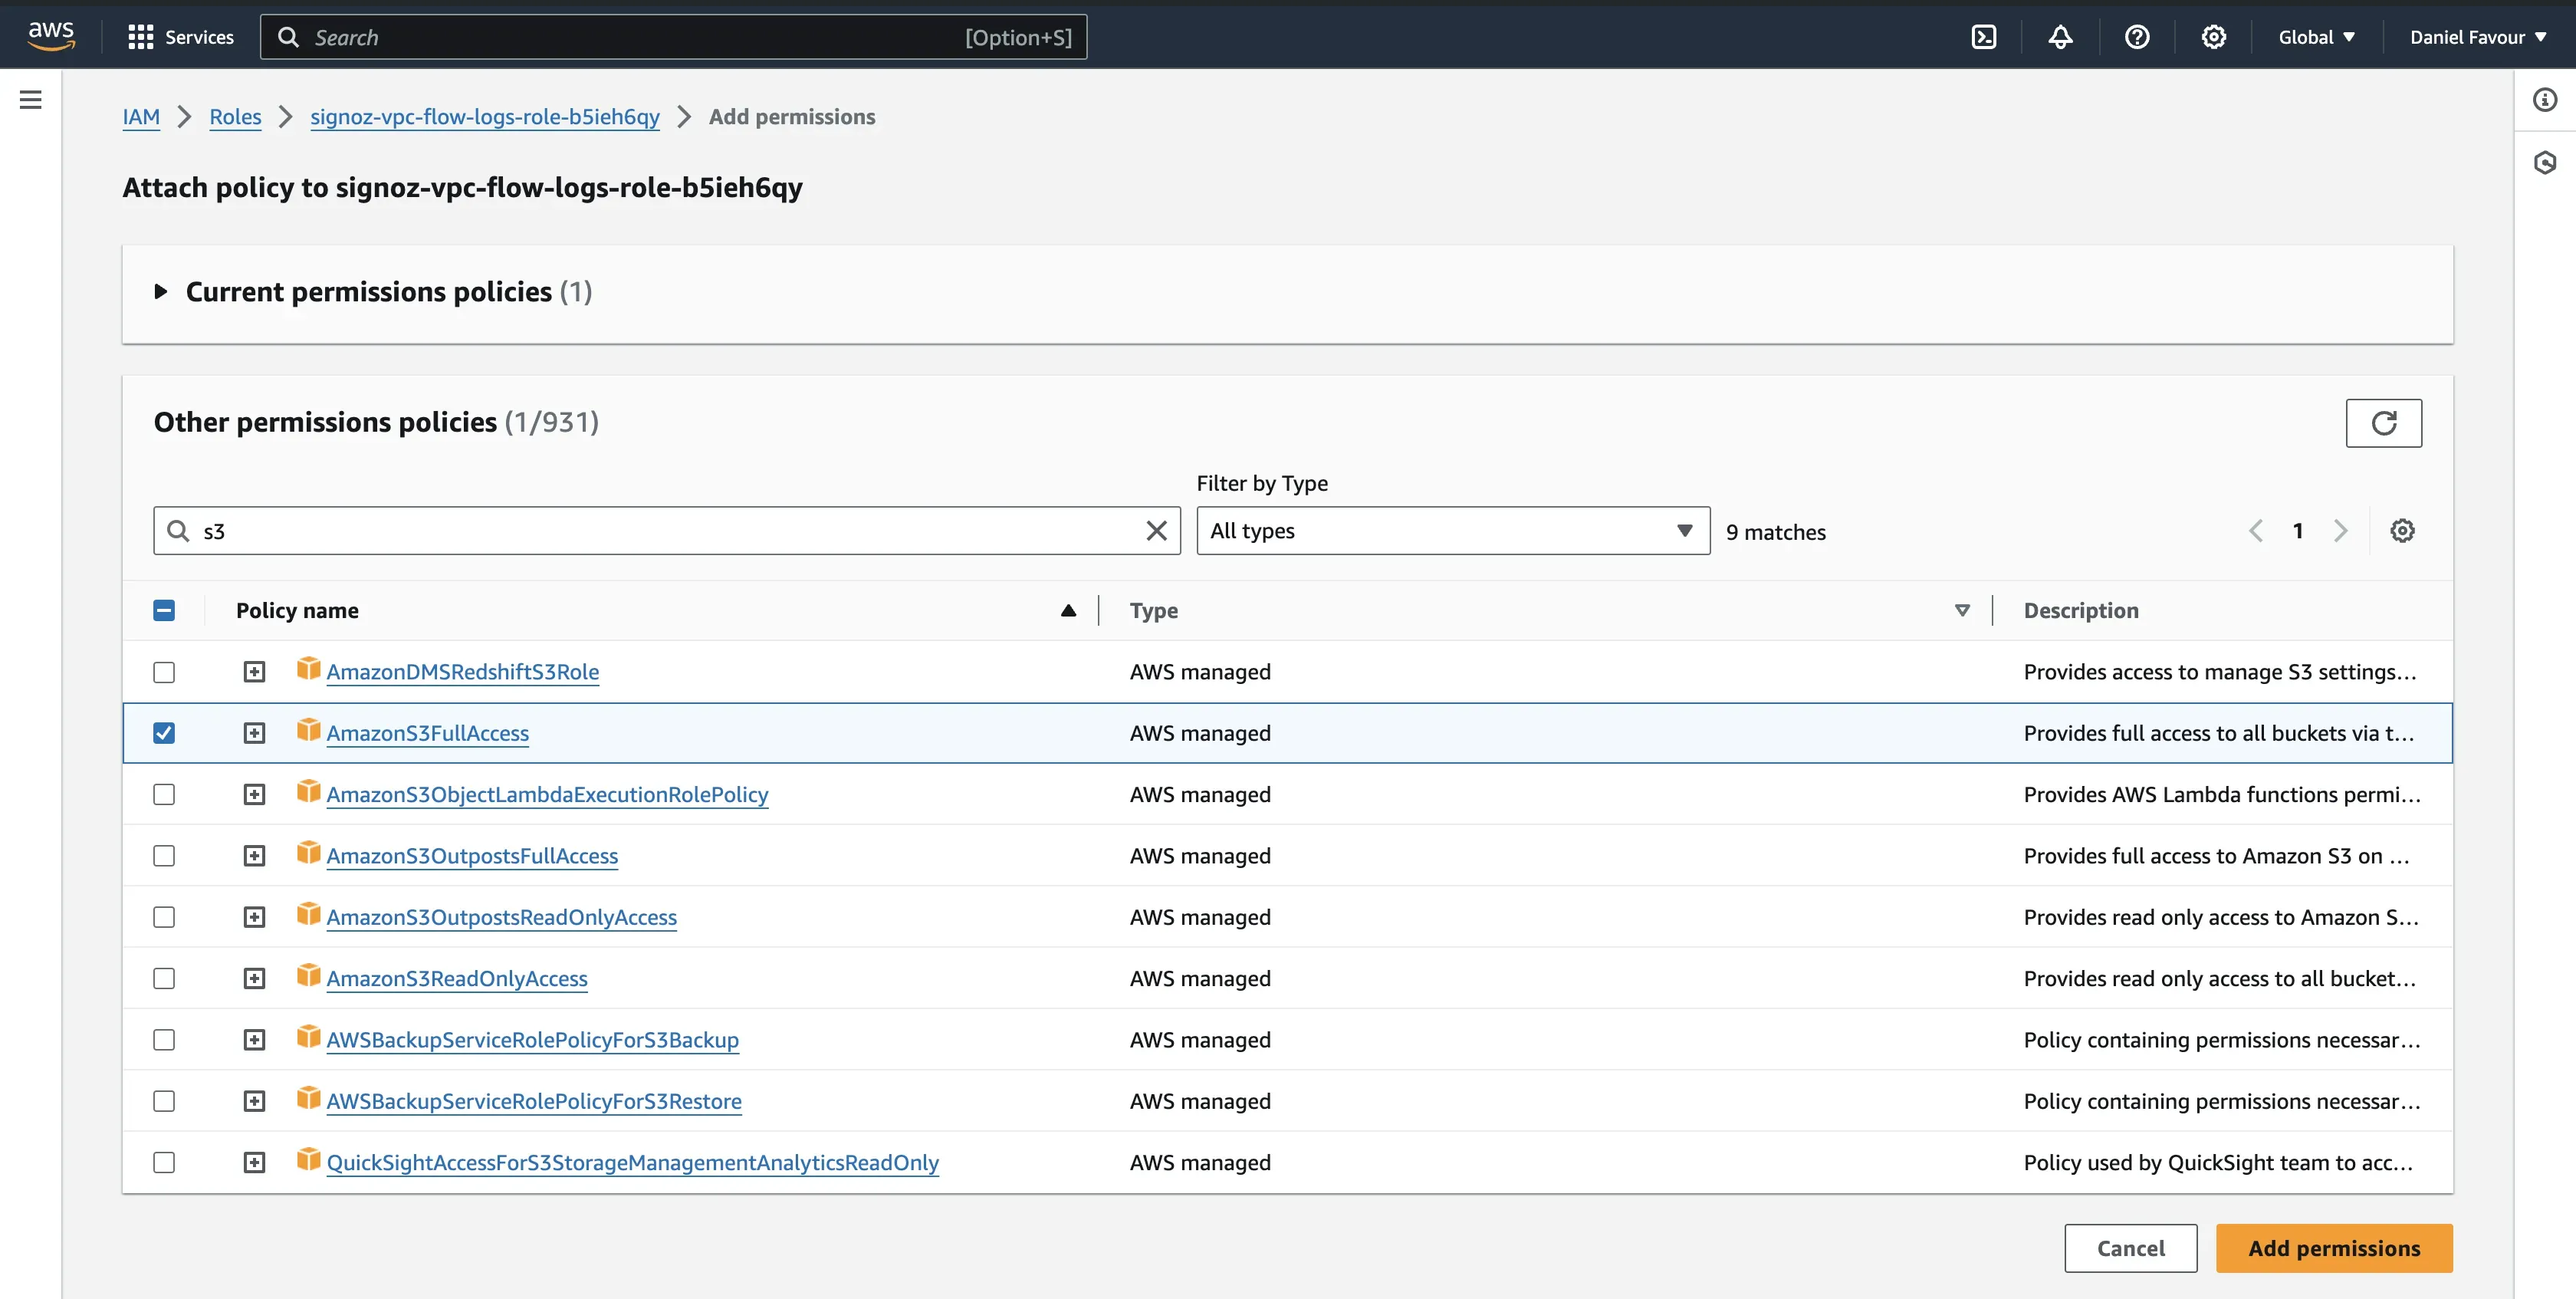
Search for S3, and you will see a policy named AmazonS3FullAccess. Select the policy and click on Add permissions.
Trigger the Function
Now that the Lambda function can access Amazon S3, you need to add a trigger. This trigger automatically invokes the Lambda function whenever a new VPC flow log file is created or updated in the S3 bucket.
Step 1: Open your Lambda function and click on the Add trigger button.

Step 2: For your trigger configuration, choose S3 as your source, and for the bucket field, select the bucket containing the VPC flow logs. For the event types field, you can select the events of your choice. The trigger will occur depending on what option(s) you choose here. By default, the All object create events will be selected.
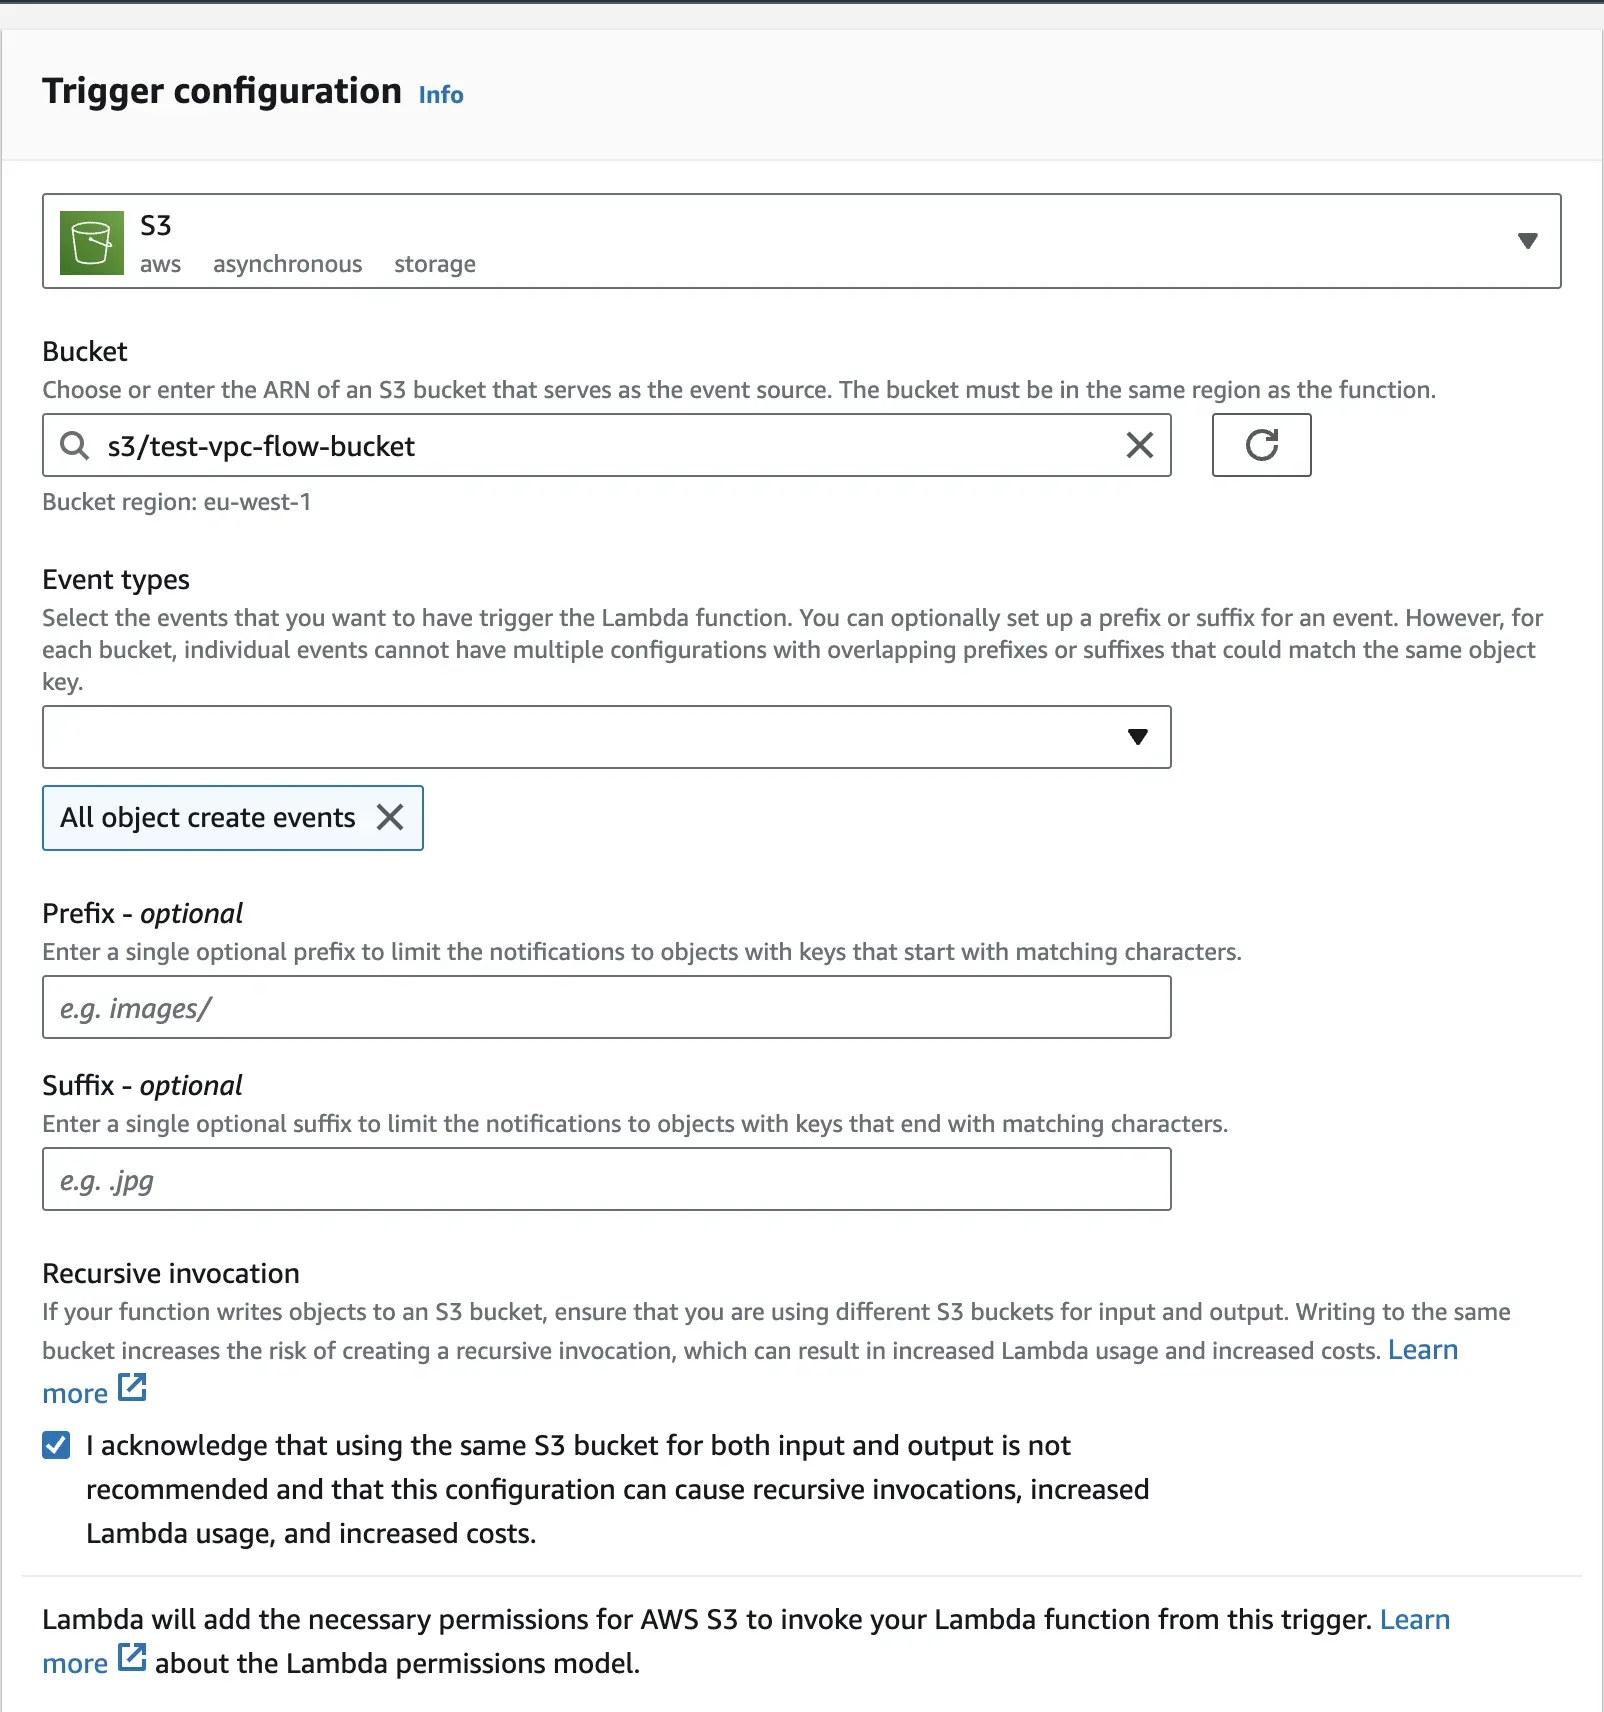
Verify the settings, scroll to the bottom of the page, and click on the Add button to add this trigger.
Create a Request Layer
Once your trigger has been set up, the next step will be to create a layer. AWS Lambda lets you to manage your function's library and dependencies through layers, which it can easily understand and integrate into your Lambda function's execution environment. A layer is a ZIP archive that contains libraries, a custom runtime, or other function dependencies.
The request layer will be created using Python’s request module. This module enables the Lambda function to interact with external web services, APIs, and resources over the network. It simplifies the process of sending HTTP requests and handling responses. By default, the Python’s request module is not included in Lambda. To utilize the module within a Lambda function, it's necessary to explicitly add it as a layer. While there may be alternative approaches, it's advisable to adhere to established practices that have been thoroughly tested and proven effective.
Follow the below steps to create the request layer:
Step 1: Run the commands below locally to generate a zip file of the request module. This step requires that you have Python installed.
# make a new directory
mkdir python
# move into that directory
cd python

# install requests module
pip install --target . requests
# zip the contents under the name dependencies.zip
zip -r dependencies.zip ../python
Step 2: To upload your zip file, go to AWS Lambda, and on the Layers page, click on Create Layer. [This is not inside your specific Lambda function, just the landing page of AWS Lambda.]

Step 3: Give the layer a name and an optional description. Select Upload a .zip file, click on Upload and select your generated zip file from the directory where it is saved on your system.
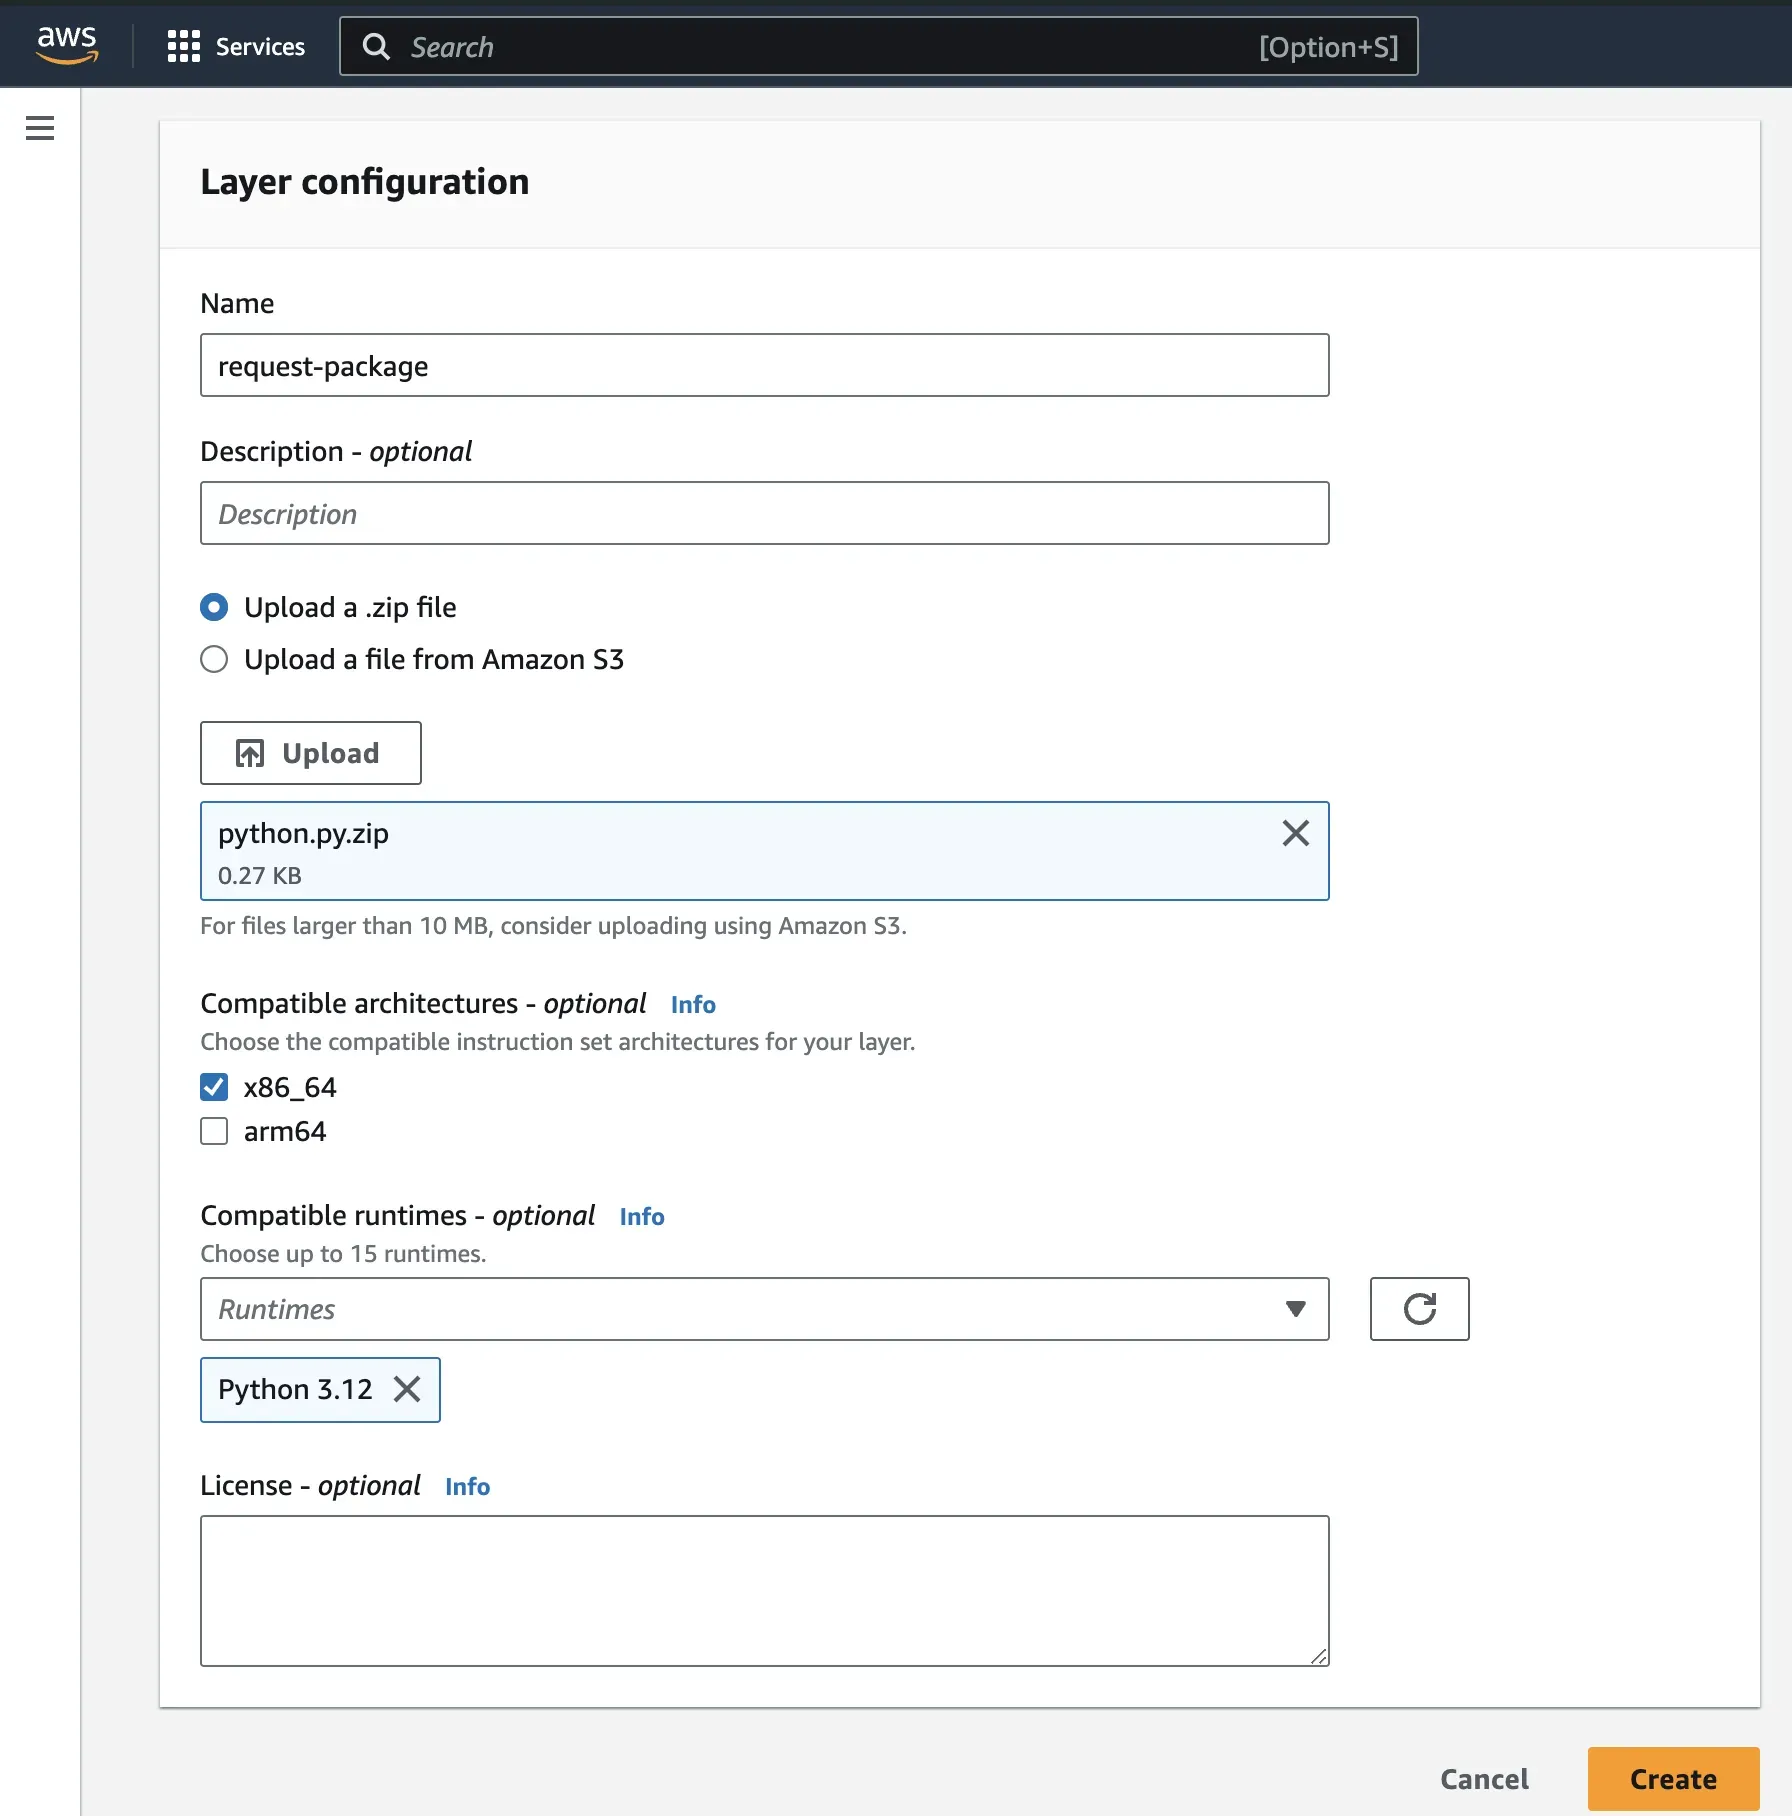
Step 4: Select your desired architecture and pick Python 3.x as your runtime. Click on Create to create the layer.
Add a New Layer
Once you have created the layer containing your external libraries ( in this case, the requests module), you need to associate it with your Lambda function. This allows your function to access and utilize the libraries within that layer during its execution. Without associating the layer with the function, the function wouldn't have access to those libraries and, thus, couldn't perform certain operations that depend on them.
For the request layer to be associated with the Lambda function, it needs to be added directly to the function as a layer. Follow the below steps to add the layer:
Step 1: Go to function, select the function you created, click on Code, and scroll to the end of the page. Under Layers click on Add a layer.
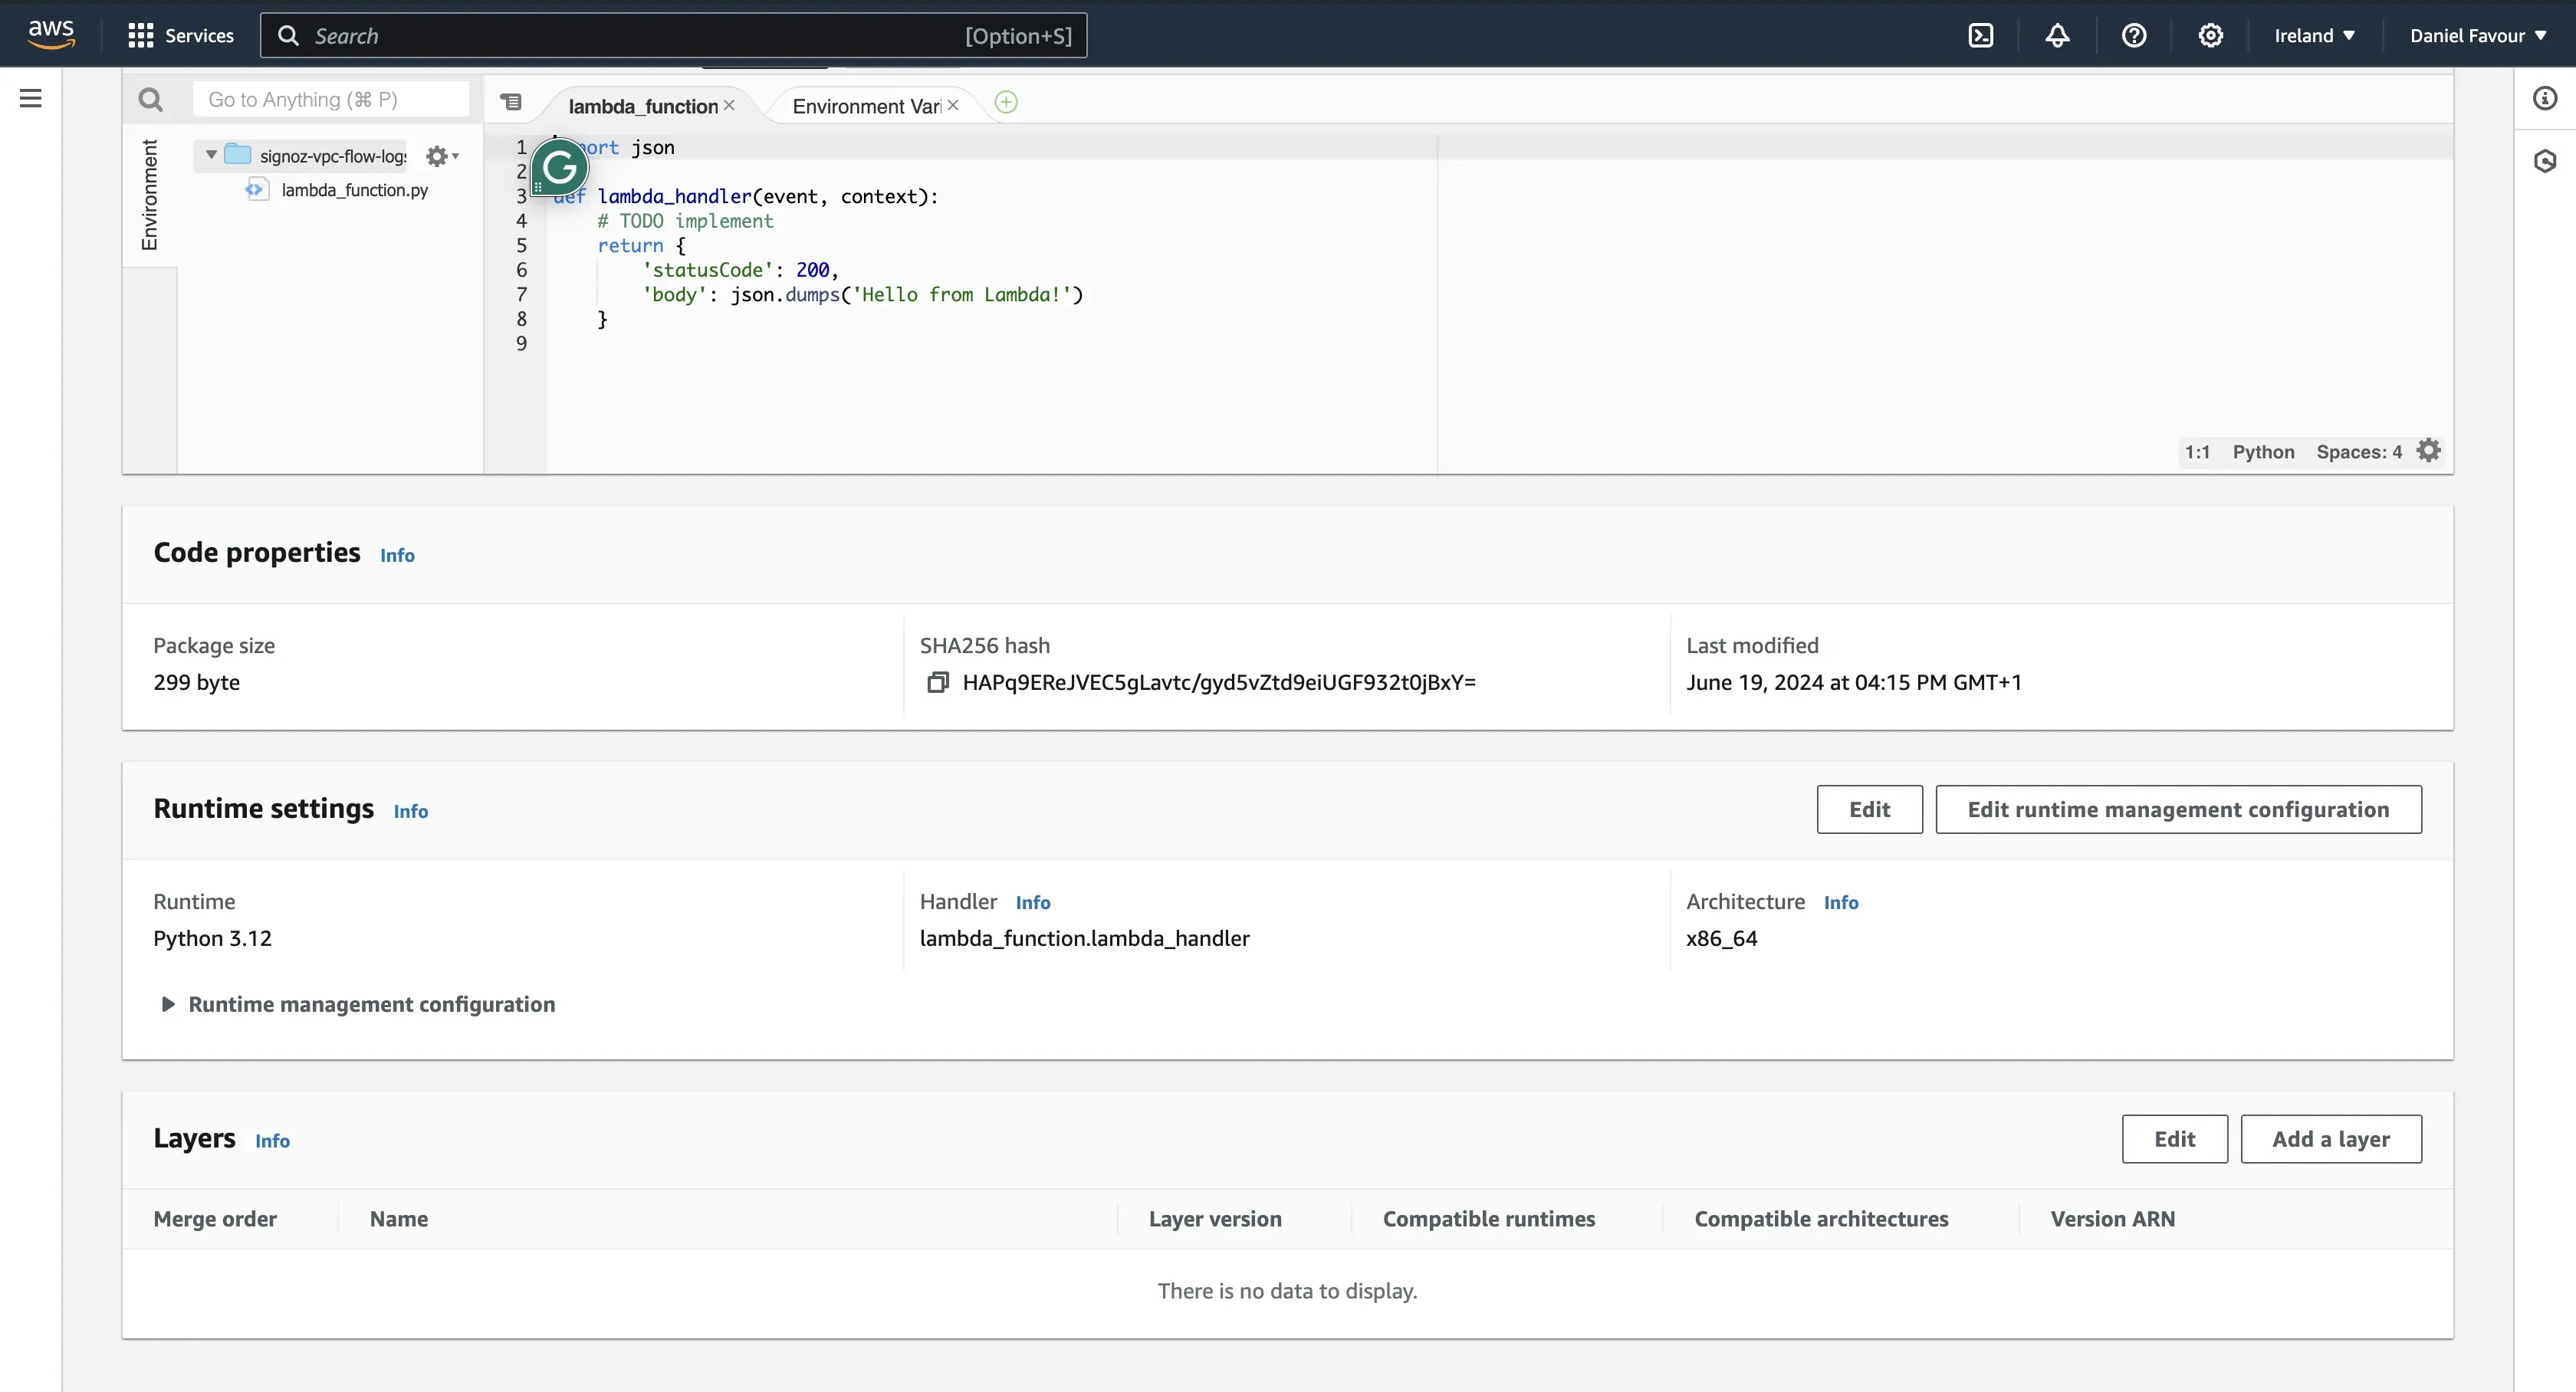
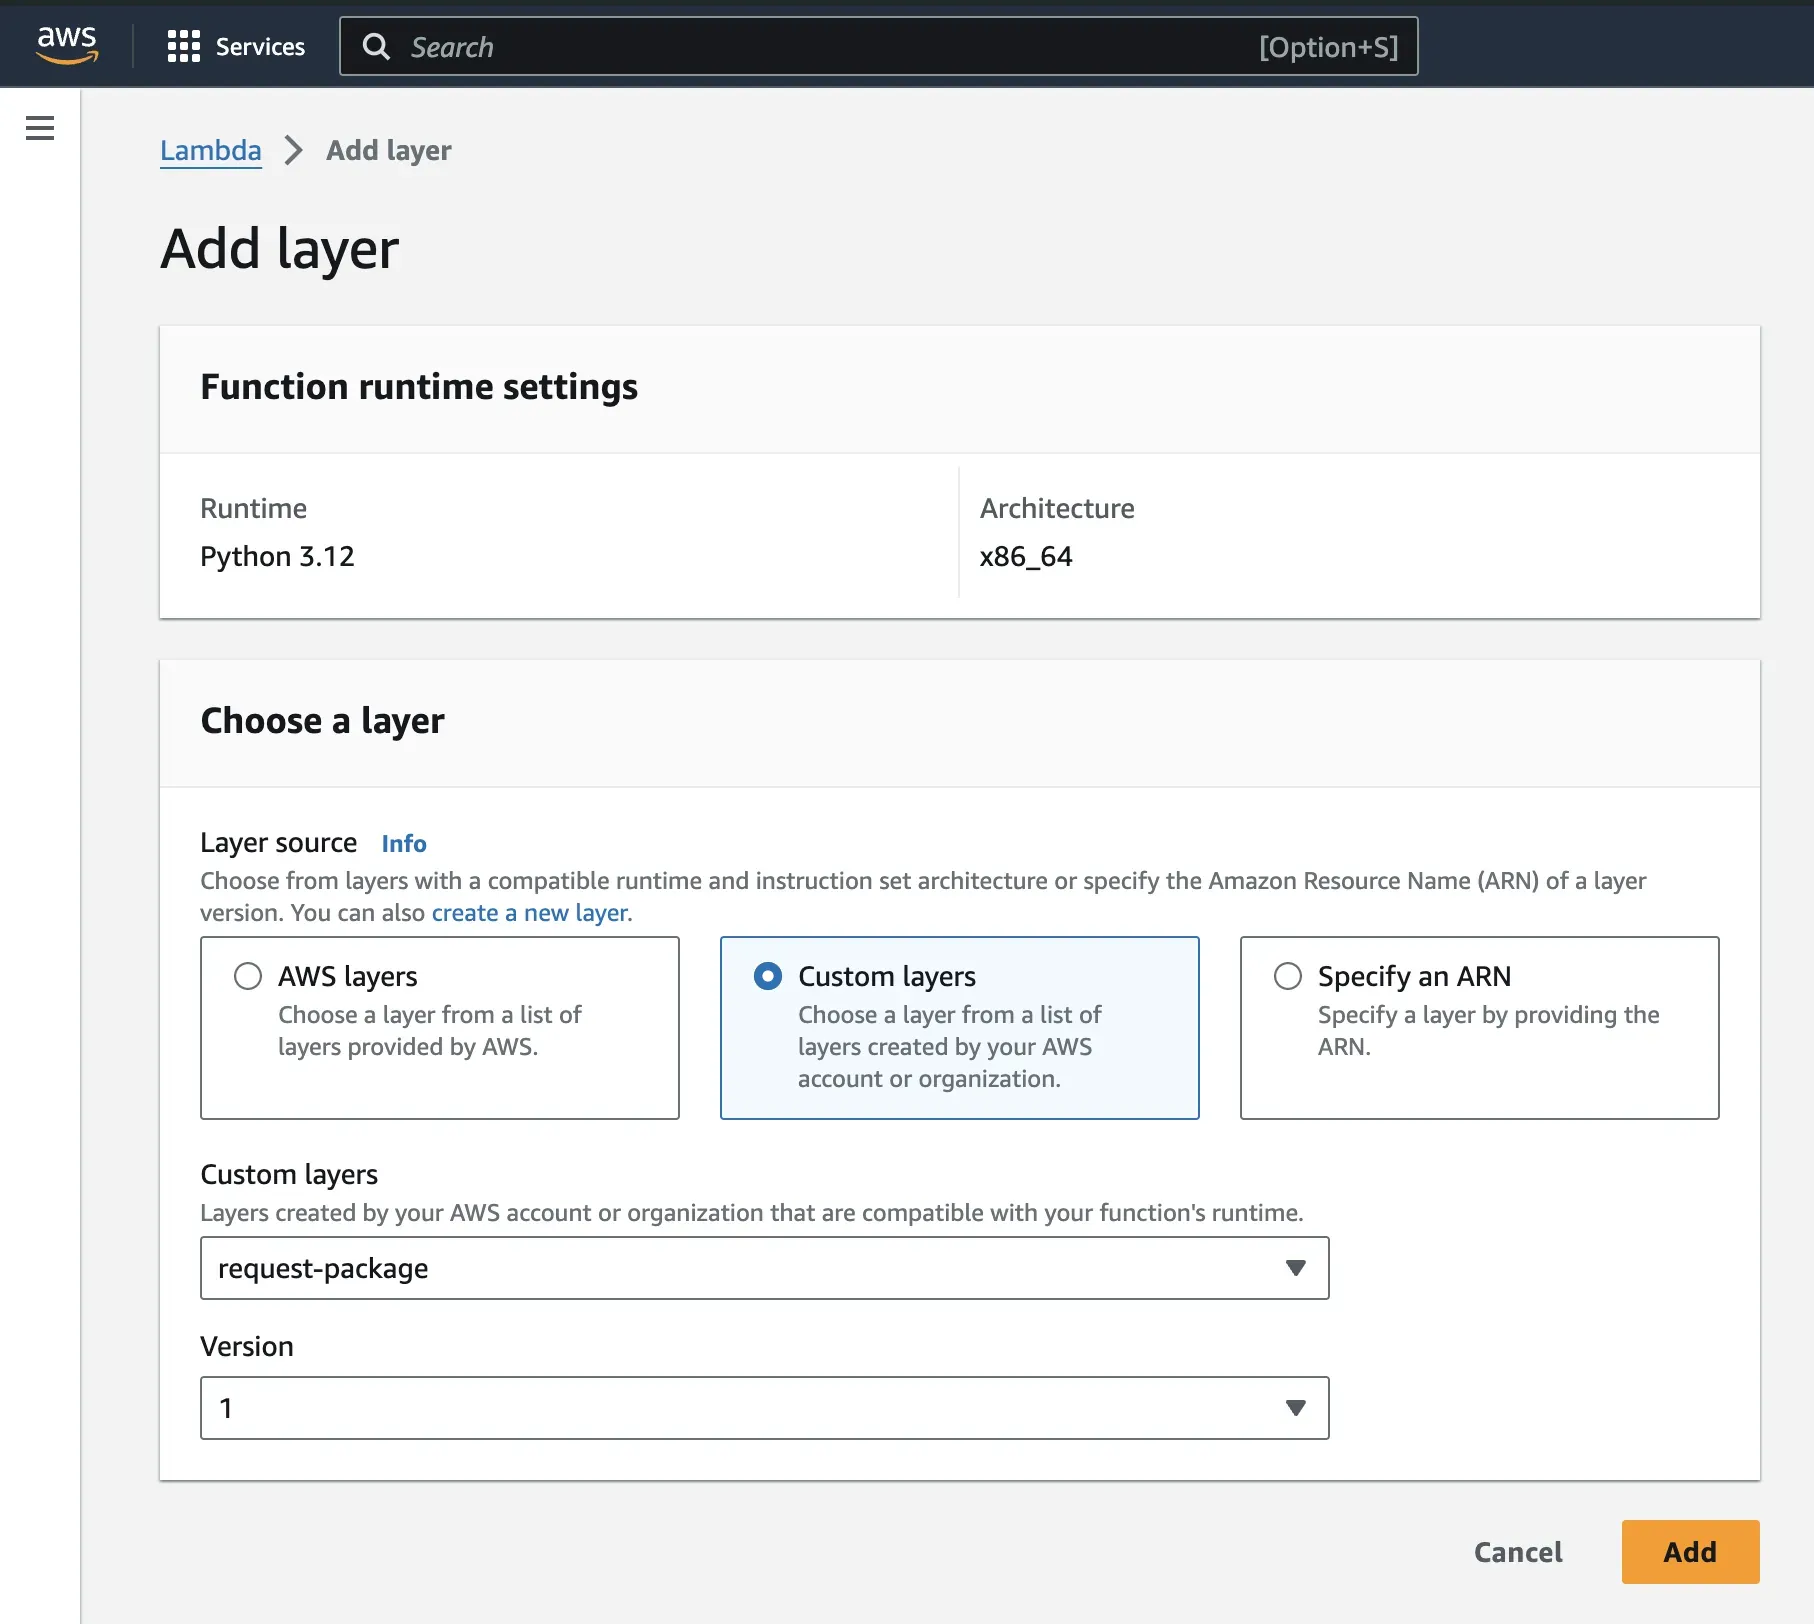
Step 2: Select Custom layers. From the drop-down, select the request package and the version, then add the layer.
Go back to your function and you should see the layer added.

Write the Lambda Function
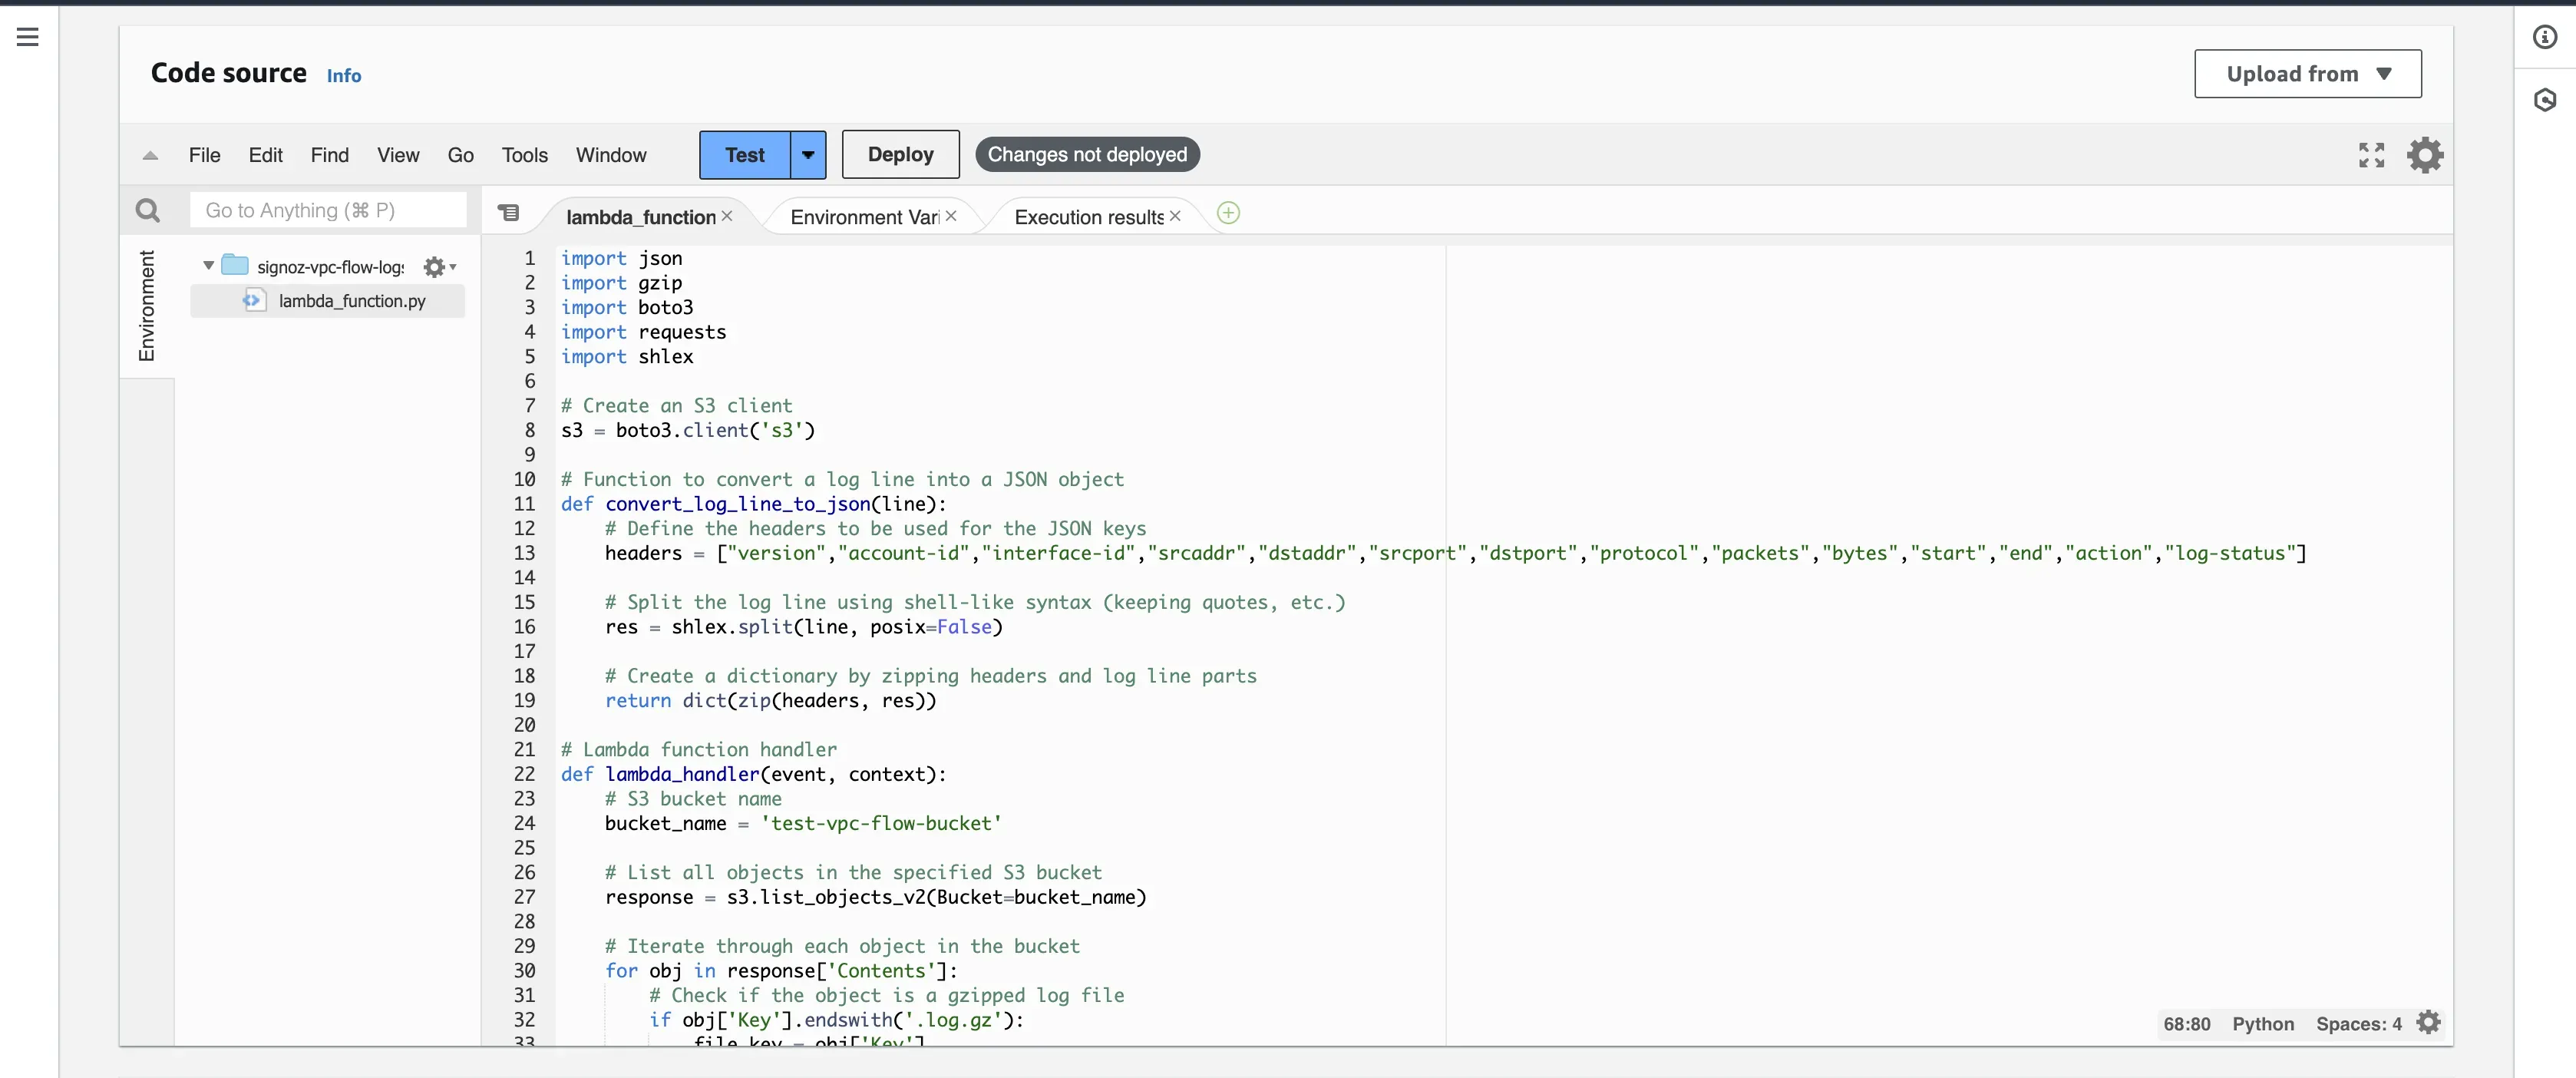
The Lambda function handles the processing and forwarding of flow logs to SigNoz. Copy and save the below function locally. It will be referenced later.
import json
import gzip
import boto3
import requests
import shlex

# Create an S3 client
s3 = boto3.client('s3')

# Function to convert a log line into a JSON object
def convert_log_line_to_json(line):
    # Define the headers to be used for the JSON keys
    headers = ["version","account-id","interface-id","srcaddr","dstaddr","srcport","dstport","protocol","packets","bytes","start","end","action","log-status"]

    # Split the log line using shell-like syntax (keeping quotes, etc.)
    res = shlex.split(line, posix=False)

    # Create a dictionary by zipping headers and log line parts
    return dict(zip(headers, res))

# Lambda function handler
def lambda_handler(event, context):
    # S3 bucket name
    bucket_name = '<name_of_your_bucket>'

    # List all objects in the specified S3 bucket
    response = s3.list_objects_v2(Bucket=bucket_name)

    # Iterate through each object in the bucket
    for obj in response['Contents']:
        # Check if the object is a gzipped log file
        if obj['Key'].endswith('.log.gz'):
            file_key = obj['Key']

            # Download the gzipped file content
            file_obj = s3.get_object(Bucket=bucket_name, Key=file_key)
            file_content = file_obj['Body'].read()

            # Decompress the gzipped content
            decompressed_content = gzip.decompress(file_content)

            # Convert bytes to string
            json_data = str(decompressed_content, encoding='utf-8')

            print(json_data)

            # Split the string into lines
            lines = json_data.strip().split('\n')

            # Convert the list of strings into a JSON-formatted string
            result = json.dumps(lines, indent=2)
            print(result)

            # Load the JSON-formatted string into a list of strings
            list_of_strings = json.loads(result)

            # Convert each log line string into a JSON object
            json_data = [convert_log_line_to_json(line) for line in list_of_strings]
            print(json_data)

            req_headers = {
                     'signoz-ingestion-key': '<SIGNOZ_INGESTION_KEY>',
                     'Content-Type': 'application/json'
                }
            # Specify the HTTP endpoint for sending the data
            http_url = 'https://ingest.in.signoz.cloud:443/logs/json/'  # Replace with your actual URL

            # Send the JSON data to the specified HTTP endpoint
            response = requests.post(http_url, json=json_data, headers=req_headers)

            # Print information about the sent data and the response received
            print(f"Sent data to {http_url}. Response: {response.status_code}")
The above function processes VPC flow logs stored as gzipped files in your S3 bucket. It reads the log files, decompresses them, parses the log lines into structured JSON objects, and then sends this processed data to SigNoz using the requests library.
Note: Replace bucket name with the actual name of your s3 bucket and signoz access token with the ingestion key/ingestion token for your SigNoz cloud account. For http_url , replace with your actual URL. Check if your region is India (in), United States (us) or Europe (eu).
Testing your Lambda Function
After writing the Lambda function, it needs to be deployed and tested. Before you deploy and test it, you need to first increase the timeout setting for the Lambda function, as data transfer from S3 to an external endpoint can take a few minutes, and by default, the Lambda function times out in 3 seconds.
Follow the steps below to increase the timeout and to deploy and test the function.
Step 1: To increase the timeout time, under your Lambda function, go to Configuration → General Configuration → Edit button and set it under 10 mins. Usually, the code is executed within 1-4 minutes at maximum.

Step 2: After increasing the timeout setting, go to your Lambda function. Under Code, click on the test button dropdown option, and select Configure test event.

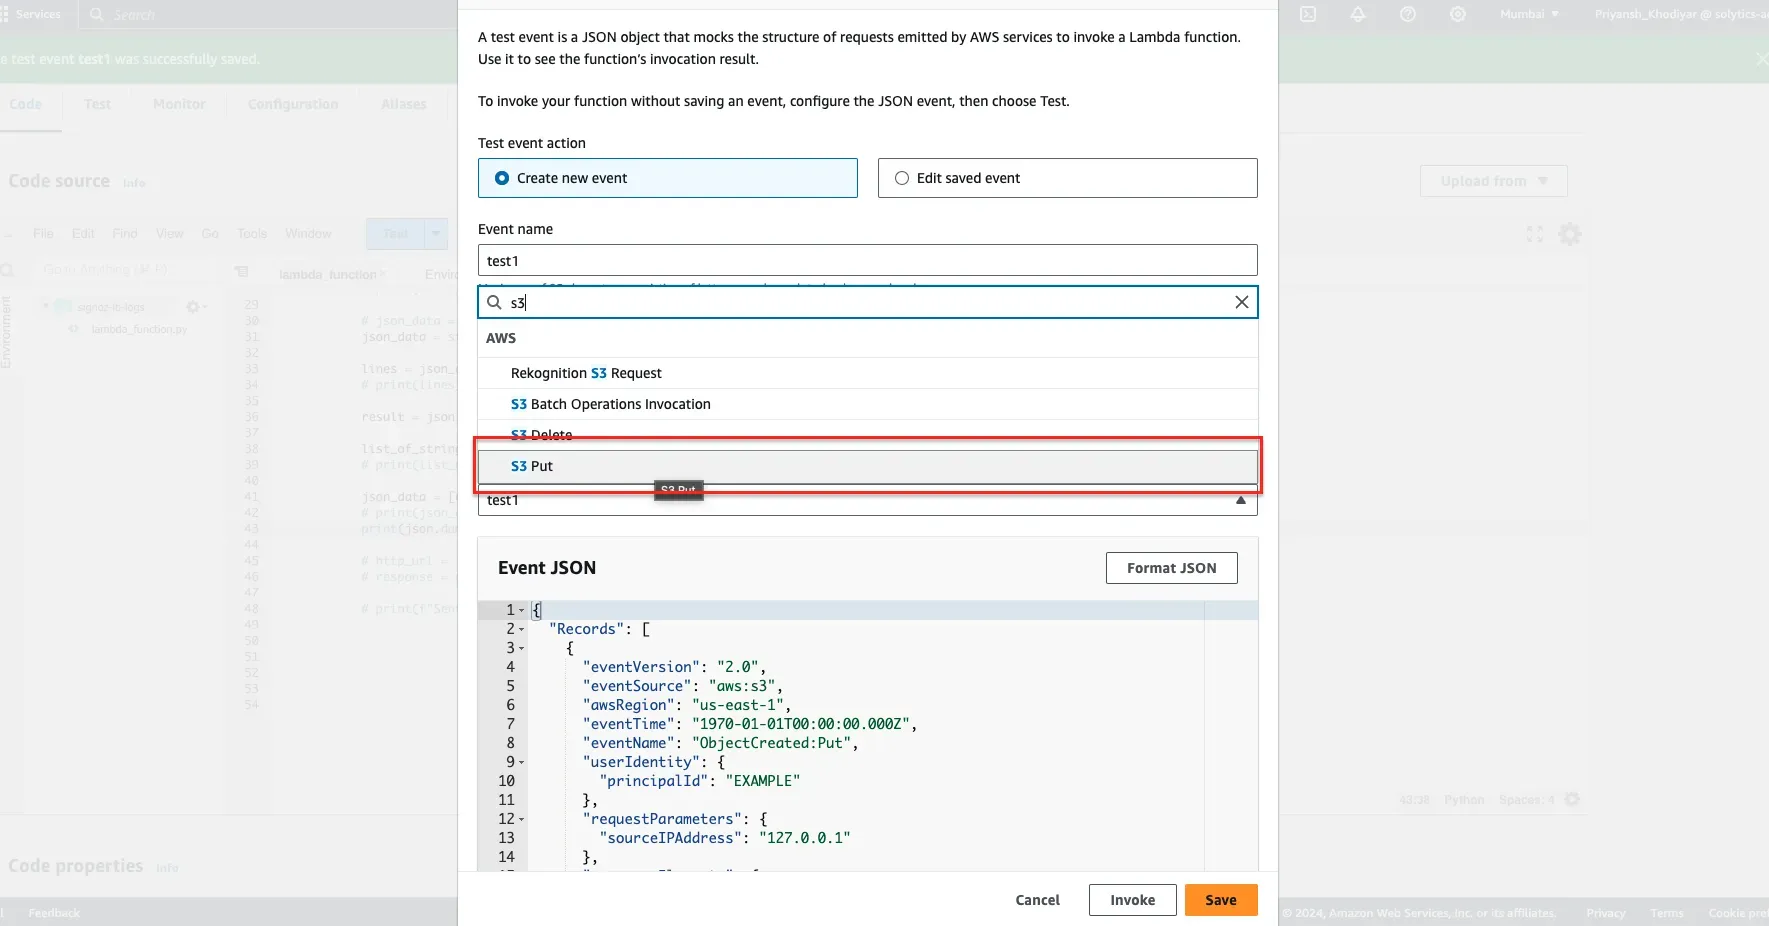
For test event action, select Create new event and give the test event a name. Under the template drop-down menu, search for S3 Put and click on Save.
This test event simulates the scenario where a new object (like a VPC Flow Log file) is uploaded or updated in your S3 bucket, triggering the Lambda function to process the event as if an actual file upload occurred.
Step 3: Go back to your function. Under Code, select lambda_function and paste in the Lambda function code that you copied and saved on your local earlier.
Click on the Deploy button and then the Test button to deploy and test the function.
Below is a successful execution result. The flow logs are printed out, and the data is sent to the SigNoz endpoint.

Visualize the VPC Flow Logs in SigNoz
Once your VPC Flow Logs are successfully forwarded to SigNoz, you can gain valuable insights into your network traffic by visualizing them in the SigNoz logs dashboard. To access and explore these logs, follow these steps:
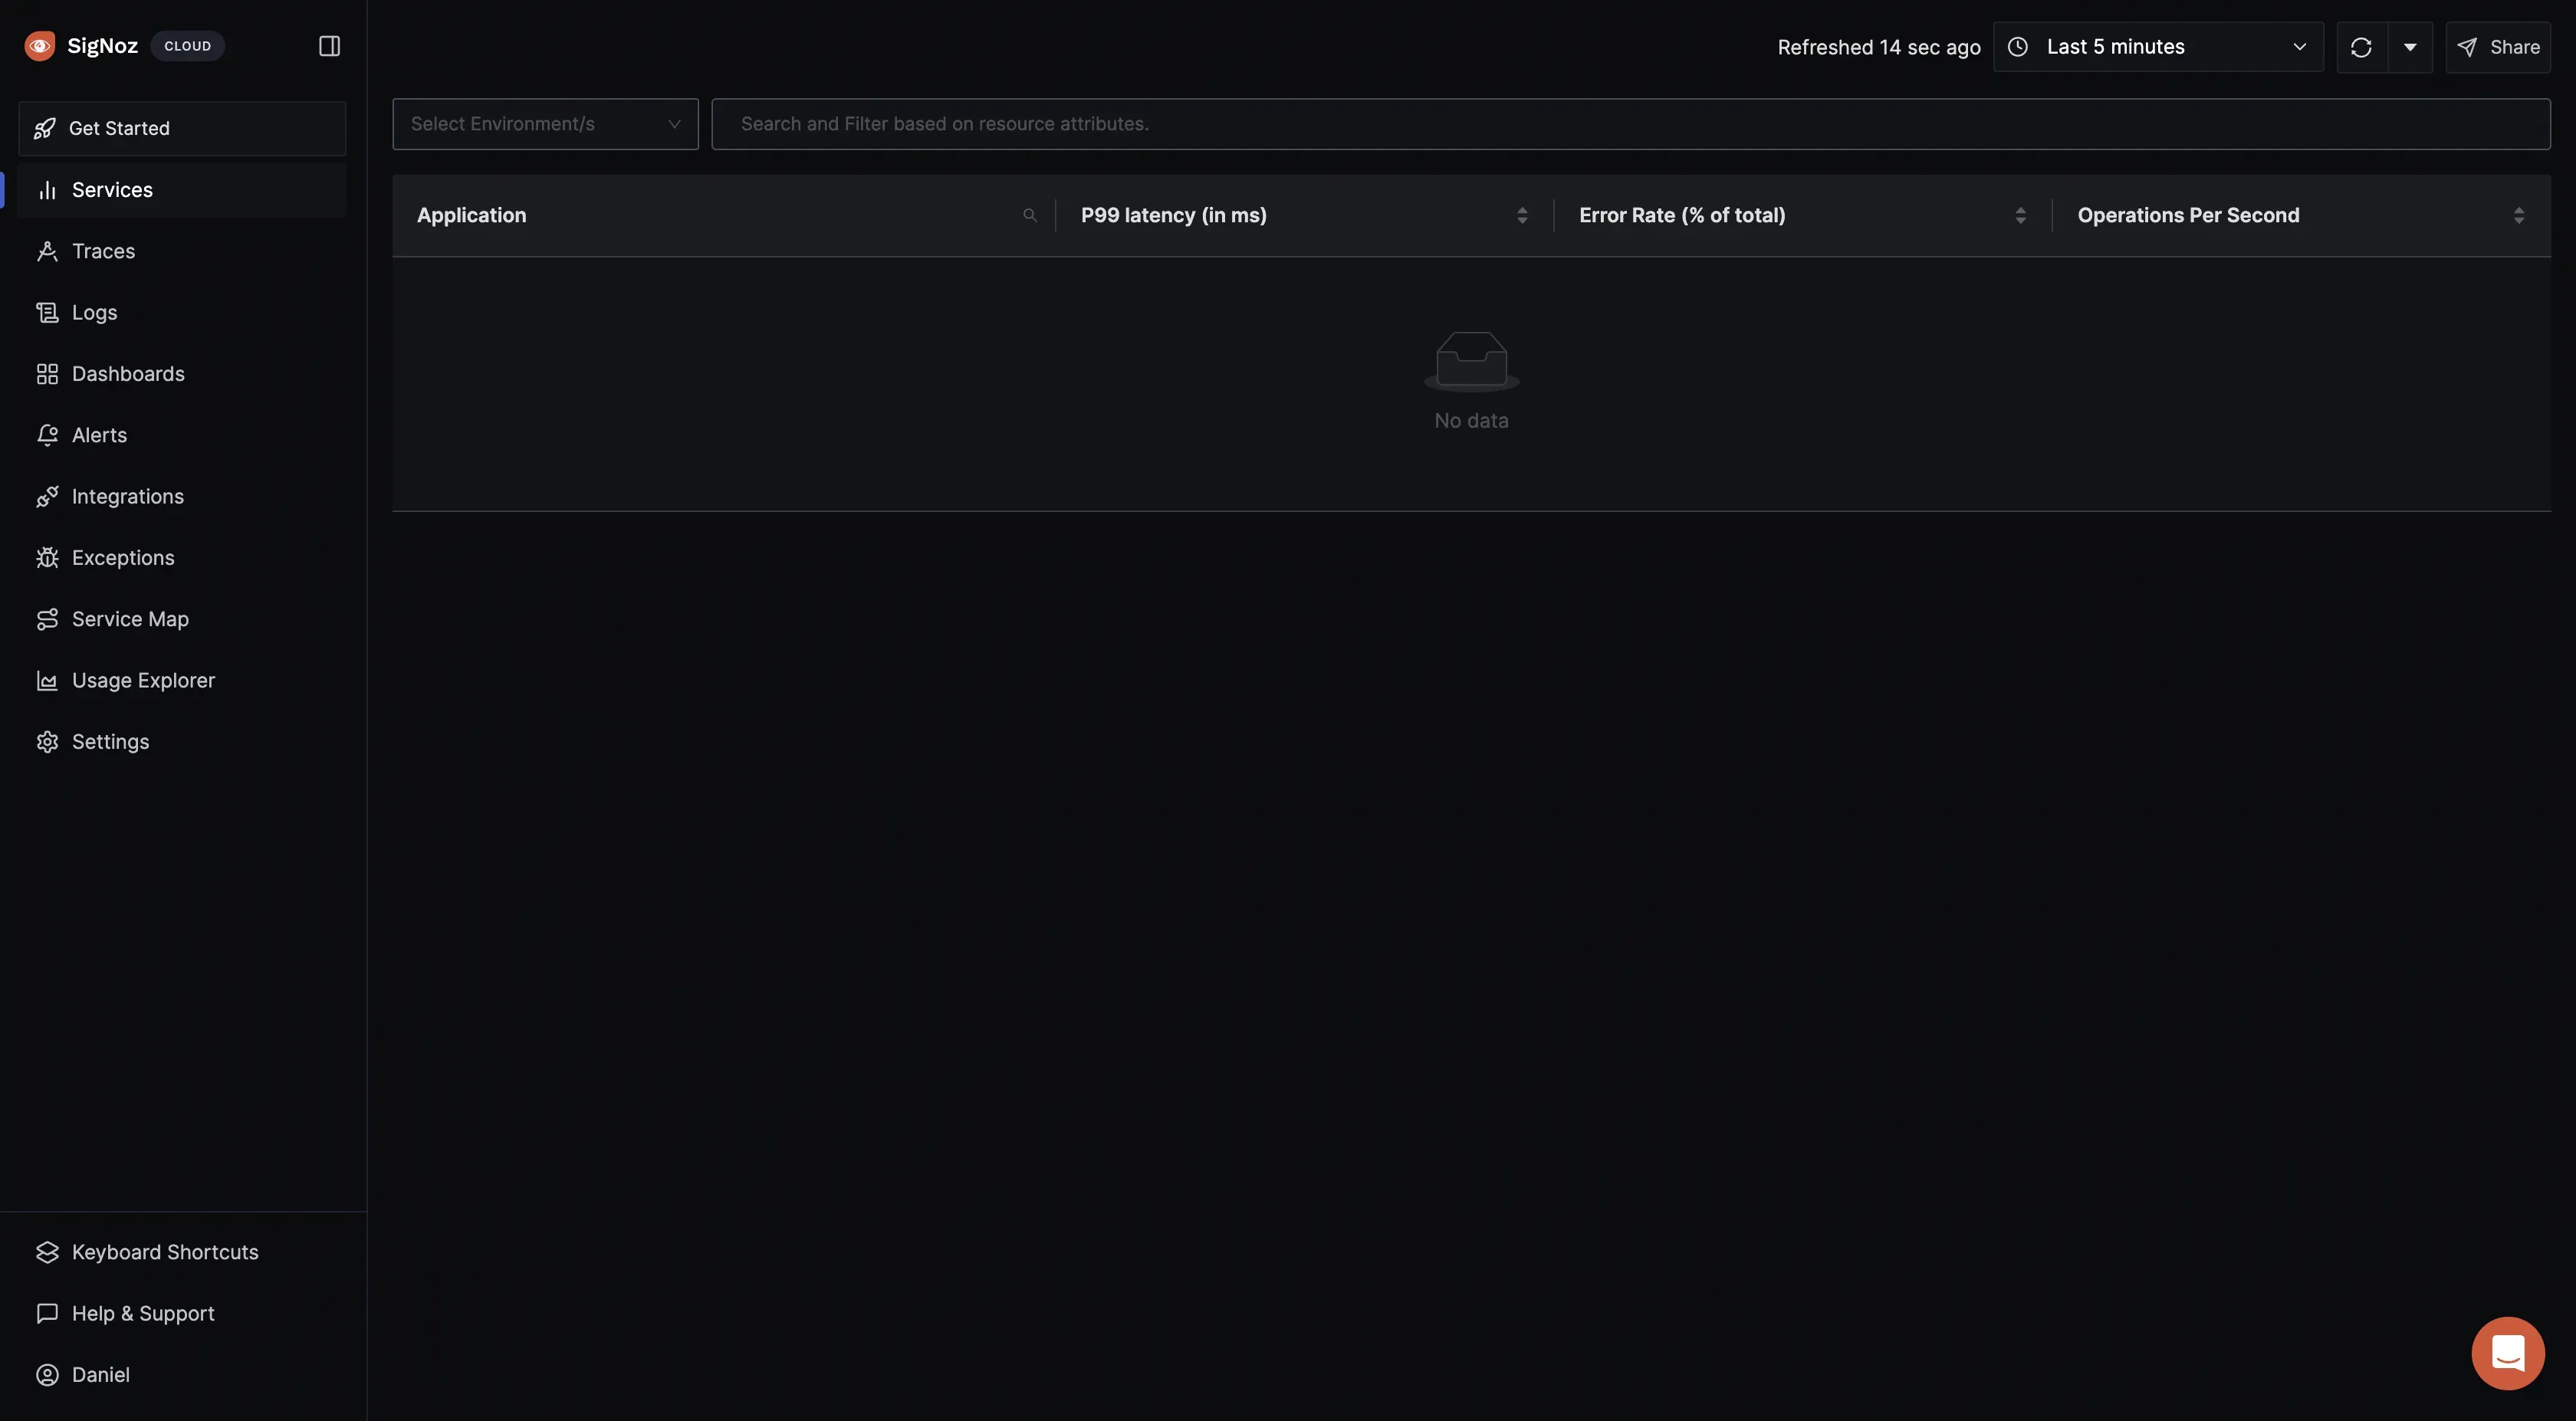
Step 1: Open your SigNoz cloud account in your browser and click on the Logs section.
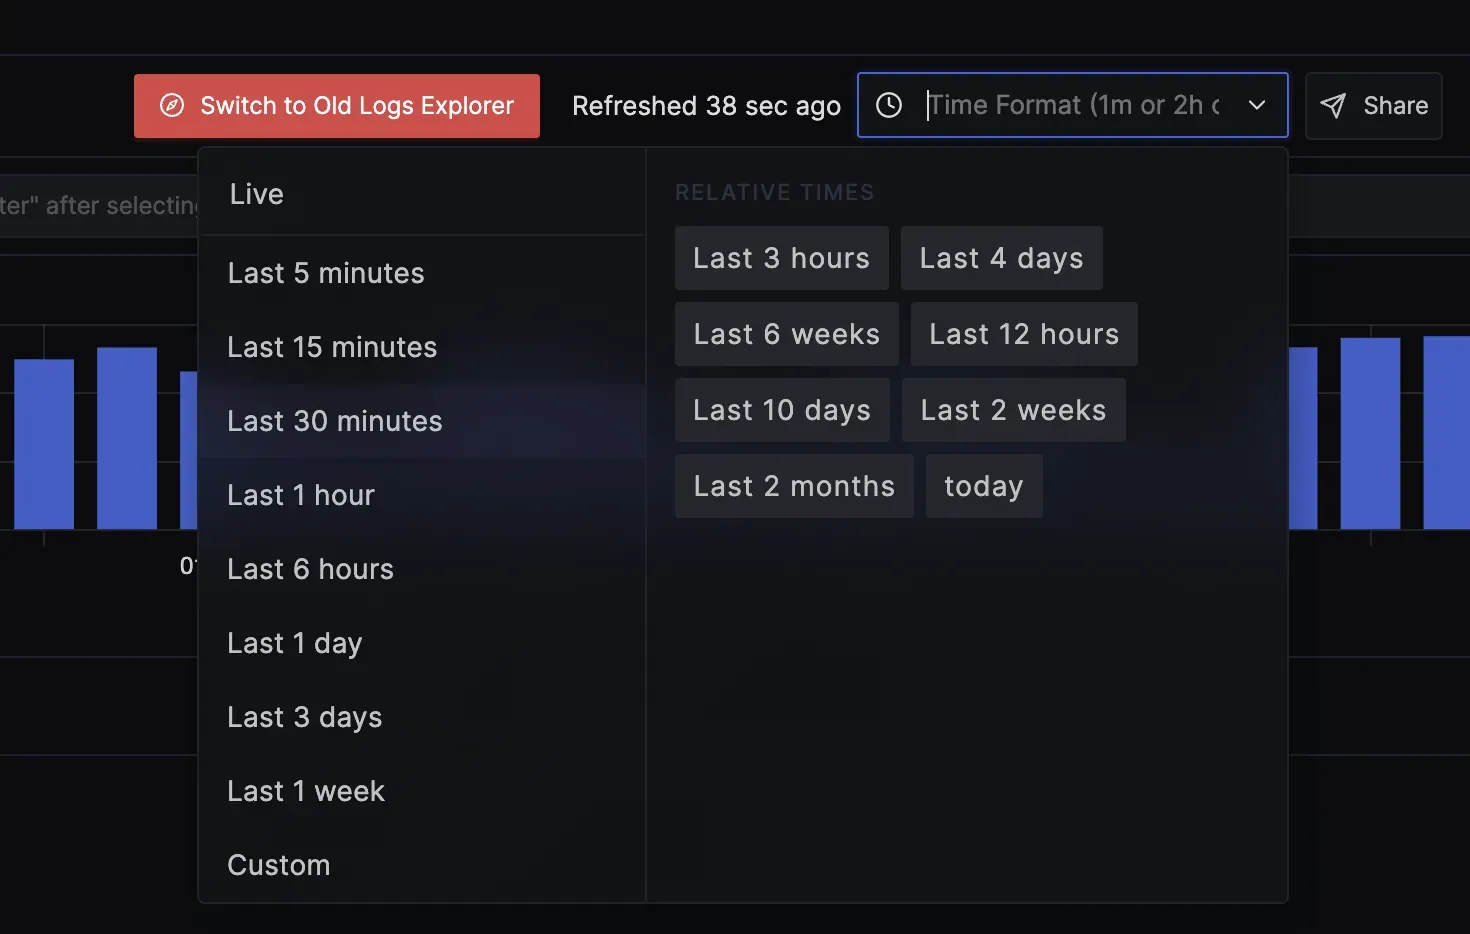
Step 2: The time filter is located at the top right corner of the Logs page. From the drop-down menu, select Live to see the most recent logs.
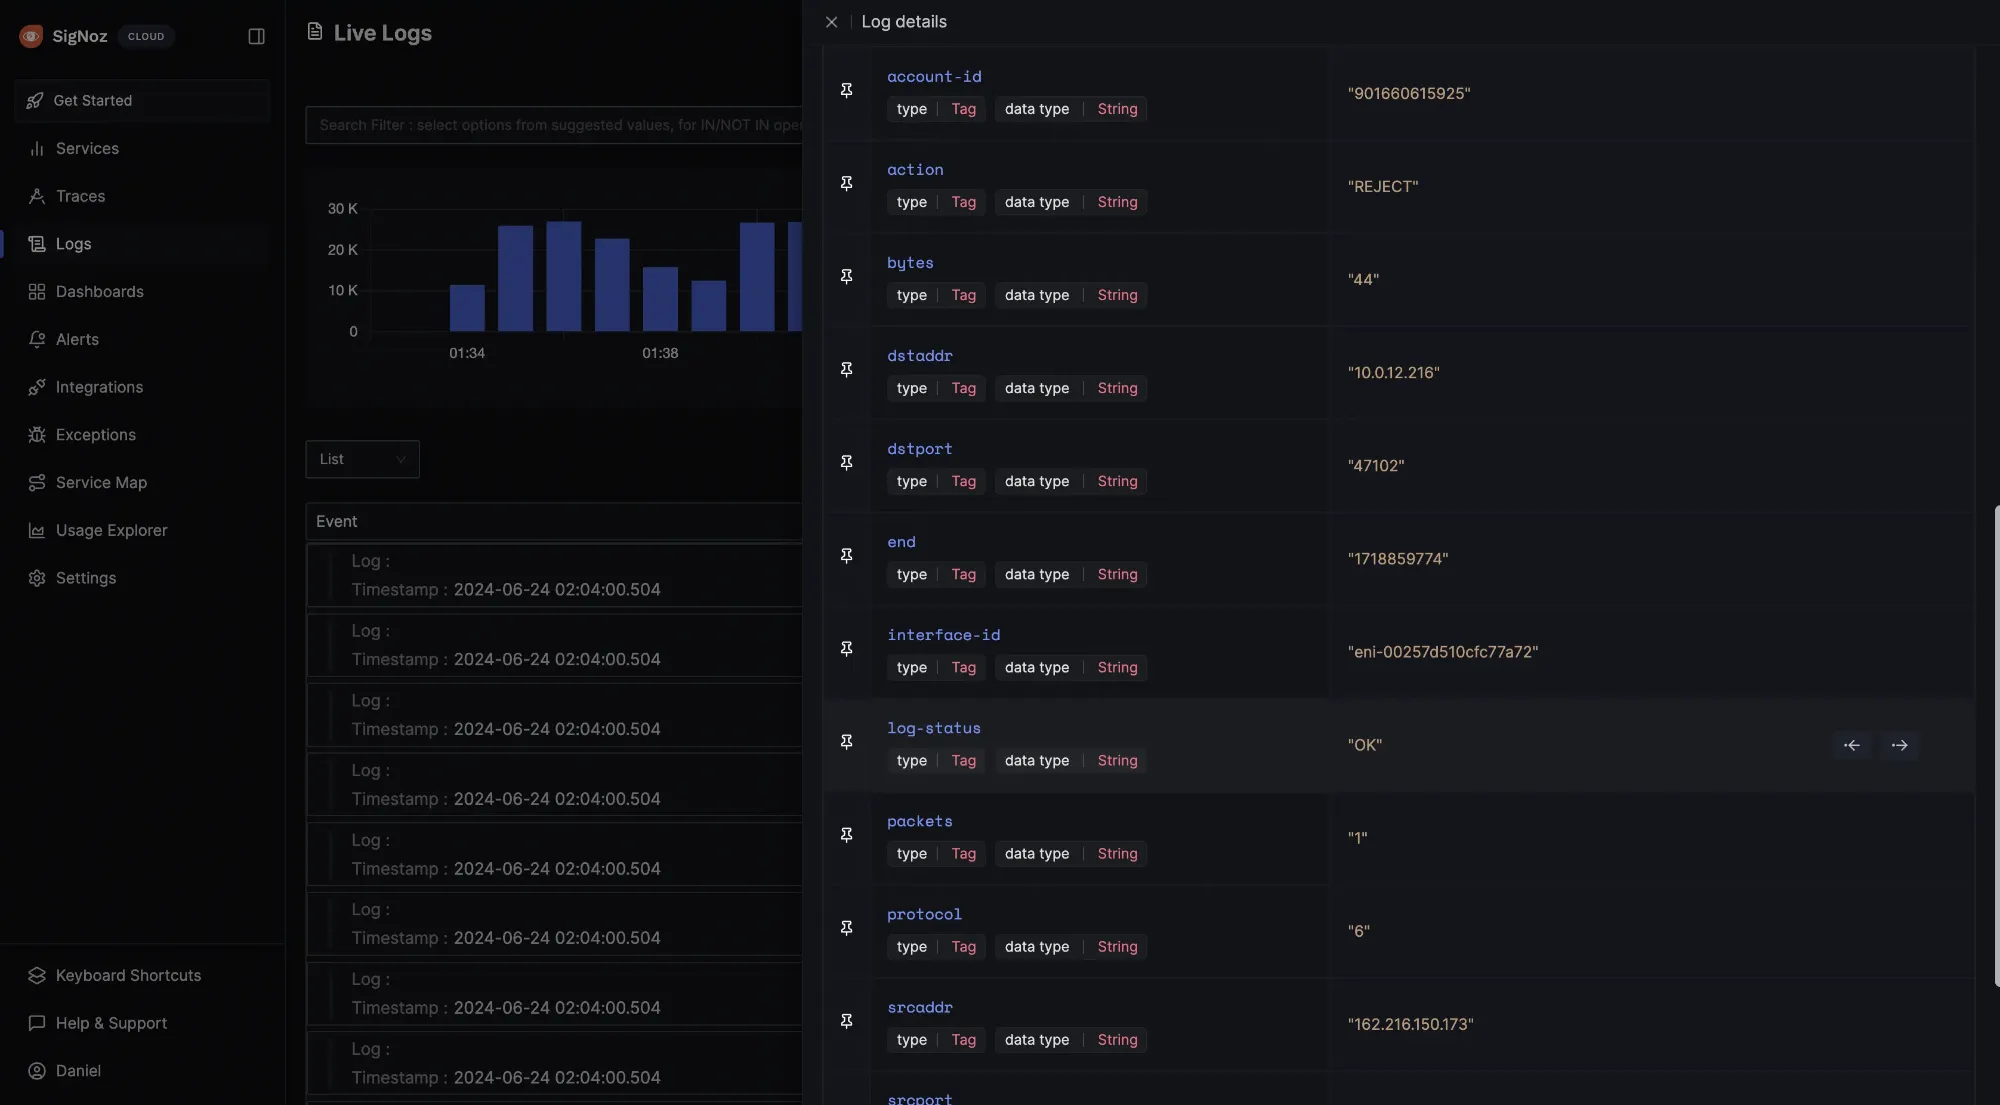
You should see the recent logs sent from the S3 bucket.
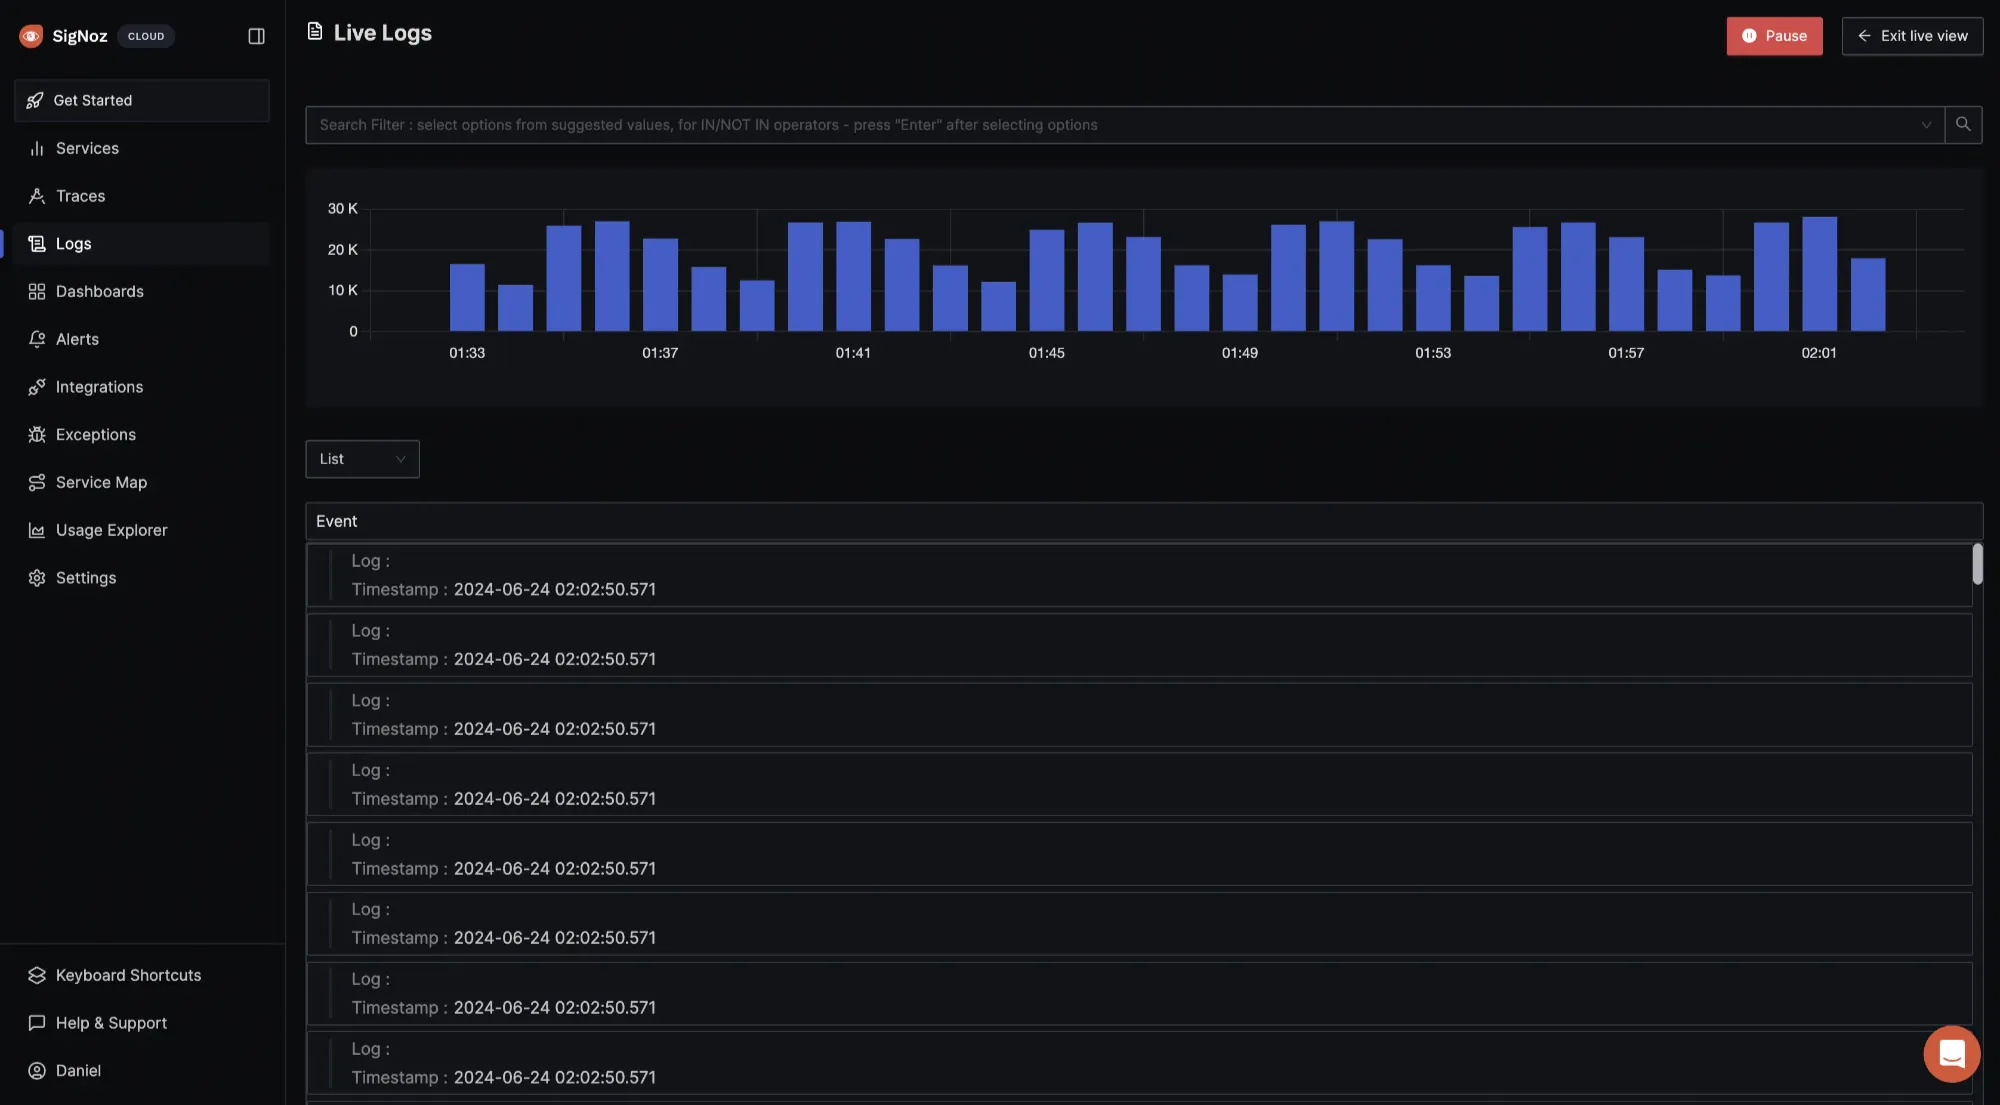
You can also click on any of the logs to see more information.
Conclusion
In this guide, you have explored the fundamentals of VPC Flow Logs, including their functionality and significance in monitoring network traffic. You learned about the components that make up each log, assessed their limitations, and learned the steps to create and forward them to SigNoz for visualization and analysis.
VPC Flow Logs are powerful for monitoring and analyzing network traffic within your AWS environment. By integrating VPC Flow Logs into your network management practices, you can achieve a more transparent and secure cloud environment, making informed decisions that optimize your operations.
FAQs
What are VPC flow logs?
They are detailed network traffic records in your Virtual Private Cloud (VPC).
Where to view VPC flow logs?
In the configured log destination (CloudWatch Logs, S3, or Data Firehose for AWS).
How do you create AWS VPC flow logs?
In the Amazon VPC console, select your VPC or subnet, then choose "Create flow log" from the Actions menu. You can also do this with the AWS CLI.
Is VPC flow log free?
No, you are charged for the storage and data transfer of logs.
What does VPC stand for?
Virtual Private Cloud.
What is VPC and its use?
A logically isolated network in the cloud for launching resources.
What are the available fields in VPC flow logs?
Source/destination IPs, ports, protocol, packet/byte count, timestamps, action, etc.
How do you enable VPC flow logs in GCP?
Through the Google Cloud Console or gcloud command-line tool.
How to use NSG flow logs?
Similar to VPC flow logs, they monitor traffic at the Network Security Group level in Azure.
What is CloudWatch in AWS?
CloudWatch is an AWS service that monitors and observes AWS resources and applications, collecting data for analysis and visualization.
How many types of VPC endpoints are available?
There are two types of VPC Endpoints: Interface Endpoints and Gateway **Endpoints.
What is the difference between CloudWatch and flow logs?
CloudWatch monitors AWS resources and applications, while flow logs capture detailed information about IP traffic within a VPC.
What are flow logs in Azure?
Azure Flow Logs record network traffic data for monitoring, auditing, and troubleshooting network activities.
What are the use cases of flow logs in AWS?
Network monitoring, security analysis, troubleshooting, compliance, and optimization.
How do you enable VPC flow logs in GCP?
To enable VPC flow logs in GCP, configure flow logging on a VPC subnet or a VPC network in the Google Cloud Console.

