OpenTelemetry can be used to generate telemetry data from your Golang applications. The collected data can then be sent to an observability tool for storage and visualization. OpenTelemetry is an open-source project under the Cloud Native Computing Foundation (CNCF) that aims to standardize the generation and collection of telemetry data.
In this tutorial, we will use OpenTelemetry Golang libraries to instrument a Golang application and then visualize it using an open-source observability tool - SigNoz.
Steps to get started with OpenTelemetry for Go applications:
- Creating a SigNoz cloud account
- Instrumenting a Go application with OpenTelemetry
- Generating telemetry data from your application
- Monitoring your Go application with SigNoz dashboards
- Adding custom attributes and custom events to spans
Creating a SigNoz cloud account
SigNoz cloud is the easiest way to run SigNoz. You can sign up here for a free account and get 30 days of unlimited access to all features.

After you sign up and verify your email, you will be provided with details of your SigNoz cloud instance. Once you set up your password and log in, you will be greeted with the following onboarding screen.
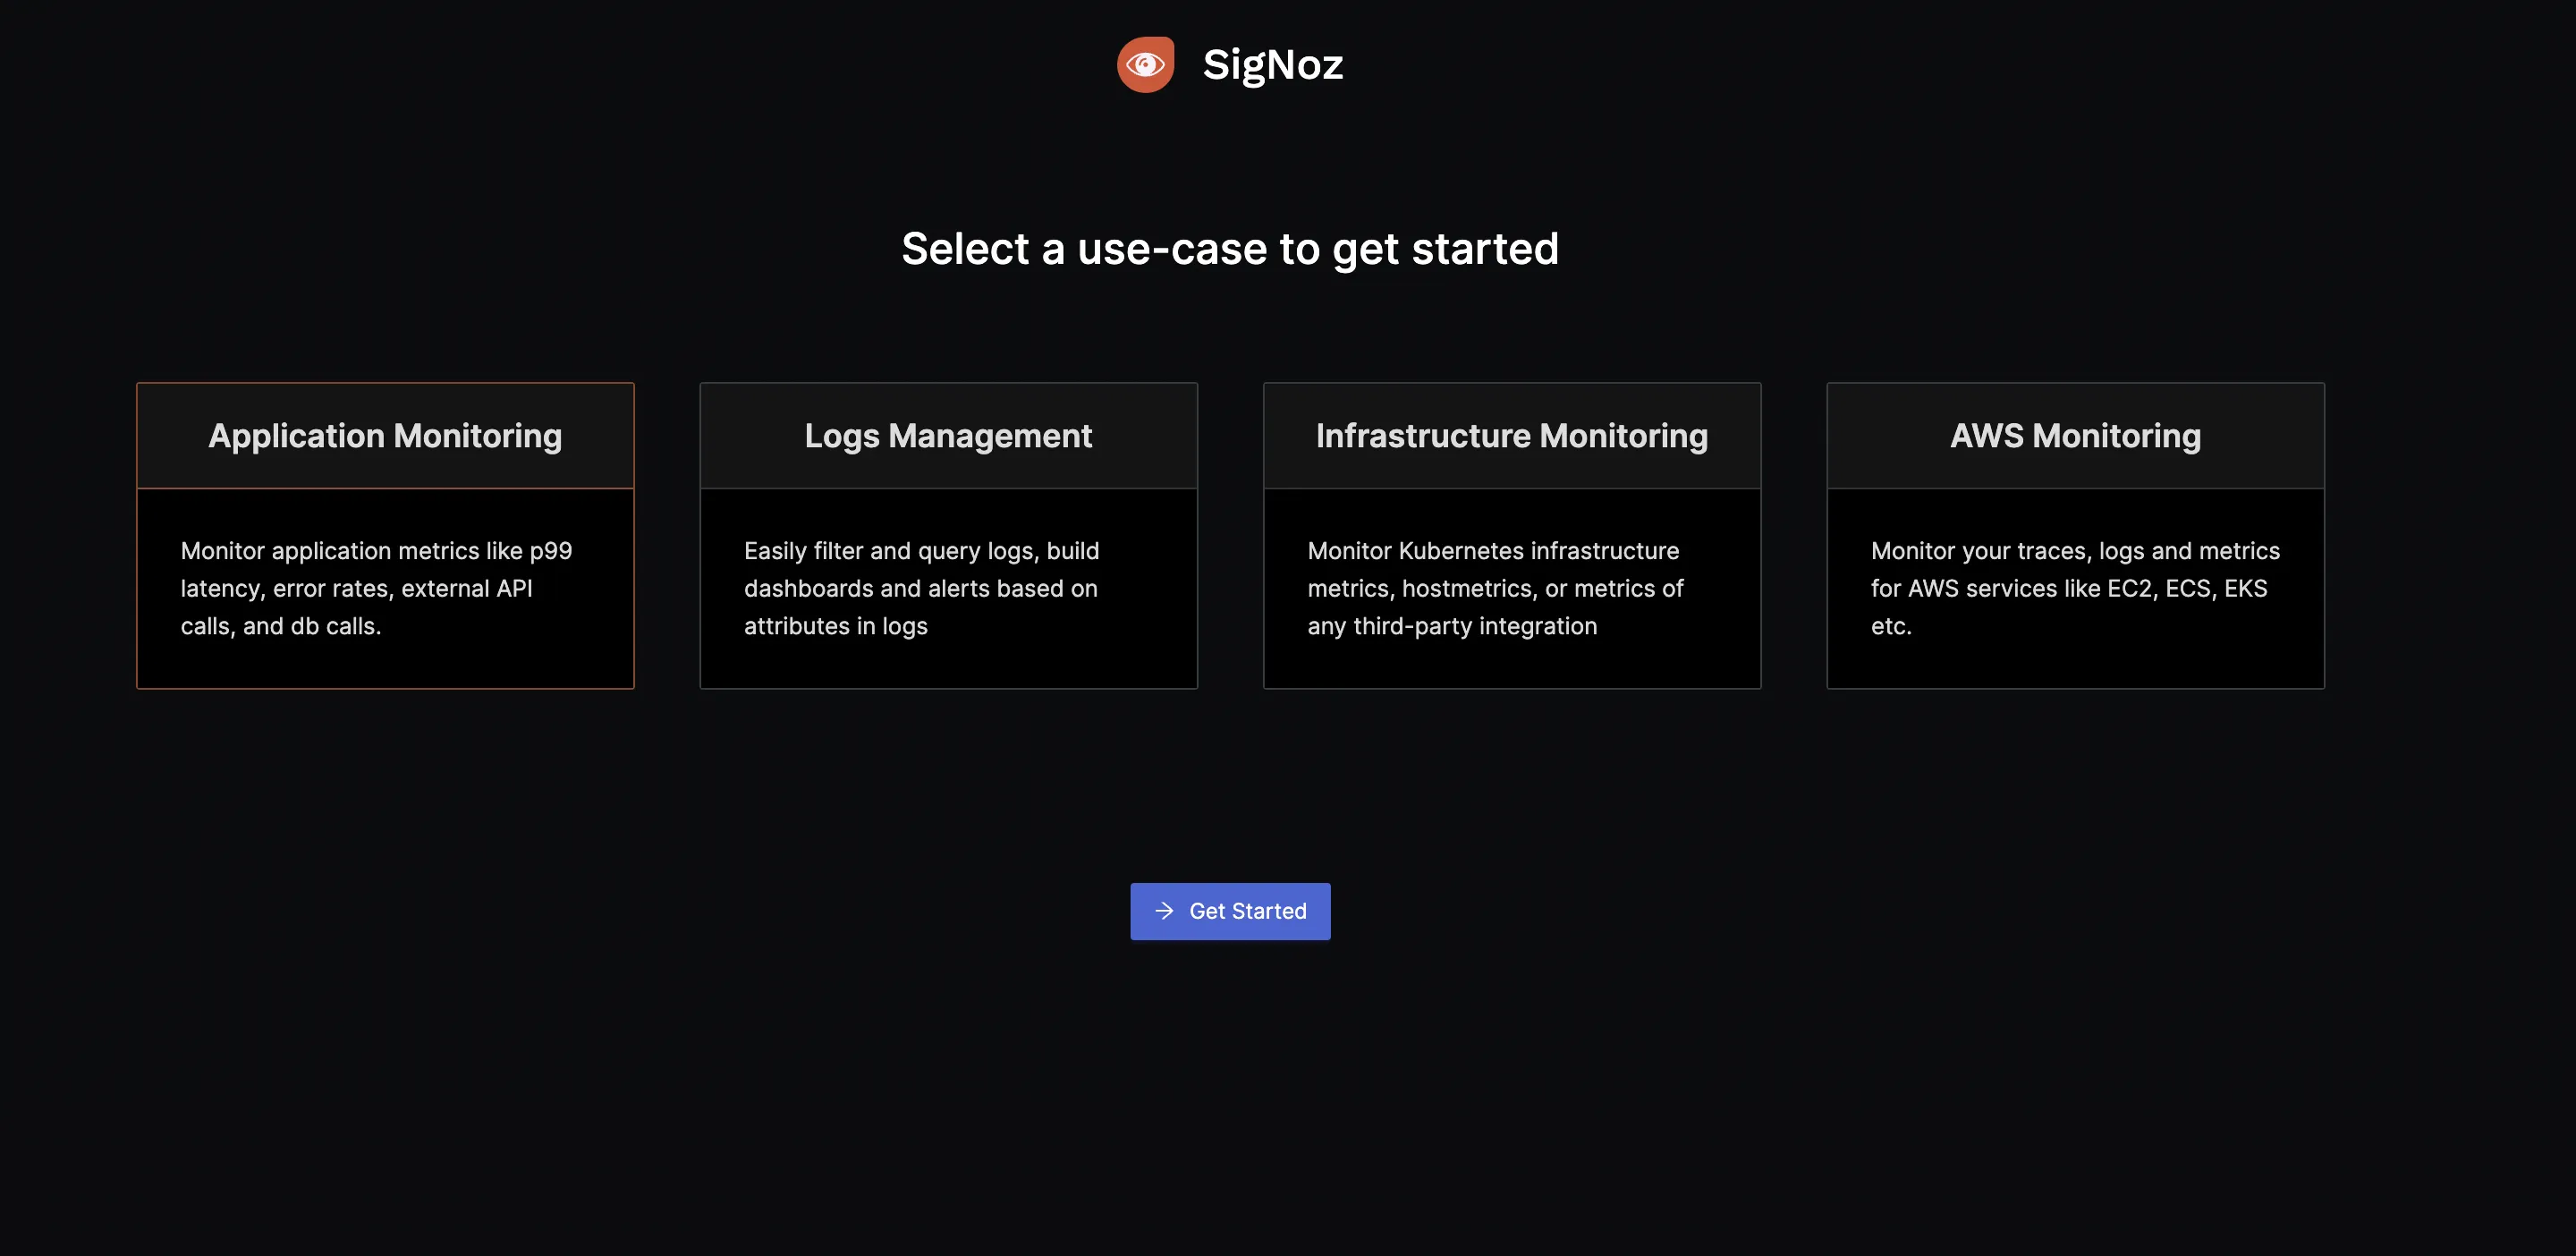
Since we will be following instructions from the tutorial, you can skip onboarding by clicking on the SigNoz logo.
You will see the below screen:
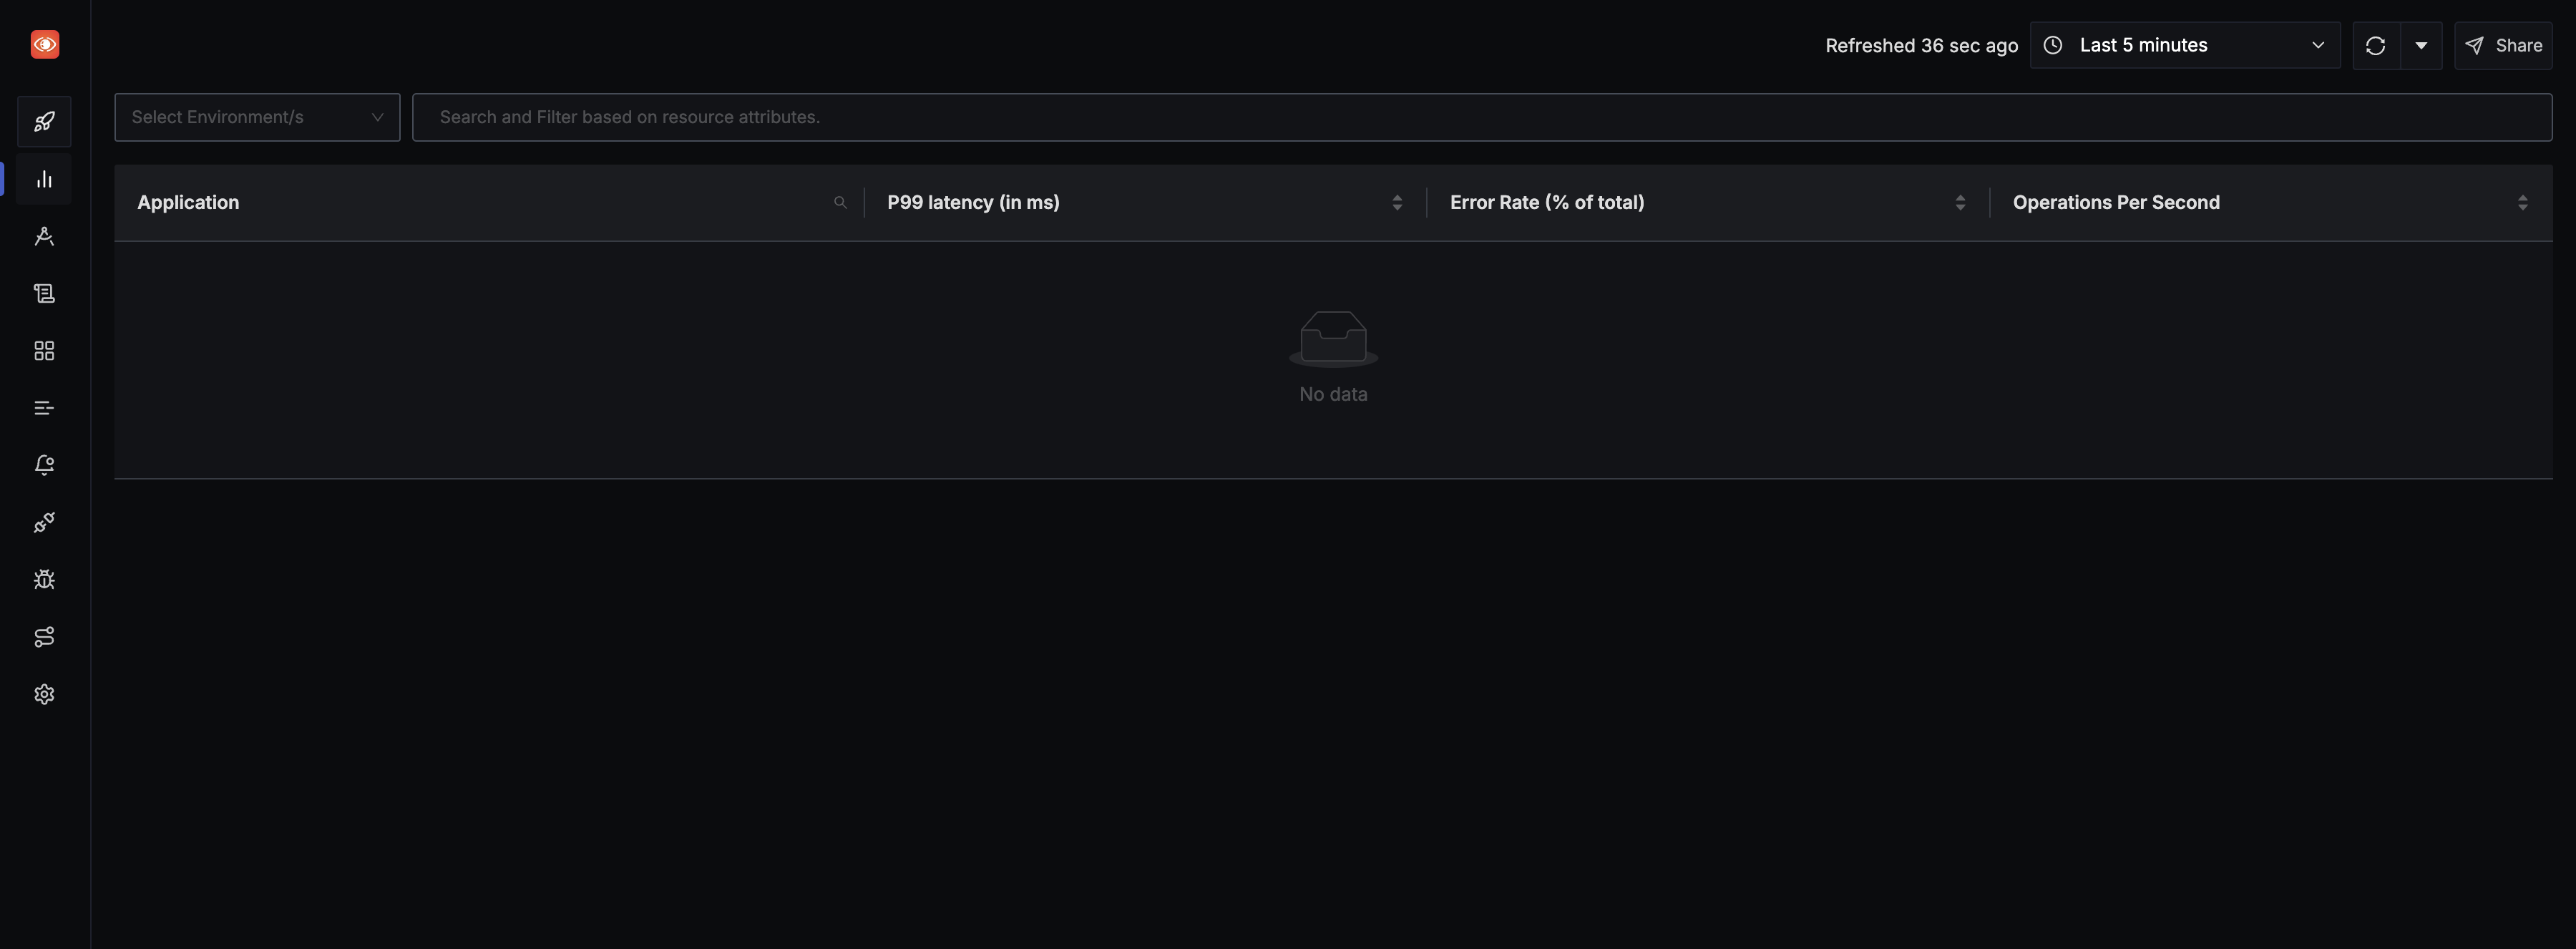
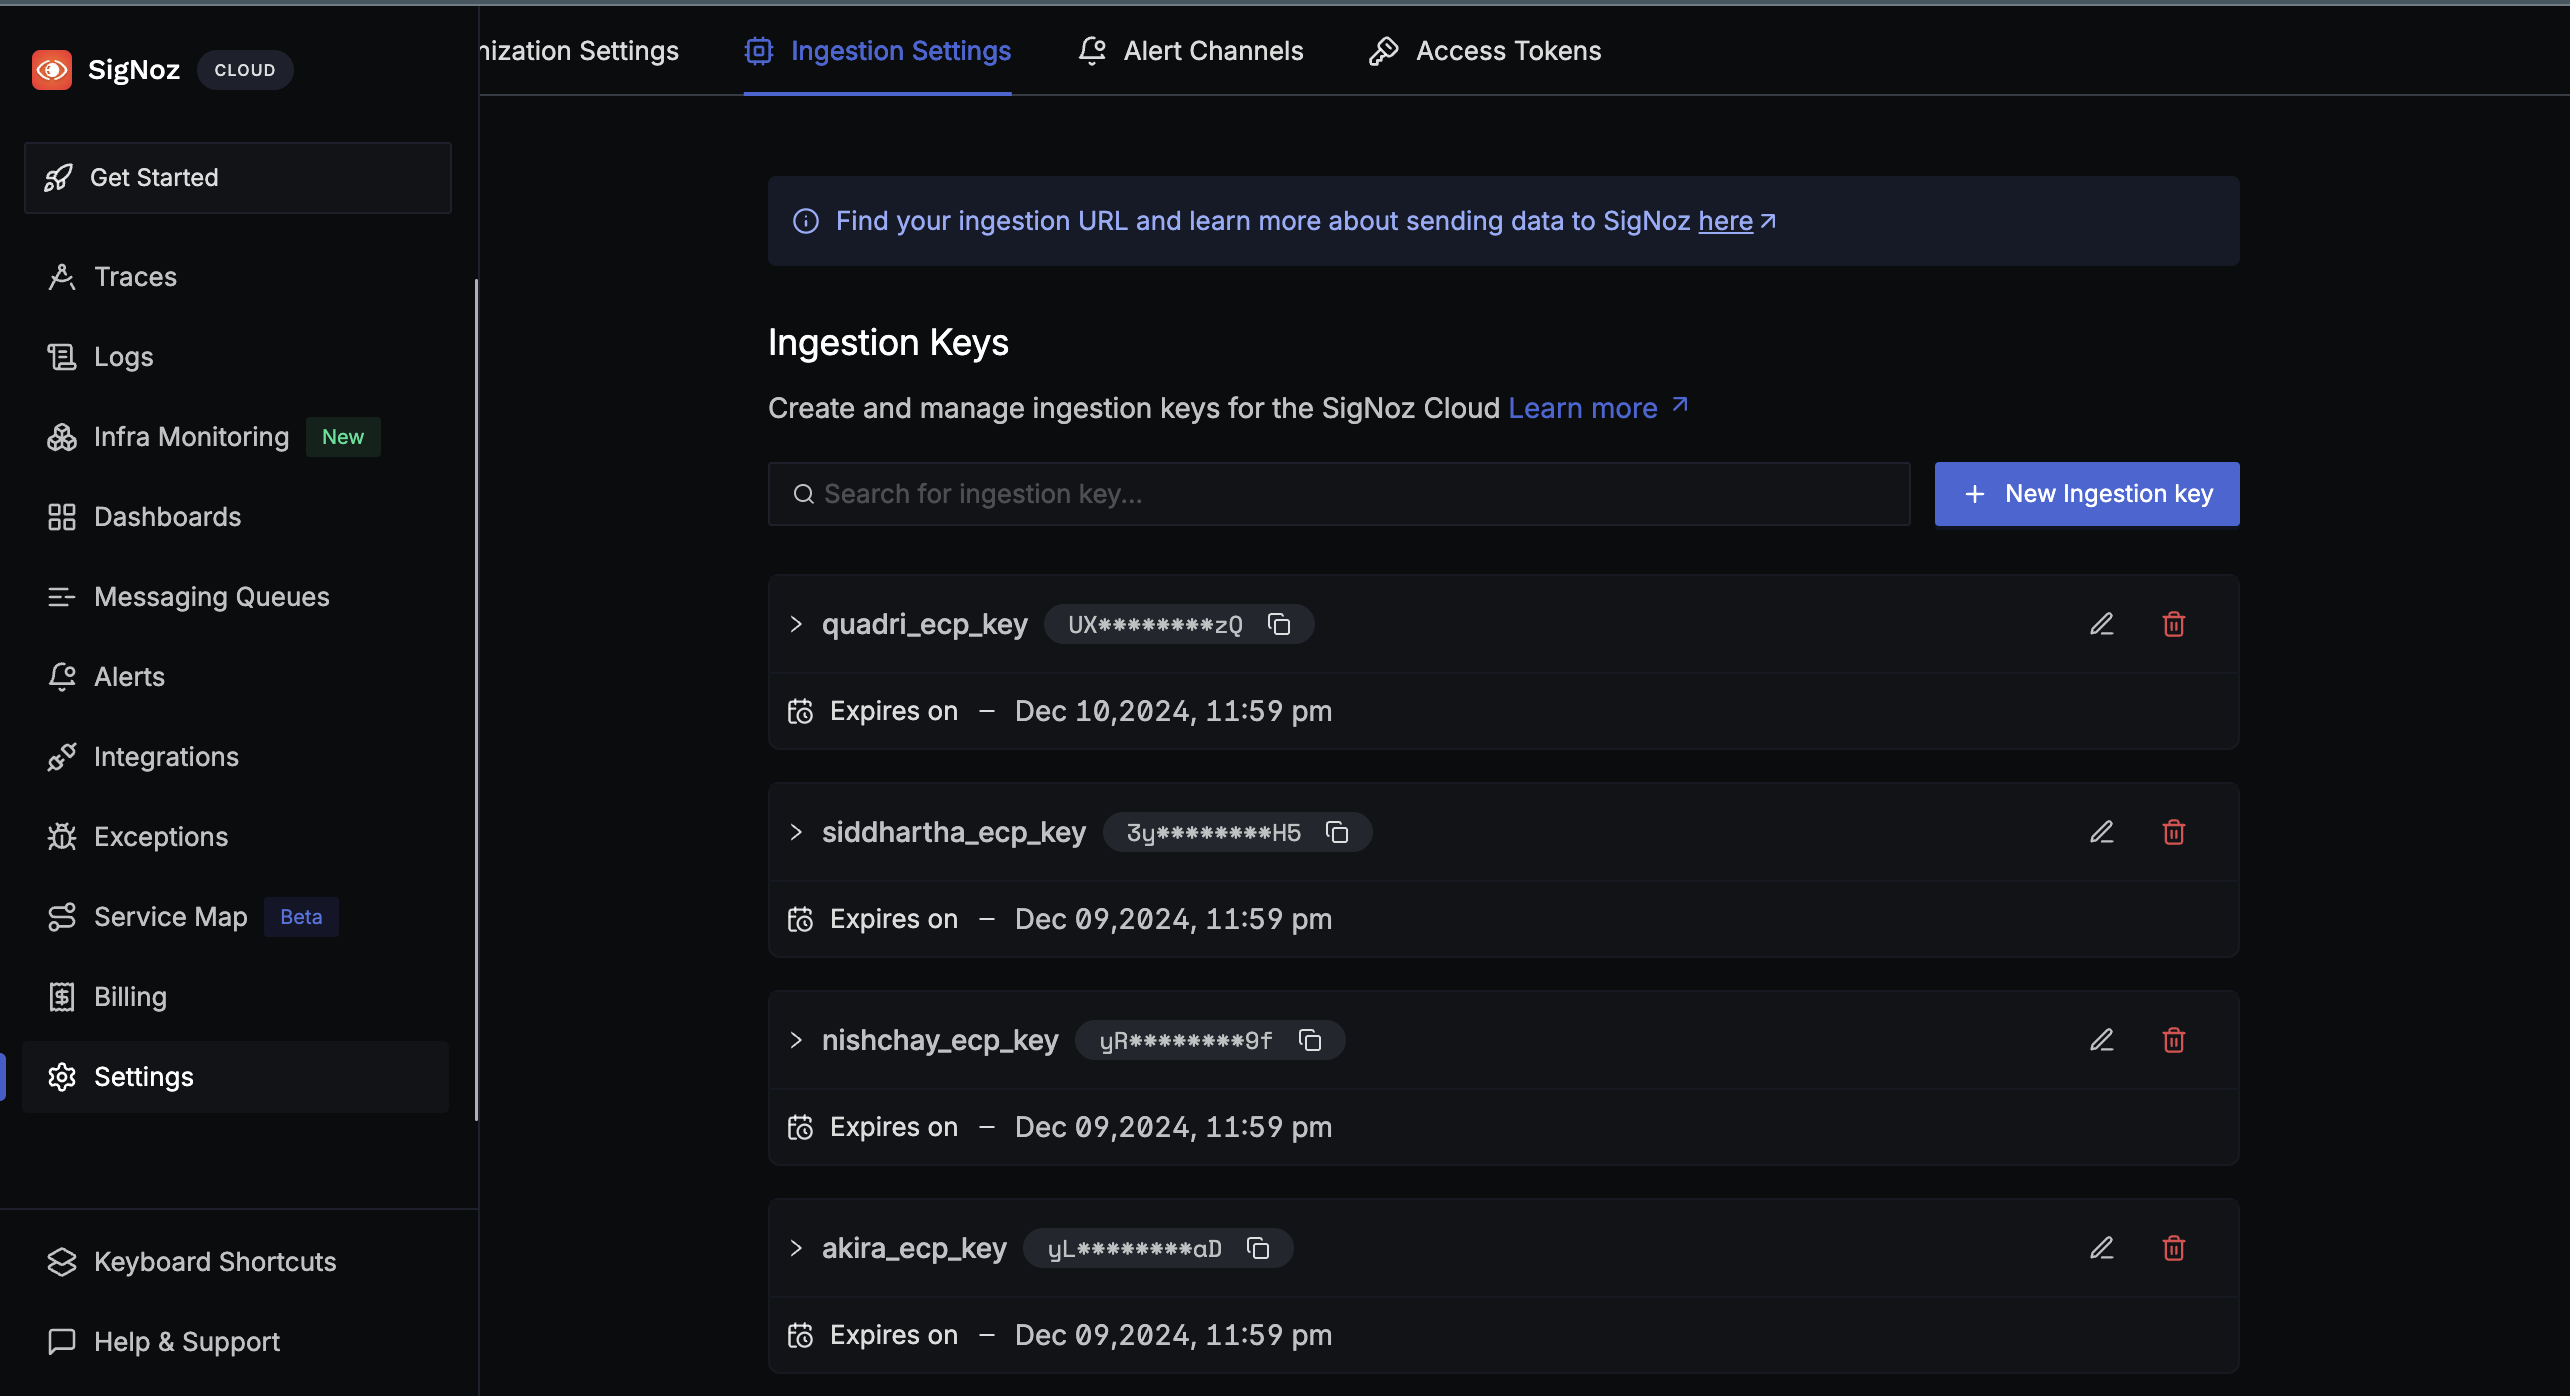
For sending data to SigNoz cloud, you will be needing details like ingestion key and region. You can find them under Ingestion Settings under Settings.
Instrumenting your Golang application with OpenTelemetry
Follow the below steps to instrument your Golang application with OpenTelemetry correctly:
Step 1: Get a sample Golang app from GitHub
Prerequisites: You will need SQLite to run the sample application.
The sample Golang app repo contains the boilerplate code that we will instrument.
If you want to follow along with the tutorial, clone the without-instrumentation branch:
git clone -b without-instrumentation https://github.com/SigNoz/sample-golang-app.git
Step 2: Install dependencies
Dependencies related to OpenTelemetry exporter and SDK have to be installed first. Note that we are assuming you are using gin request router. If you are using other request routers, check out the corresponding package.
Run the below commands after navigating to the application source folder:
go get go.opentelemetry.io/otel \
  go.opentelemetry.io/otel/trace \
  go.opentelemetry.io/otel/sdk \
  go.opentelemetry.io/contrib/instrumentation/github.com/gin-gonic/gin/otelgin \
  go.opentelemetry.io/otel/exporters/otlp/otlptrace \
  go.opentelemetry.io/otel/exporters/otlp/otlptrace/otlptracegrpc
Step 3: Declare environment variables for configuring OpenTelemetry
Declare the following global variables in the main.go file after the import block. This will be used to configure OpenTelemetry:
var (
	serviceName  = os.Getenv("SERVICE_NAME")
	collectorURL = os.Getenv("OTEL_EXPORTER_OTLP_ENDPOINT")
	insecure     = os.Getenv("INSECURE_MODE")
)
The environment variables used here are explained in detail below to help you configure them correctly.
Step 4: Instrument your Go application with OpenTelemetry
To configure your application to send data, we will need a function to initialize OpenTelemetry. Add the following snippet of code in your main.go file:
import (
	"context"
	"log"
	"os"
	"strings"

	.....

	"google.golang.org/grpc/credentials"
	"go.opentelemetry.io/otel"
	"go.opentelemetry.io/otel/attribute"
	"go.opentelemetry.io/otel/exporters/otlp/otlptrace"
	"go.opentelemetry.io/otel/exporters/otlp/otlptrace/otlptracegrpc"

	"go.opentelemetry.io/otel/sdk/resource"
	sdktrace "go.opentelemetry.io/otel/sdk/trace"
)
Add this after the variable declaration (var) block:
func initTracer() func(context.Context) error {

     var secureOption otlptracegrpc.Option

     if strings.ToLower(insecure) == "false" || insecure == "0" || strings.ToLower(insecure) == "f" {
         secureOption = otlptracegrpc.WithTLSCredentials(credentials.NewClientTLSFromCert(nil, ""))
     } else {
         secureOption = otlptracegrpc.WithInsecure()
     }

     exporter, err := otlptrace.New(
         context.Background(),
         otlptracegrpc.NewClient(
             secureOption,
             otlptracegrpc.WithEndpoint(collectorURL),
         ),
     )

     if err != nil {
         log.Fatalf("Failed to create exporter: %v", err)
     }
     resources, err := resource.New(
         context.Background(),
         resource.WithAttributes(
             attribute.String("service.name", serviceName),
             attribute.String("library.language", "go"),
         ),
     )
     if err != nil {
         log.Fatalf("Could not set resources: %v", err)
     }

     otel.SetTracerProvider(
         sdktrace.NewTracerProvider(
             sdktrace.WithSampler(sdktrace.AlwaysSample()),
             sdktrace.WithBatcher(exporter),
             sdktrace.WithResource(resources),
         ),
     )
     return exporter.Shutdown
 }
Step 5: Initialize the tracer in main.go
Modify the main function to initialise the tracer in main.go. Initiate the tracer at the very beginning of our main function.
func main() {
	cleanup := initTracer()
	defer cleanup(context.Background())

	......
}
Step 6: Add the OpenTelemetry Gin middleware
Configure Gin to use the middleware by adding the following lines in main.go.
import (
	....
  "go.opentelemetry.io/contrib/instrumentation/github.com/gin-gonic/gin/otelgin"
)

func main() {
	......
	r.Use(otelgin.Middleware(serviceName))
	......
}
This is what your main.go file should look like after instrumentation:
package main

import (
	"context"
	"log"
	"os"
	"strings"

	"github.com/SigNoz/sample-golang-app/controllers"
	"github.com/SigNoz/sample-golang-app/models"

	"github.com/gin-gonic/gin"

	"google.golang.org/grpc/credentials"
	"go.opentelemetry.io/otel"
	"go.opentelemetry.io/otel/attribute"
	"go.opentelemetry.io/otel/exporters/otlp/otlptrace"
	"go.opentelemetry.io/otel/exporters/otlp/otlptrace/otlptracegrpc"

	"go.opentelemetry.io/otel/sdk/resource"
	sdktrace "go.opentelemetry.io/otel/sdk/trace"
	"go.opentelemetry.io/contrib/instrumentation/github.com/gin-gonic/gin/otelgin"
)

var (
	serviceName  = os.Getenv("SERVICE_NAME")
	collectorURL = os.Getenv("OTEL_EXPORTER_OTLP_ENDPOINT")
	insecure     = os.Getenv("INSECURE_MODE")
)

func initTracer() func(context.Context) error {

	var secureOption otlptracegrpc.Option

	if strings.ToLower(insecure) == "false" || insecure == "0" || strings.ToLower(insecure) == "f" {
		secureOption = otlptracegrpc.WithTLSCredentials(credentials.NewClientTLSFromCert(nil, ""))
	} else {
		secureOption = otlptracegrpc.WithInsecure()
	}

	exporter, err := otlptrace.New(
		context.Background(),
		otlptracegrpc.NewClient(
			secureOption,
			otlptracegrpc.WithEndpoint(collectorURL),
		),
	)

	if err != nil {
		log.Fatalf("Failed to create exporter: %v", err)
	}
	resources, err := resource.New(
		context.Background(),
		resource.WithAttributes(
			attribute.String("service.name", serviceName),
			attribute.String("library.language", "go"),
		),
	)
	if err != nil {
		log.Fatalf("Could not set resources: %v", err)
	}

	otel.SetTracerProvider(
		sdktrace.NewTracerProvider(
			sdktrace.WithSampler(sdktrace.AlwaysSample()),
			sdktrace.WithBatcher(exporter),
			sdktrace.WithResource(resources),
		),
	)
	return exporter.Shutdown
}

func main() {
	cleanup := initTracer()
	defer cleanup(context.Background())

	r := gin.Default()
	r.Use(otelgin.Middleware(serviceName))
	models.ConnectDatabase()

	// Routes
	r.GET("/books", controllers.FindBooks)
	r.GET("/books/:id", controllers.FindBook)
	r.POST("/books", controllers.CreateBook)
	r.PATCH("/books/:id", controllers.UpdateBook)
	r.DELETE("/books/:id", controllers.DeleteBook)

	// Run the server
	r.Run(":8090")
}
Step 7: Set environment variables and run your Go Gin application
Now that you have instrumented your Go Gin application with OpenTelemetry, you need to set some environment variables to send data to SigNoz backend and run your application.
Run the following command to set the environment variables and start the application:
SERVICE_NAME=goApp INSECURE_MODE=false OTEL_EXPORTER_OTLP_HEADERS=signoz-access-token=<SIGNOZ-INGESTION-TOKEN> OTEL_EXPORTER_OTLP_ENDPOINT=ingest.{region}.signoz.cloud:443 go run main.go
Where:
SERVICE_NAME:goAppThis variable defines the name of your application service, which will appear in SigNoz to help identify telemetry data from this specific service. You can name it anything you prefer.
INSECURE_MODE:falseWhen set to
false, this ensures that the connection between your application and SigNoz backend is secure (using TLS). It's recommended to keep it asfalsefor production environments.OTEL_EXPORTER_OTLP_HEADERS:This header contains the SigNoz access token for authentication. Replace
<SIGNOZ-INGESTION-TOKEN>with your actual ingestion token.OTEL_EXPORTER_OTLP_ENDPOINT:This defines the endpoint where your application will send telemetry data,
ingest.{region}.signoz.cloud:443. Depending on the choice of your region for SigNoz cloud, the ingest endpoint will vary according to this table.Region Endpoint US ingest.us.signoz.cloud:443 IN ingest.in.signoz.cloud:443 EU ingest.eu.signoz.cloud:443
And congratulations! You have successfully instrumented and started your sample Golang application.

Generating telemetry data from your application
To ensure that telemetry data is generated and sent to SigNoz, interact with your application by hitting the /books endpoint of the bookstore app. You can do this by navigating to http://localhost:8090/books in your browser or using a tool like curl or Postman.
Refresh the endpoint multiple times to simulate load. Wait for 1–2 minutes, and the telemetry data will appear on your SigNoz dashboard, providing insights into your application’s performance.
Alternatively, you can explore the application's functionality by performing CRUD operations. Below are examples to interact with the bookstore app:
- Retrieve All Books
Send a GET request to fetch the list of books:
curl http://localhost:8090/books
Output:
{"data":[]}%
Since there are no books yet, the response will be empty.
- Create a New Book
Send a POST request to add a new book:
curl -X POST http://localhost:8090/books \
     -H "Content-Type: application/json" \
     -d '{"title":"Go Programming", "author":"John Doe"}'
Output:
{"data":[{"id":1,"title":"Go Programming","author":"John Doe"}]}%

- Retrieve a Specific Book
Send a GET request to fetch the details of a specific book by its ID:
curl http://localhost:8090/books/1
Output:
{"data":{"id":1,"title":"Go Programming","author":"John Doe"}}
- Update a Book
Send a PATCH request to update the title of the book:
curl -X PATCH http://localhost:8090/books/1 \
     -H "Content-Type: application/json" \
     -d '{"title":"Updated Title"}'
Output:
{"data":{"id":1,"title":"Updated Title","author":"John Doe"}}%

- Delete a Book
Send a DELETE request to remove the book by its ID:
curl -X DELETE http://localhost:8090/books/1
Output:
{"data":true}%

By performing these interactions, your application will generate telemetry data, which OpenTelemetry will process and forward to SigNoz for visualization and analysis. Refresh your SigNoz dashboard to observe the metrics, traces, and logs created during these operations!
Monitor your Go application with SigNoz dashboards
With the above steps, you have instrumented your Go application with OpenTelemetry. OpenTelemetry sends the collected data to SigNoz which can be used to store it and visualize it. Let’s see how SigNoz can help you monitor your Go application.
Navigate to our SigNoz cloud account. On the service page, you should see your goGinApp service.
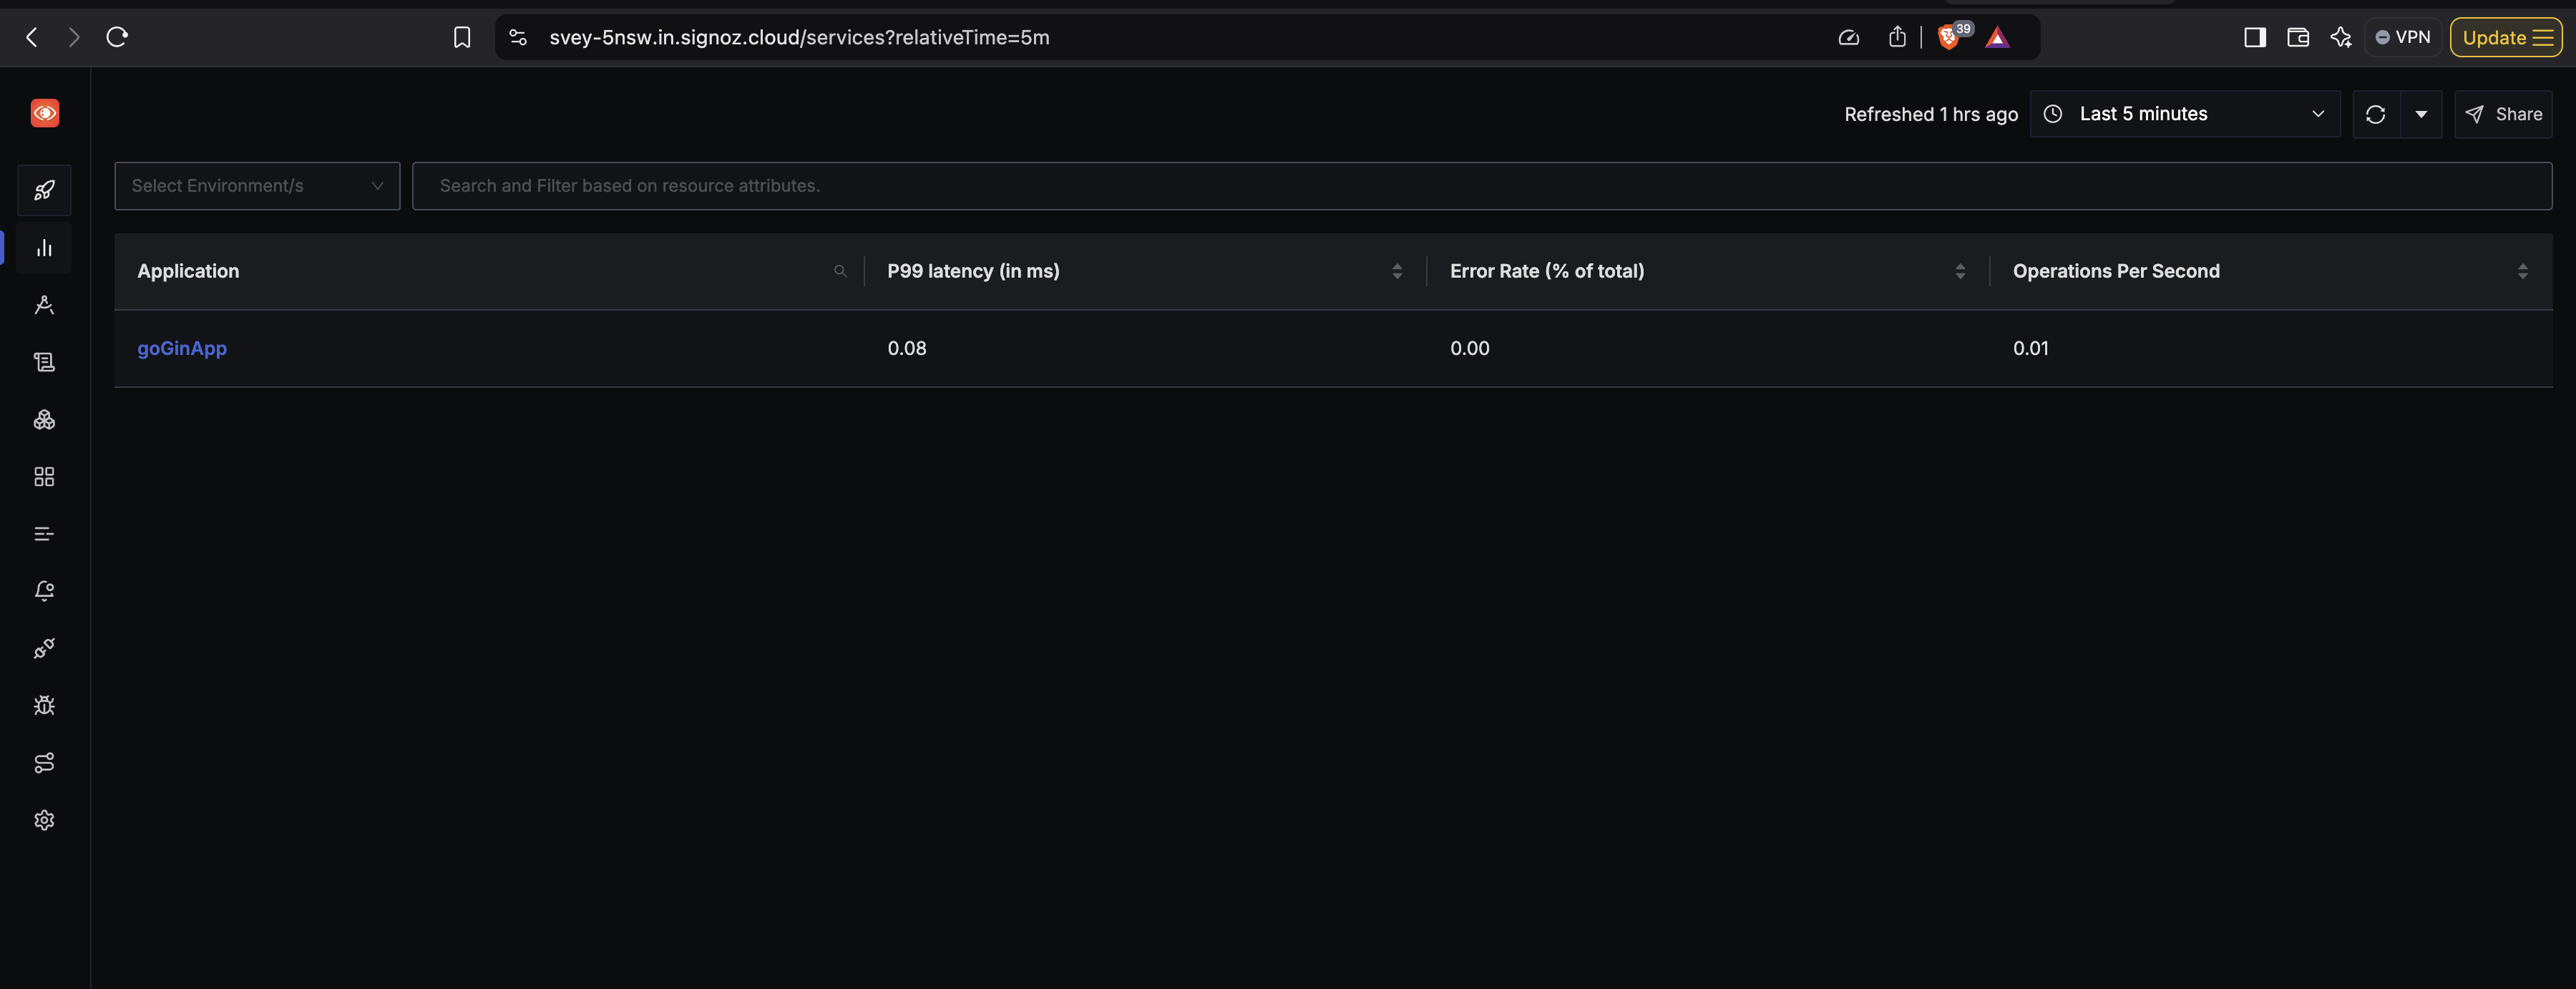
You can monitor application metrics like application latency, requests per second, error percentage, etc. with the Metrics tab of SigNoz.
Click on the goGinApp service and you should be redirected to the metrics page.
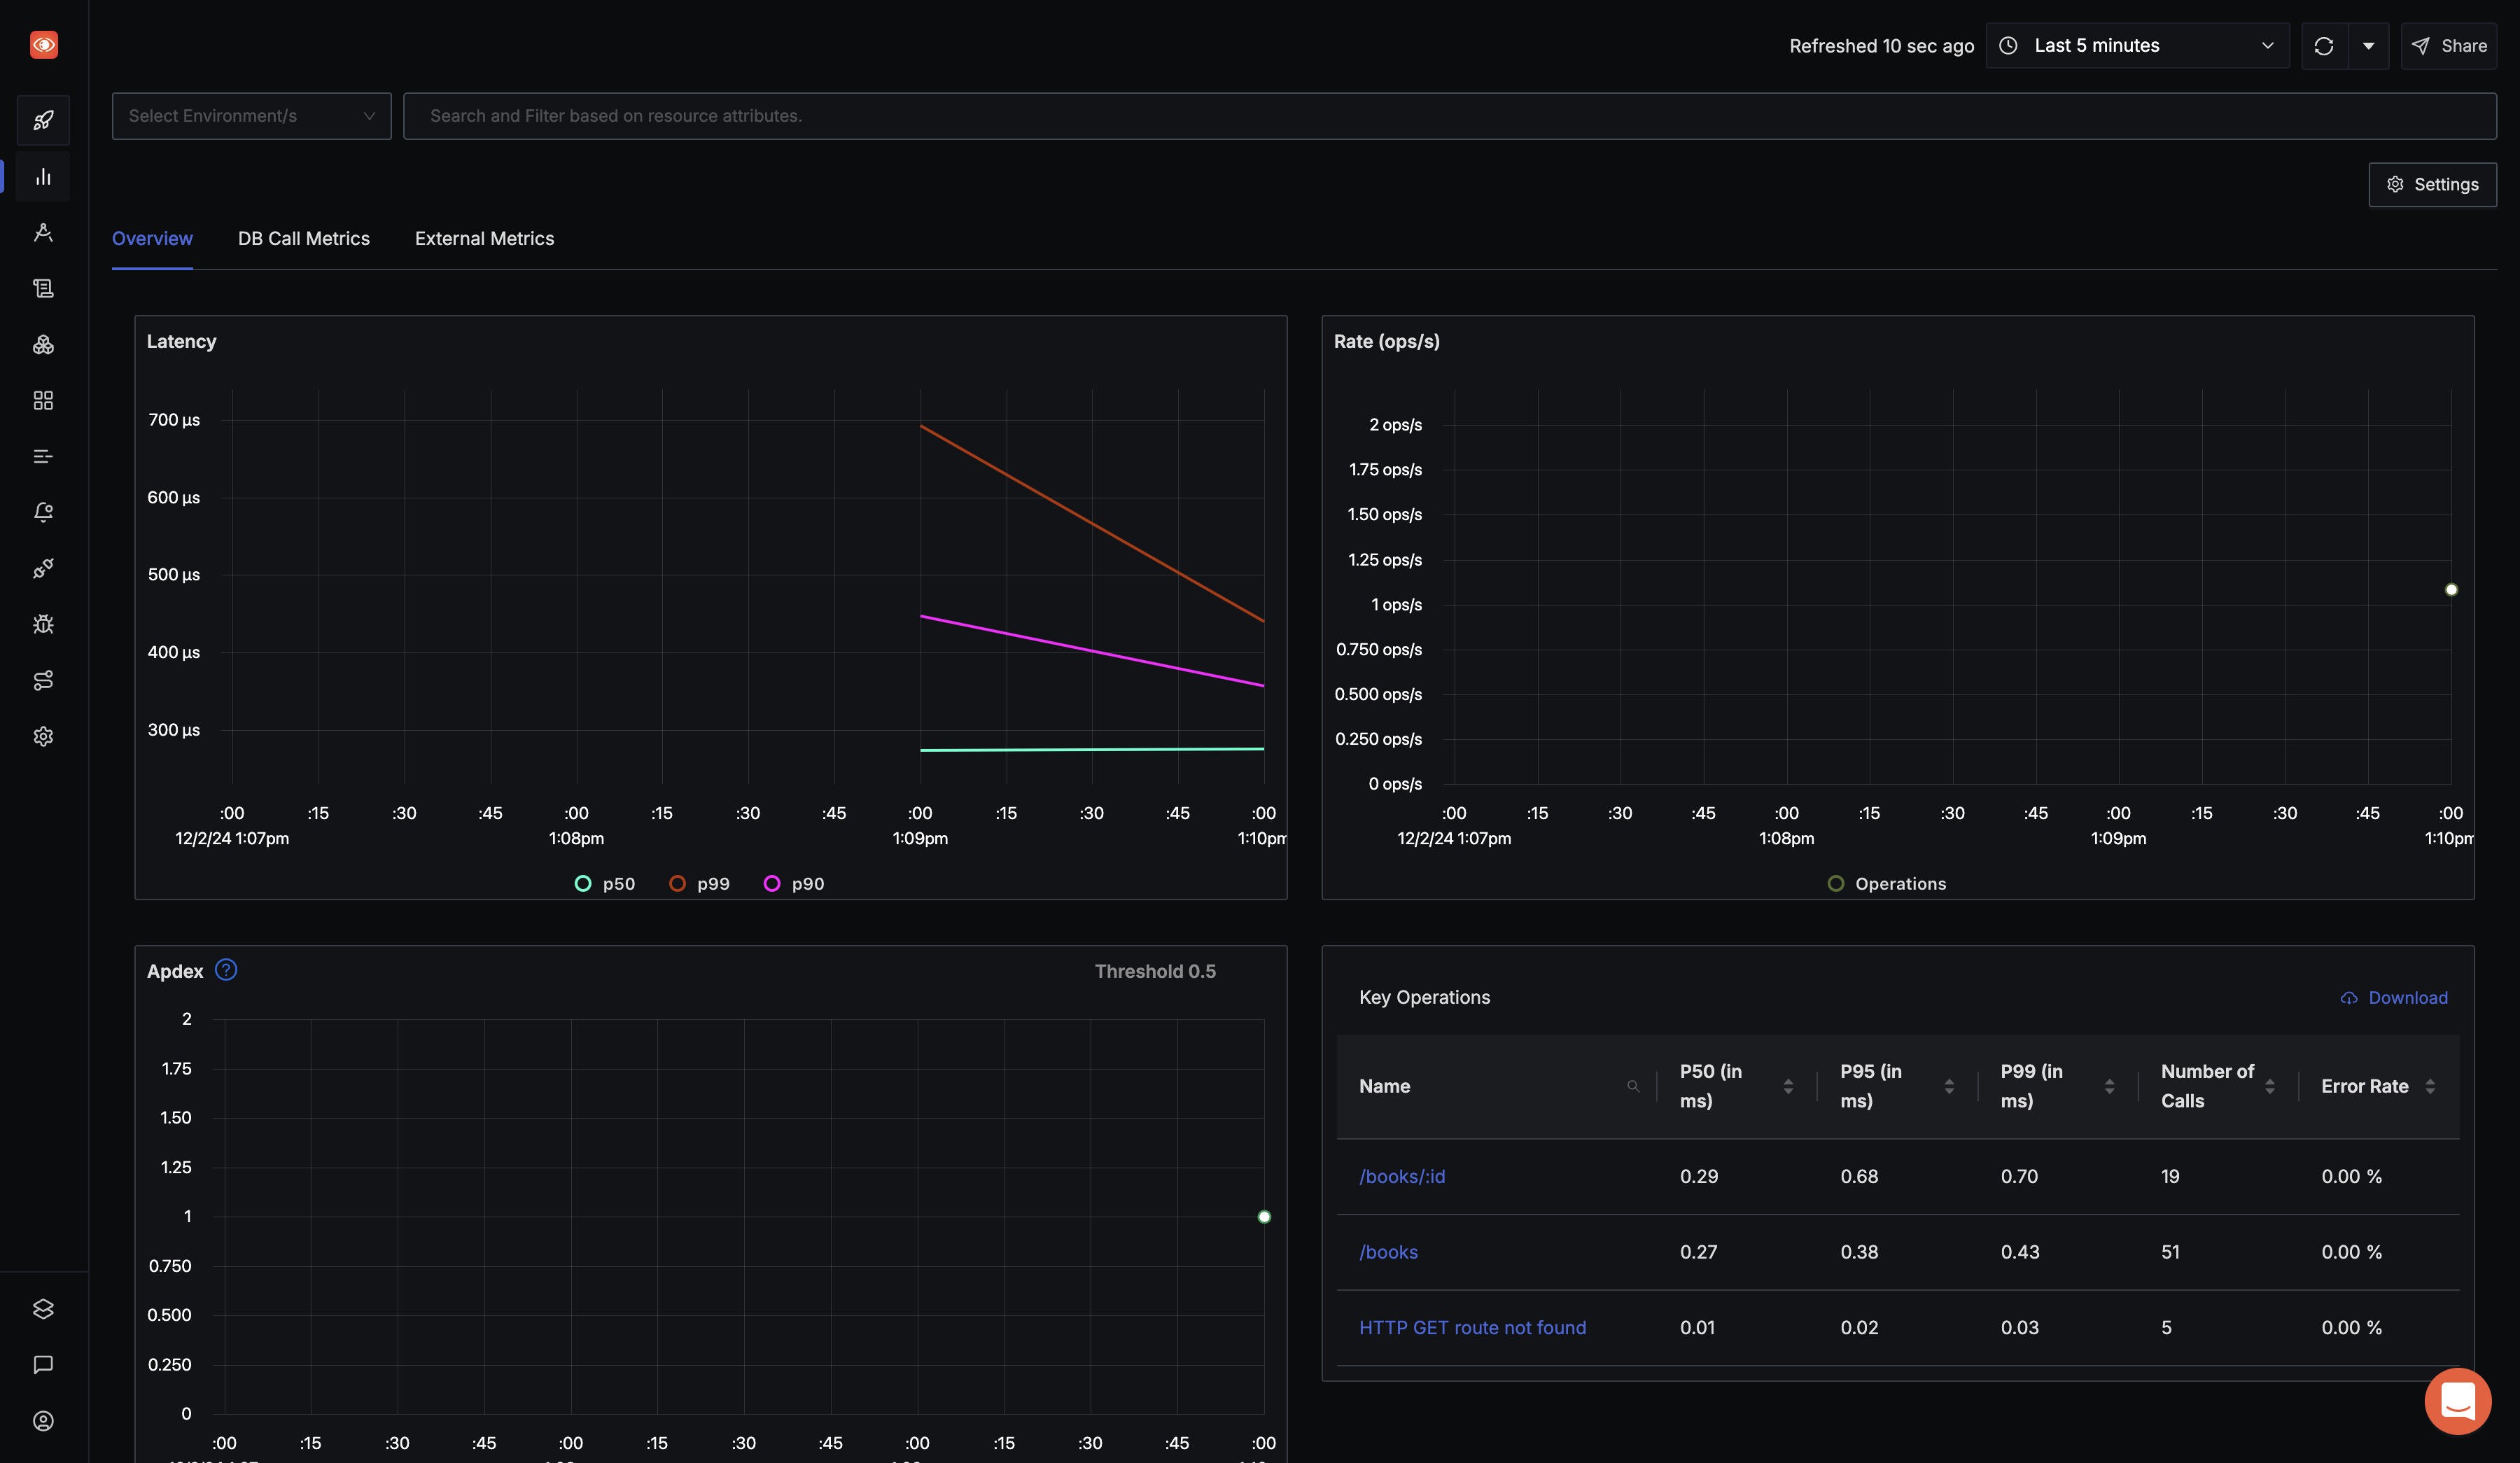
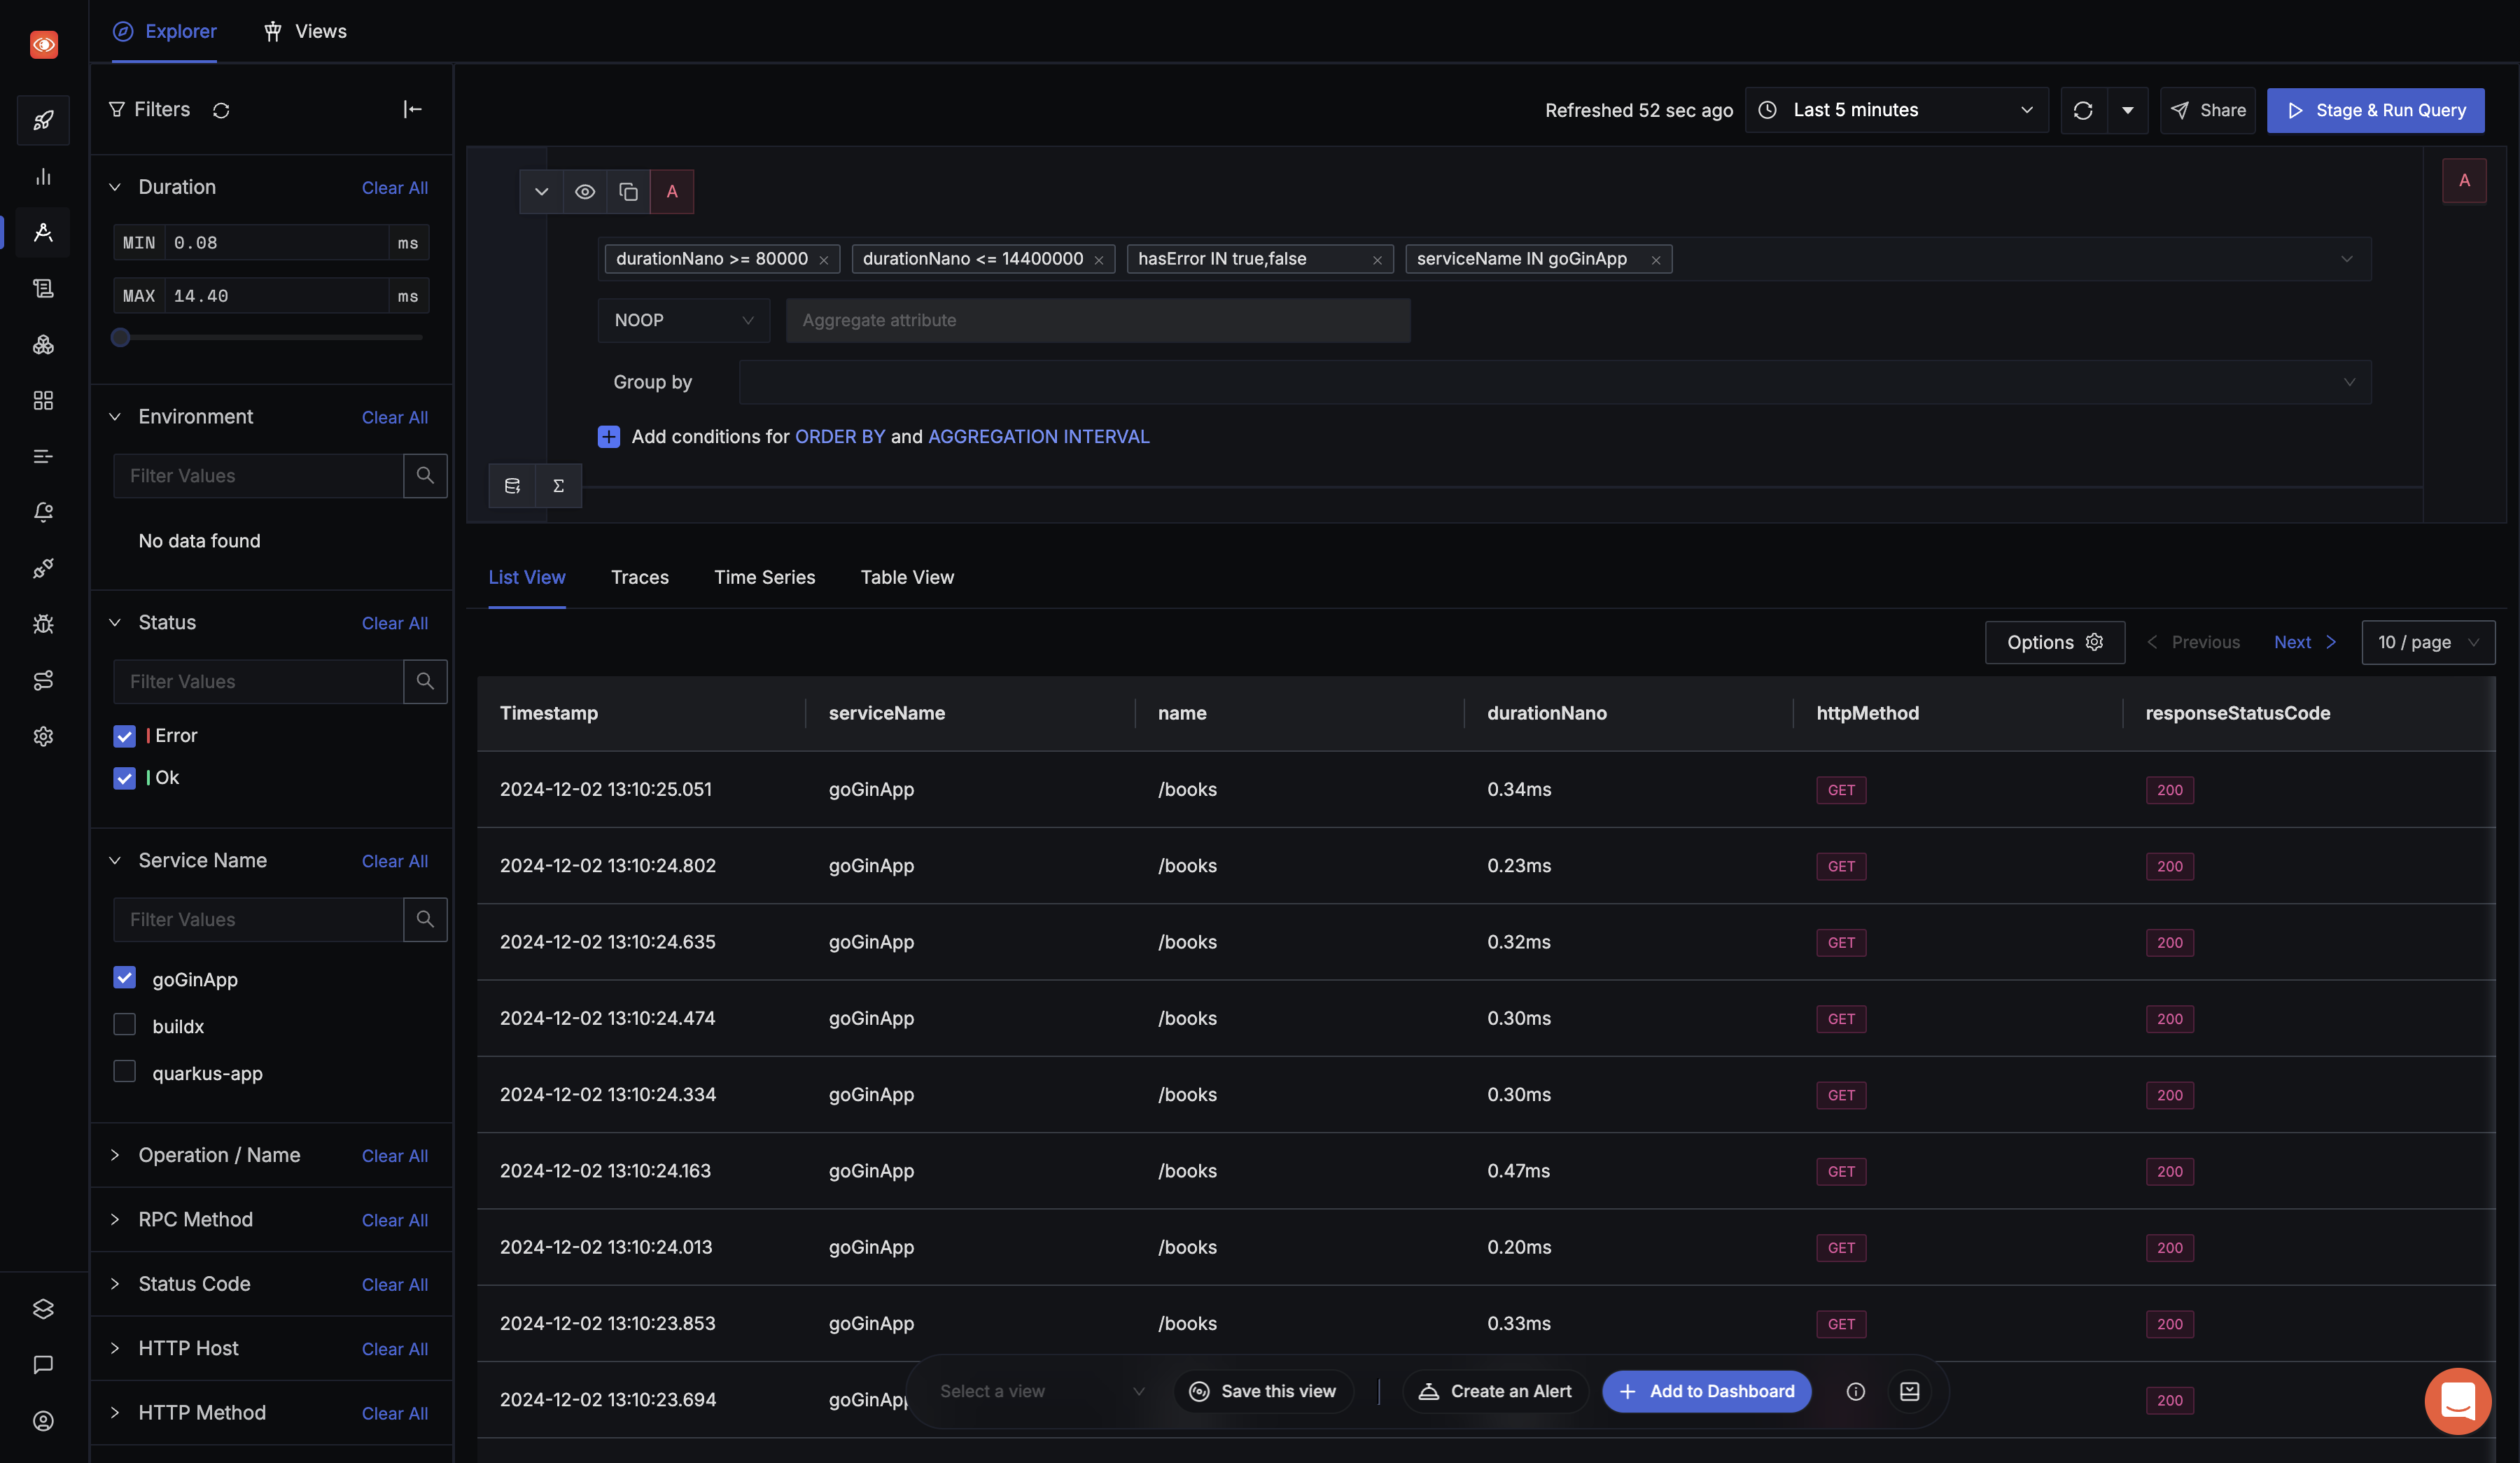
OpenTelemetry captures tracing data from your Gin application as well. Tracing data can help you visualize how user requests perform across services in a multi-service application.
In the Traces tab of SigNoz, you can analyze the tracing data using filters based on tags, status codes, service names, operations, etc.
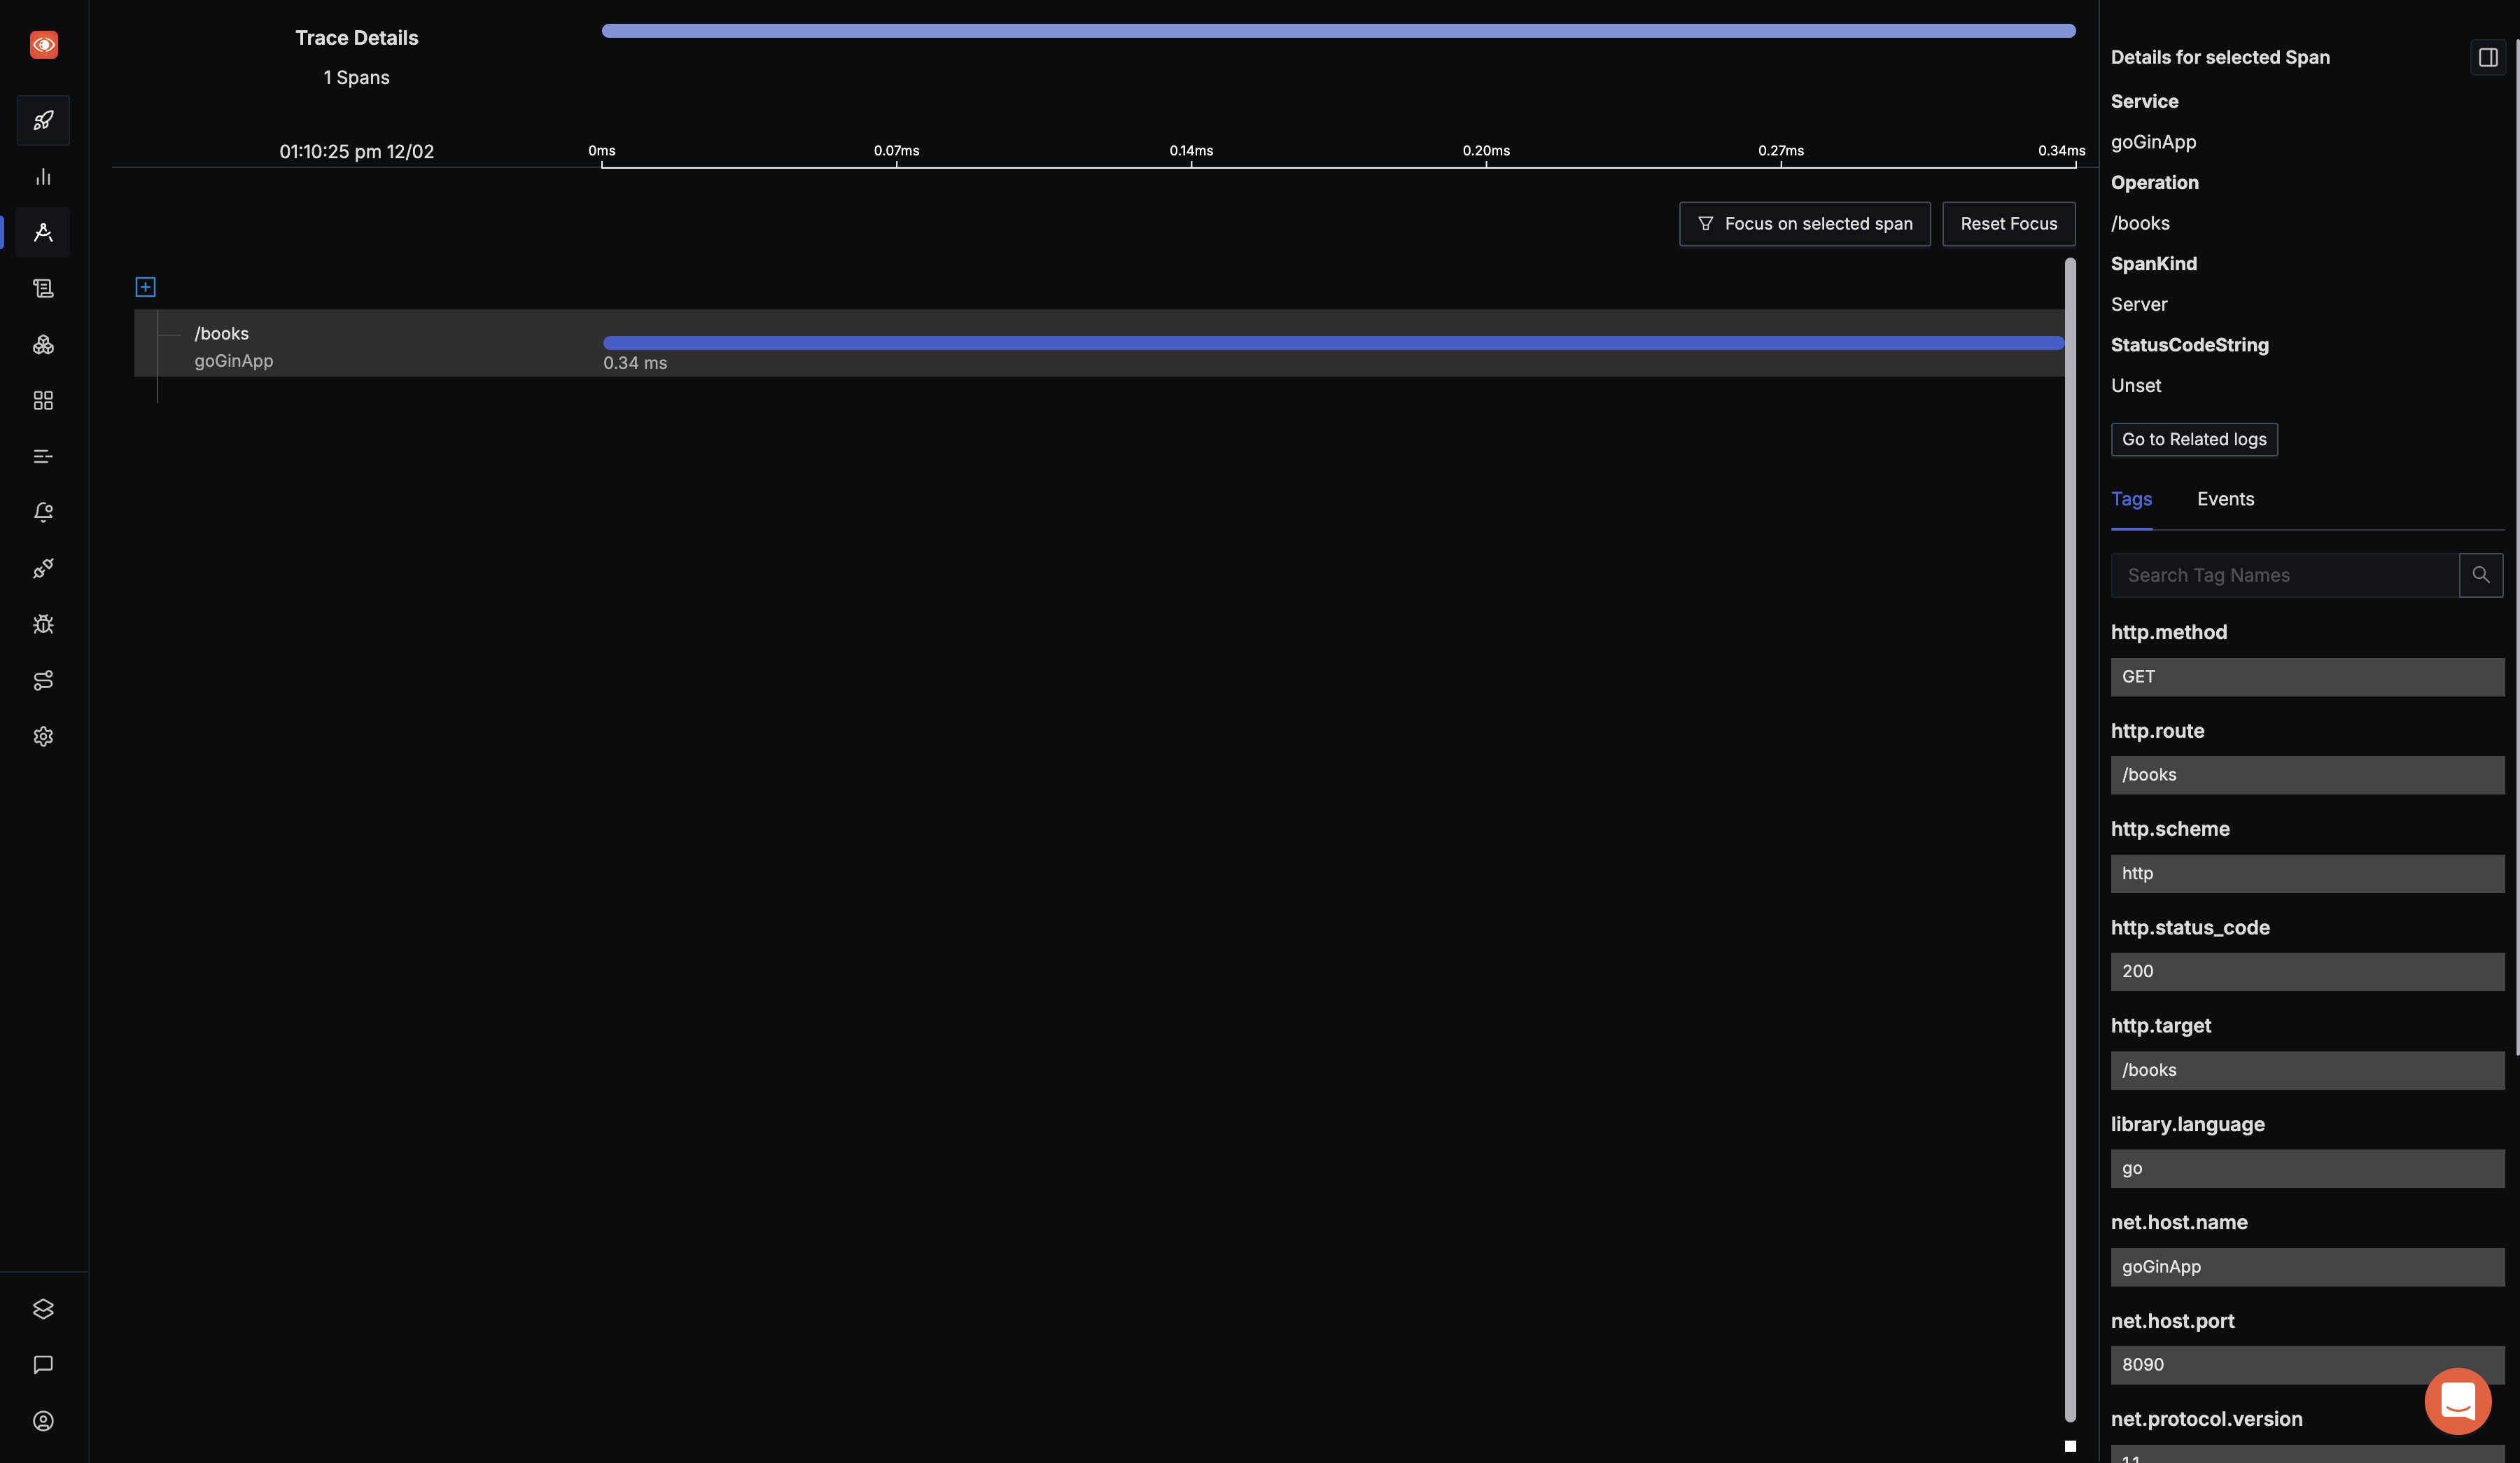
You can also visualize your tracing data with the help of flamegraphs and Gantt charts.
Adding custom attributes and custom events to spans
In OpenTelemetry, spans represent a single unit of work in a distributed trace. You can enrich these spans with custom attributes and custom events to capture additional context and insights about the operations your application is performing. This is useful for observability and debugging, as it allows you to track specific details in the trace, providing more valuable insights into your system's behavior.
Here’s how you can add custom attributes and custom events to spans in your Go application:
Step 1: Import trace and attribute libraries
To add attributes and events to spans, you’ll need to import the necessary OpenTelemetry libraries. In your controllers/books.go file, include the following imports:
import (
	...
	"go.opentelemetry.io/otel/attribute"
	"go.opentelemetry.io/otel/trace"
)
Where:
go.opentelemetry.io/otel/attribute: This package is used to define attributes for spans.go.opentelemetry.io/otel/trace: This package provides the functionality for managing spans, including adding events and attributes.
Step 2: Fetch current span from context
In OpenTelemetry, each span is associated with a request context. To add attributes and events to a span, you first need to fetch the span from the context associated with the incoming request. You can do this by using:
span := trace.SpanFromContext(c.Request.Context())
Here, c.Request.Context() gets the context of the HTTP request, which carries the current span.
Step 3: Set custom attributes on the Span
Attributes are key-value pairs that provide additional metadata to a span. You can add custom attributes to the current span using span.SetAttributes():
span.SetAttributes(attribute.String("controller", "books"))
This adds an attribute "controller" = "books" to the span, helping you identify which part of the application (in this case, the "books" controller) is responsible for the span.
Step 4: Add custom events to the span
Events provide a way to track specific actions or errors within the span’s context. You can add events to a span using span.AddEvent():
span.AddEvent("This is a sample event", trace.WithAttributes(attribute.Int("pid", 4328), attribute.String("sampleAttribute", "Test")))
In this example, an event named "This is a sample event" is added to the span, with custom attributes "pid" = 4328 and "sampleAttribute" = "Test". These events can help you track specific actions or errors within the span's context.
Implementation in your goGin Application
In your project folder directory, open the controllers/books.go file and update it with the following configuration:
package controllers

import (
	"net/http"

	"github.com/SigNoz/sample-golang-app/models"
	"github.com/gin-gonic/gin"
	"go.opentelemetry.io/otel/attribute"
	"go.opentelemetry.io/otel/trace"
)

type CreateBookInput struct {
	Title  string `json:"title" binding:"required"`
	Author string `json:"author" binding:"required"`
}

type UpdateBookInput struct {
	Title  string `json:"title"`
	Author string `json:"author"`
}

// GET /books
// Find all books
func FindBooks(c *gin.Context) {
	span := trace.SpanFromContext(c.Request.Context())
	span.SetAttributes(attribute.String("controller", "books"))
	span.AddEvent("Fetching books")

	var books []models.Book
	models.DB.Find(&books)

	c.JSON(http.StatusOK, gin.H{"data": books})
}

// GET /books/:id
// Find a book
func FindBook(c *gin.Context) {
	span := trace.SpanFromContext(c.Request.Context())
	span.SetAttributes(attribute.String("controller", "books"))
	span.AddEvent("Fetching single book")

	// Get model if exist
	var book models.Book
	if err := models.DB.Where("id = ?", c.Param("id")).First(&book).Error; err != nil {
		span.AddEvent("Book not found", trace.WithAttributes(
			attribute.String("book_id", c.Param("id")),
		))
		c.JSON(http.StatusBadRequest, gin.H{"error": "Record not found!"})
		return
	}

	c.JSON(http.StatusOK, gin.H{"data": book})
}

// POST /books
// Create new book
func CreateBook(c *gin.Context) {
	span := trace.SpanFromContext(c.Request.Context())
	span.SetAttributes(attribute.String("controller", "books"))
	span.AddEvent("Creating book")

	// Validate input
	var input CreateBookInput
	if err := c.ShouldBindJSON(&input); err != nil {
		span.AddEvent("Book creation failed", trace.WithAttributes(
			attribute.String("error", err.Error()),
		))
		c.JSON(http.StatusBadRequest, gin.H{"error": err.Error()})
		return
	}

	// Create book
	book := models.Book{Title: input.Title, Author: input.Author}
	models.DB.Create(&book)

	span.AddEvent("Book created", trace.WithAttributes(
		attribute.Int("book_id", int(book.ID)),
	))

	c.JSON(http.StatusOK, gin.H{"data": book})
}

// PATCH /books/:id
// Update a book
func UpdateBook(c *gin.Context) {
	span := trace.SpanFromContext(c.Request.Context())
	span.SetAttributes(attribute.String("controller", "books"))
	span.AddEvent("Updating book")

	// Get model if exist
	var book models.Book
	if err := models.DB.Where("id = ?", c.Param("id")).First(&book).Error; err != nil {
		span.AddEvent("Book not found", trace.WithAttributes(
			attribute.String("book_id", c.Param("id")),
		))
		c.JSON(http.StatusBadRequest, gin.H{"error": "Record not found!"})
		return
	}

	// Validate input
	var input UpdateBookInput
	if err := c.ShouldBindJSON(&input); err != nil {
		span.AddEvent("Book update failed", trace.WithAttributes(
			attribute.String("error", err.Error()),
		))
		c.JSON(http.StatusBadRequest, gin.H{"error": err.Error()})
		return
	}

	models.DB.Model(&book).Updates(input)

	span.AddEvent("Book updated", trace.WithAttributes(
		attribute.Int("book_id", int(book.ID)),
	))

	c.JSON(http.StatusOK, gin.H{"data": book})
}

// DELETE /books/:id
// Delete a book
func DeleteBook(c *gin.Context) {
	span := trace.SpanFromContext(c.Request.Context())
	span.SetAttributes(attribute.String("controller", "books"))
	span.AddEvent("Deleting book")

	// Get model if exist
	var book models.Book
	if err := models.DB.Where("id = ?", c.Param("id")).First(&book).Error; err != nil {
		span.AddEvent("Book not found", trace.WithAttributes(  // Added error event
			attribute.String("book_id", c.Param("id")),
		))
		c.JSON(http.StatusBadRequest, gin.H{"error": "Record not found!"})
		return
	}

	models.DB.Delete(&book)

	span.AddEvent("Book deleted", trace.WithAttributes(  // Added success event
		attribute.Int("book_id", int(book.ID)),
	))

	c.JSON(http.StatusOK, gin.H{"data": true})
}
Once you've updated your application, restart it and generate new telemetry data. Then, navigate to your SigNoz cloud account and select one of the traces. You should be able to see the custom attributes and events that you've added. These will provide more insights into the activities taking place within your application, improving the observability and debugging process.
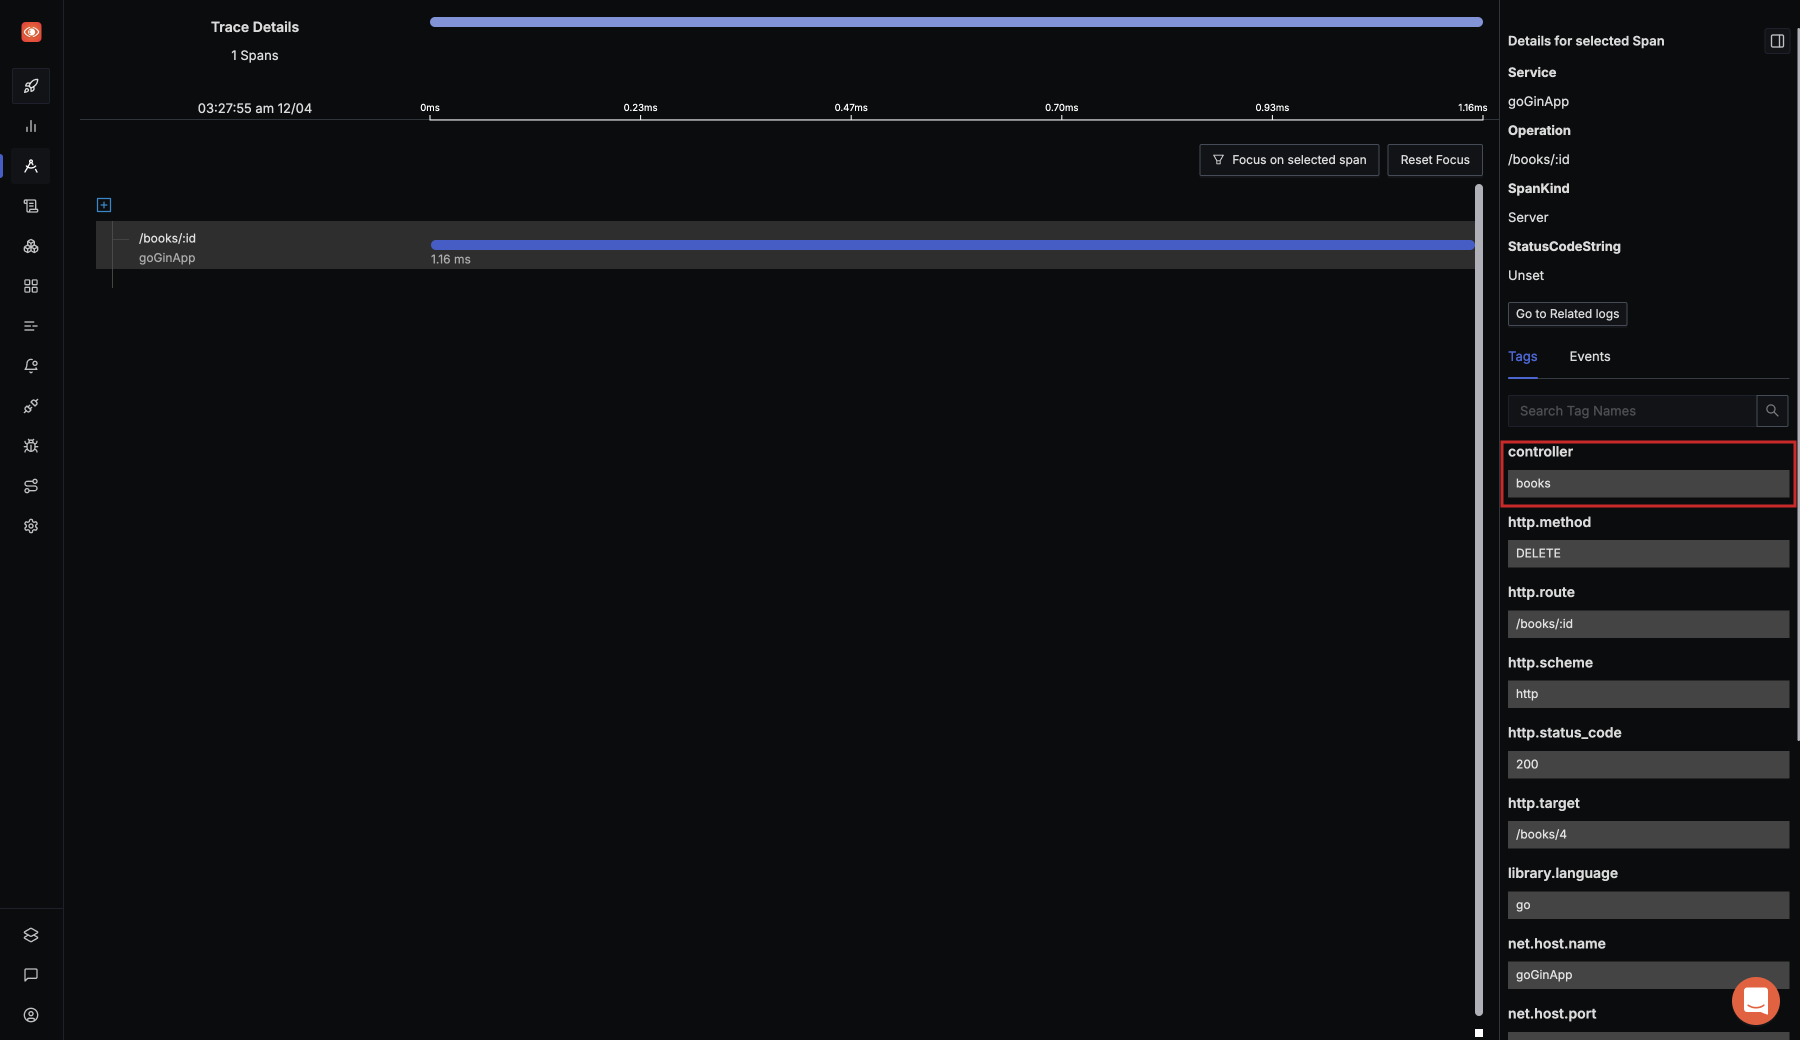
Tags section on SigNoz trace detail page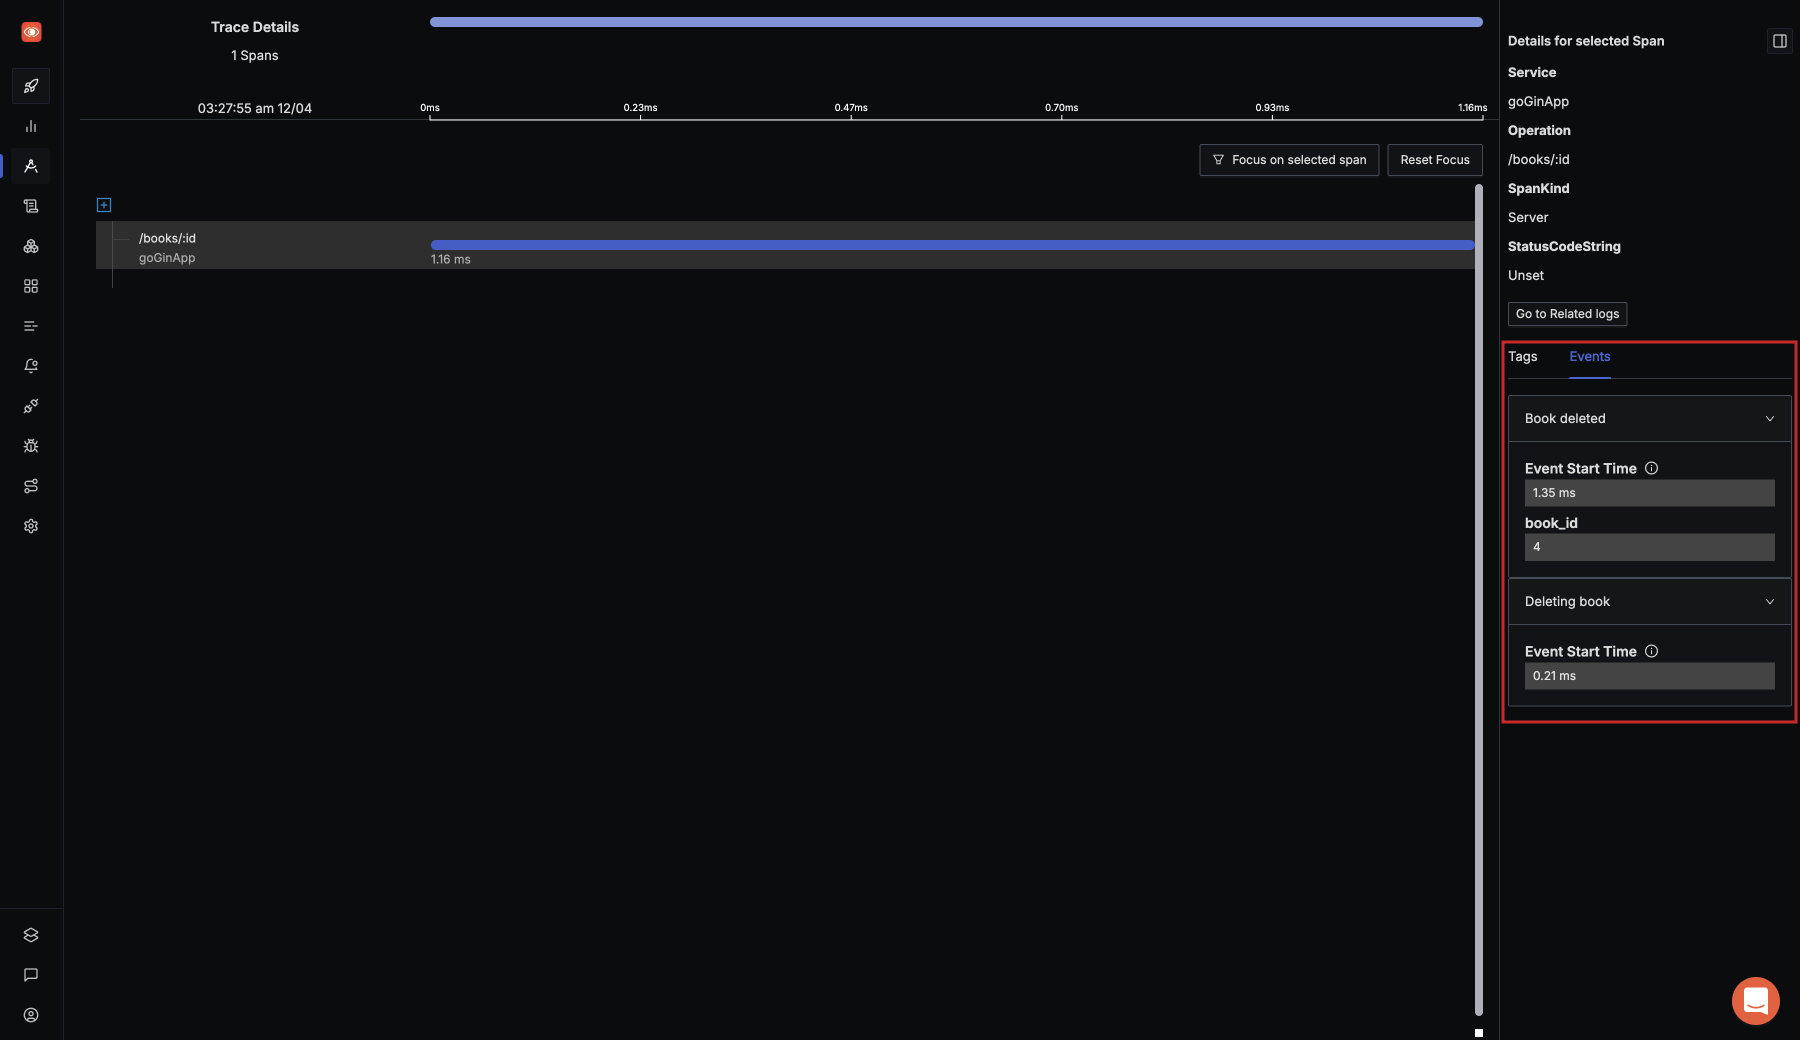
Events section on SigNoz trace detail pageConclusion
Using OpenTelemetry libraries, you can instrument your Go applications for setting up observability. You can then use an open-source APM tool like SigNoz to ensure the smooth performance of your Go applications.
OpenTelemetry is the future for setting up observability for cloud-native apps. It is backed by a huge community and covers a wide variety of technology and frameworks. Using OpenTelemetry, engineering teams can instrument polyglot and distributed applications with peace of mind.
SigNoz is an open-source observability tool that comes with a SaaS-like experience. You can try out SigNoz by visiting its GitHub repo 👇

If you are someone who understands more from video, then you can watch the our video tutorial on how to implement OpenTelemetry Golang libraries and monitor the application with SigNoz.
If you want to read more about SigNoz 👇
Monitor your Spring Boot application with OpenTelemetry and SigNoz
Further Reading
SigNoz - an open-source alternative to DataDog

