This article is part of the OpenTelemetry Python series:
- Previous Article: Manually configuring agent for instrumenting Python applications
- You are here: Create Manual Spans in Python application using OpenTelemetry
- Next Article: Create custom metrics in Python Application using OpenTelemetry
Check out the complete series at: Overview - Implementing OpenTelemetry in Python applications
In the previous tutorials, we set up out-of-the-box tracing, metrics, and logs in our Flask application.
In this tutorial, we will show you how to manually create spans. Spans are fundamental building blocks of distributed tracing. A single trace in distributed tracing consists of a series of tagged time intervals known as spans. Spans represent a logical unit of work in completing a user request or transaction.

Why is manual instrumentation useful?
Manual instrumentation is useful because:
- It allows you to create spans at specific points in your code where auto-instrumentation might not provide enough detail.
- With manual instrumentation, you can attach metadata and attributes to spans, providing more context to trace data. This information can include user IDs, transaction types, or other application-specific data, which is invaluable for debugging and understanding user behavior.
- Auto-instrumentation typically covers common frameworks, libraries, and HTTP operations but may lack precision in tracing custom logic or complex interactions. Manual instrumentation gives you full control over where to create spans, allowing you to trace complex workflows and identify bottlenecks with greater accuracy.
Code Repo
Here’s the code repo for this tutorial: GitHub repo link
Implementing manual instrumentation in Python application
The manual instrumentation involves using the OpenTelemetry SDK to create spans and attach metadata to them. The following code snippets show how to instrument code manually in a Python application.
Create a Span
from opentelemetry import trace

tracer = trace.get_tracer(__name__)

def my_function():
    with tracer.start_as_current_span("my_function") as span:
        span.set_attribute("custom_attribute", "custom_value")
        span.set_status(trace.Status.OK)
In the above code snippet, we first import the trace module from the opentelemetry package. We then create a tracer instance using trace.get_tracer(__name__). The __name__ parameter is used to identify the tracer instance. You can create as number tracer instances. You might want to have one tracer instance for a class, module, or a package.
Next, we define a function my_function() that creates a span using the tracer.start_as_current_span() method. The start_as_current_span() method creates a new span and sets it as the current span in the context. The current span can be obtained by calling trace.get_current_span().
Inside the with block, we set attributes and status on the span using the set_attribute(), set_status(), respectively. These methods allow you to attach metadata to the span, and set its status.
Create a Span (without setting it as the current span)
from opentelemetry import trace

tracer = trace.get_tracer(__name__)

def my_function():
    span = tracer.start_span("my_function")
    span.set_attribute("custom_attribute", "custom_value")
    span.set_status(trace.Status.OK)
    span.end()
The start_span creates a span with the given name. It accepts an optional timestamp, attributes, links, kind, and parent context to use. The end must be called if a span is created without a context manager.
Decorating a function
from opentelemetry import trace

tracer = trace.get_tracer(__name__)

@tracer.start_as_current_span("my_function")
def my_function():
    ...
Now, any time the function my_function is called, a new span is created. This span can be obtained in the function using trace.get_current_span(). The my_func_span will be active throughout the function's execution and will be ended after the function is completed.
from opentelemetry import trace

tracer = trace.get_tracer(__name__)

@tracer.start_as_current_span("my_function")
def my_function():
    # Your code goes here
    my_func_span = trace.get_current_span()
    my_func_span.set_attribute("custom_attribute", "custom_value")
    # more code goes here
    my_func_span.set_status(trace.Status.OK)
    # even more code goes here
Create nested spans
from opentelemetry import trace

tracer = trace.get_tracer(__name__)

def my_function():
    with tracer.start_as_current_span("my_function") as span:
        span.set_attribute("custom_attribute", "custom_value")
        span.set_status(trace.Status.OK)
        # some business logic goes here
        with tracer.start_as_current_span("inner_span") as inner_span:
            inner_span.set_attribute("answer_to_life_the_universe_and_everything", 42)
            # some business logic goes here
            with tracer.start_as_current_span("inner_inner_span") as inner_inner_span:
                # some business logic goes here
                inner_inner_span.set_attribute("cities", ["Mumbai", "Hyderabad"])
        # some business logic goes here
        with tracer.start_as_current_span("inner_span_2") as inner_span_2:
            inner_span_2.set_attribute("is_admin", True)
In the above code snippet, we create a span my_function and two nested spans inner_span and inner_span_2. The nested spans are created using the start_as_current_span() method within the context of the parent span. This creates a hierarchy of spans, where the parent span is the my_function span, and the child spans are inner_span and inner_span_2. The following ASCII chart shows traced information for sample execution.
my_function (start: 2024-05-19 10:00:00, end: 2024-05-19 10:00:50)
└── my_function (start: 2024-05-19 10:00:00, end: 2024-05-19 10:00:50)
    ├── custom_attribute: custom_value
    ├── status: OK
    ├── inner_span (start: 2024-05-19 10:00:10, end: 2024-05-19 10:00:30)
    │   ├── answer_to_life_the_universe_and_everything: 42
    │   └── inner_inner_span (start: 2024-05-19 10:00:15, end: 2024-05-19 10:00:20)
    │       └── cities: ["Mumbai", "Hyderabad"]
    └── inner_span_2 (start: 2024-05-19 10:00:35, end: 2024-05-19 10:00:45)
        └── is_admin: True
Add metadata and attributes to spans
from opentelemetry import trace

tracer = trace.get_tracer(__name__)

def my_function():
    with tracer.start_as_current_span("my_function") as span:
        span.set_attribute("custom_attribute", "custom_value")
        span.set_attribute("user_id", 1234)
        span.set_attribute("transaction_type", "payment")
Attributes are key-value pairs that provide additional context to spans. In the above code snippet, we set three attributes on the span: custom_attribute, user_id, and transaction_type. These attributes can be used to filter and search for spans in the SigNoz UI. There is a convenient method, set_attributes, that accepts a dictionary of key-value pairs.
Set status on spans
from opentelemetry import trace

tracer = trace.get_tracer(__name__)

def my_function():
    with tracer.start_as_current_span("my_function") as span:
        span.set_status(trace.Status.ERROR)
Update the span name
from opentelemetry import trace

tracer = trace.get_tracer(__name__)

def my_function():
    with tracer.start_as_current_span("my_function") as span:
        span.update_name("my_function_updated")
Record events
from opentelemetry import trace

tracer = trace.get_tracer(__name__)

def my_function():
    with tracer.start_as_current_span("my_function") as span:
        span.add_event("event_name", {"key": "value"})
Record exception
from opentelemetry import trace

tracer = trace.get_tracer(__name__)

def my_function():
    with tracer.start_as_current_span("my_function") as span:
        try:
            # some code that might raise an exception
            raise Exception("Something went wrong")
        except Exception as e:
            span.record_exception(e)
Step 6: See your Spans in SigNoz
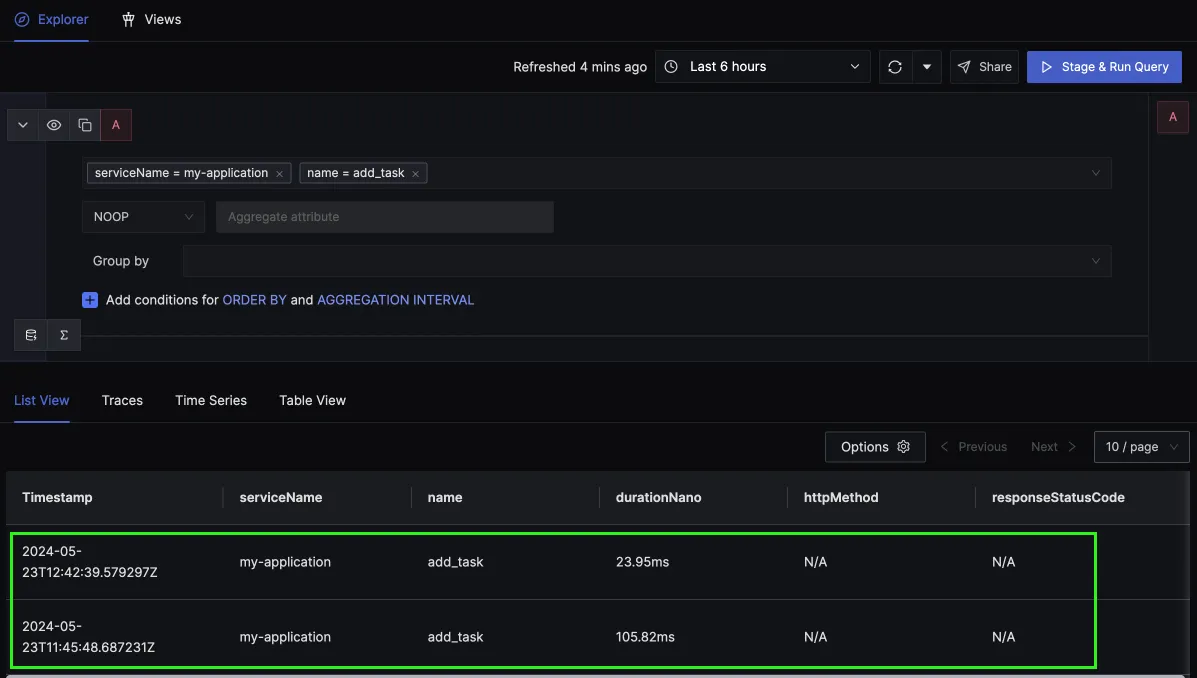
The sample code for lesson 4 has a manual span named add_task which gets created whenever you create a new task in the to-do application. To see this span go to the Traces tab and apply filters for your application.
OTEL_RESOURCE_ATTRIBUTES=service.name=my-application \
OTEL_EXPORTER_OTLP_ENDPOINT="https://ingest.{region}.signoz.cloud:443" \
OTEL_EXPORTER_OTLP_HEADERS="signoz-ingestion-key=<SIGNOZ_INGESTION_KEY>" \
OTEL_EXPORTER_OTLP_PROTOCOL=grpc \
OTEL_PYTHON_LOGGING_AUTO_INSTRUMENTATION_ENABLED=true \
python lesson-4/app.py
Once you run the application and add a task, you will be able to see it in SigNoz.

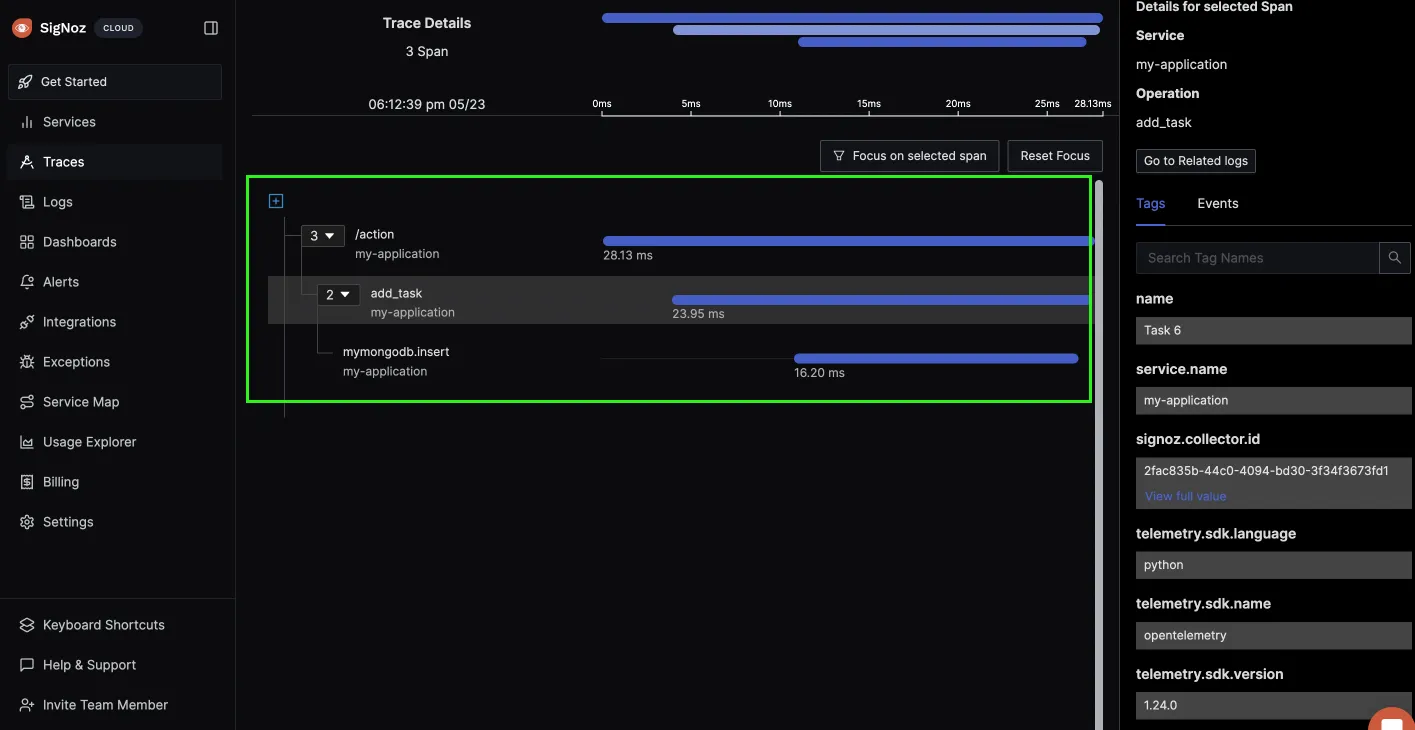
You can see your span in the trace detail view, too, which shows how the request flowed and how long it took for the add_task operation.

Next Steps
In this tutorial, we configured the Python application to create spans manually. Manual instrumentation gives you more granular control when setting up tracing in your Python application.
In the next tutorial, we will be using OpenTelemetry to generate custom metrics.
Read Next Article of OpenTelemetry Python series on Create custom metrics in Python Application using OpenTelemetry

