This article is part of the OpenTelemetry Python series:
- Previous Article: Auto-instrumentation of Python applications with OpenTelemetry
- You are here: Manually configuring agent for instrumenting Python applications
- Next Article: Create Manual Spans in Python application using OpenTelemetry
Check out the complete series at: Overview - Implementing OpenTelemetry in Python applications
In the previous tutorial, we set up auto-instrumentation for our Flask application with OpenTelemetry without any code changes.
In this tutorial, we will manually configure the agent to have more granular control over instrumentation.

When do you need to configure the agent manually?
The opentelemetry-instrument tool is a convenient way to instrument your application without any code changes. However, there are cases where you might need to configure the agent manually:
- Instrumentation Customization: You need to customize the instrumentation such as adding request/response hooks, excluding specific endpoints etc.
- Granular Control: You need more granular control over the instrumentation. For example, you want to instrument only specific libraries.
- Capability Limitation: The
opentelemetry-instrumenttool does not support the specific capability you need because there is no way to configure it with environment variables or command-line arguments. Examples include configuring the buckets for metrics, setting up custom exporters, etc.
There may be other reasons for configuring the agent manually. In this tutorial, we will show you how to configure the agent and export telemetry data manually.
Code Repo
Here’s the code repo for this tutorial: GitHub repo link
Implementing manual instrumentation in Python application
The following code snippet shows how to configure the agent manually in a Python application. It sets up tracing and metrics SDKs, as well as instruments Flask, PyMongo, and Requests libraries.
def initialize_opentelemetry():

    # tracing setup
    from opentelemetry.trace import set_tracer_provider, get_tracer_provider
    from opentelemetry.sdk.trace import TracerProvider
    from opentelemetry.sdk.trace.export import BatchSpanProcessor
    from opentelemetry.exporter.otlp.proto.grpc.trace_exporter import OTLPSpanExporter

    set_tracer_provider(TracerProvider())
    span_processor = BatchSpanProcessor(OTLPSpanExporter())
    get_tracer_provider().add_span_processor(span_processor)

    # metrics setup
    from opentelemetry.metrics import set_meter_provider, get_meter_provider
    from opentelemetry.sdk.metrics import MeterProvider
    from opentelemetry.sdk.metrics.export import PeriodicExportingMetricReader
    from opentelemetry.exporter.otlp.proto.grpc.metric_exporter import OTLPMetricExporter

    reader = PeriodicExportingMetricReader(
        OTLPMetricExporter(),
    )
    set_meter_provider(MeterProvider(
        metric_readers=[reader],
    ))

    # instrumentations
    from opentelemetry.instrumentation.flask import FlaskInstrumentor
    from opentelemetry.instrumentation.pymongo import PymongoInstrumentor
    from opentelemetry.instrumentation.requests import RequestsInstrumentor

    FlaskInstrumentor().instrument()
    PymongoInstrumentor().instrument()
    RequestsInstrumentor().instrument()
Then, you need to call this function as the first thing in your application code.
initialize_opentelemetry()
In our sample application, we create a file otel_setup.py and add the above code to it. We then import the initialize_opentelemetry function in our app.py file and call it at the beginning of the file.
Now, let's see how to run the application.
OTEL_RESOURCE_ATTRIBUTES=service.name=my-application \
OTEL_EXPORTER_OTLP_ENDPOINT="https://ingest.{region}.signoz.cloud:443" \
OTEL_EXPORTER_OTLP_HEADERS="signoz-ingestion-key=<SIGNOZ_INGESTION_KEY>" \
OTEL_EXPORTER_OTLP_PROTOCOL=grpc \
OTEL_PYTHON_LOGGING_AUTO_INSTRUMENTATION_ENABLED=true \
python lesson-3-2/app.py
Step 4: Test the Application and Generate Trace Data
Interact with the Flask application to generate tracing data and send it to SigNoz Cloud.
Step 5: See Trace Data in SigNoz
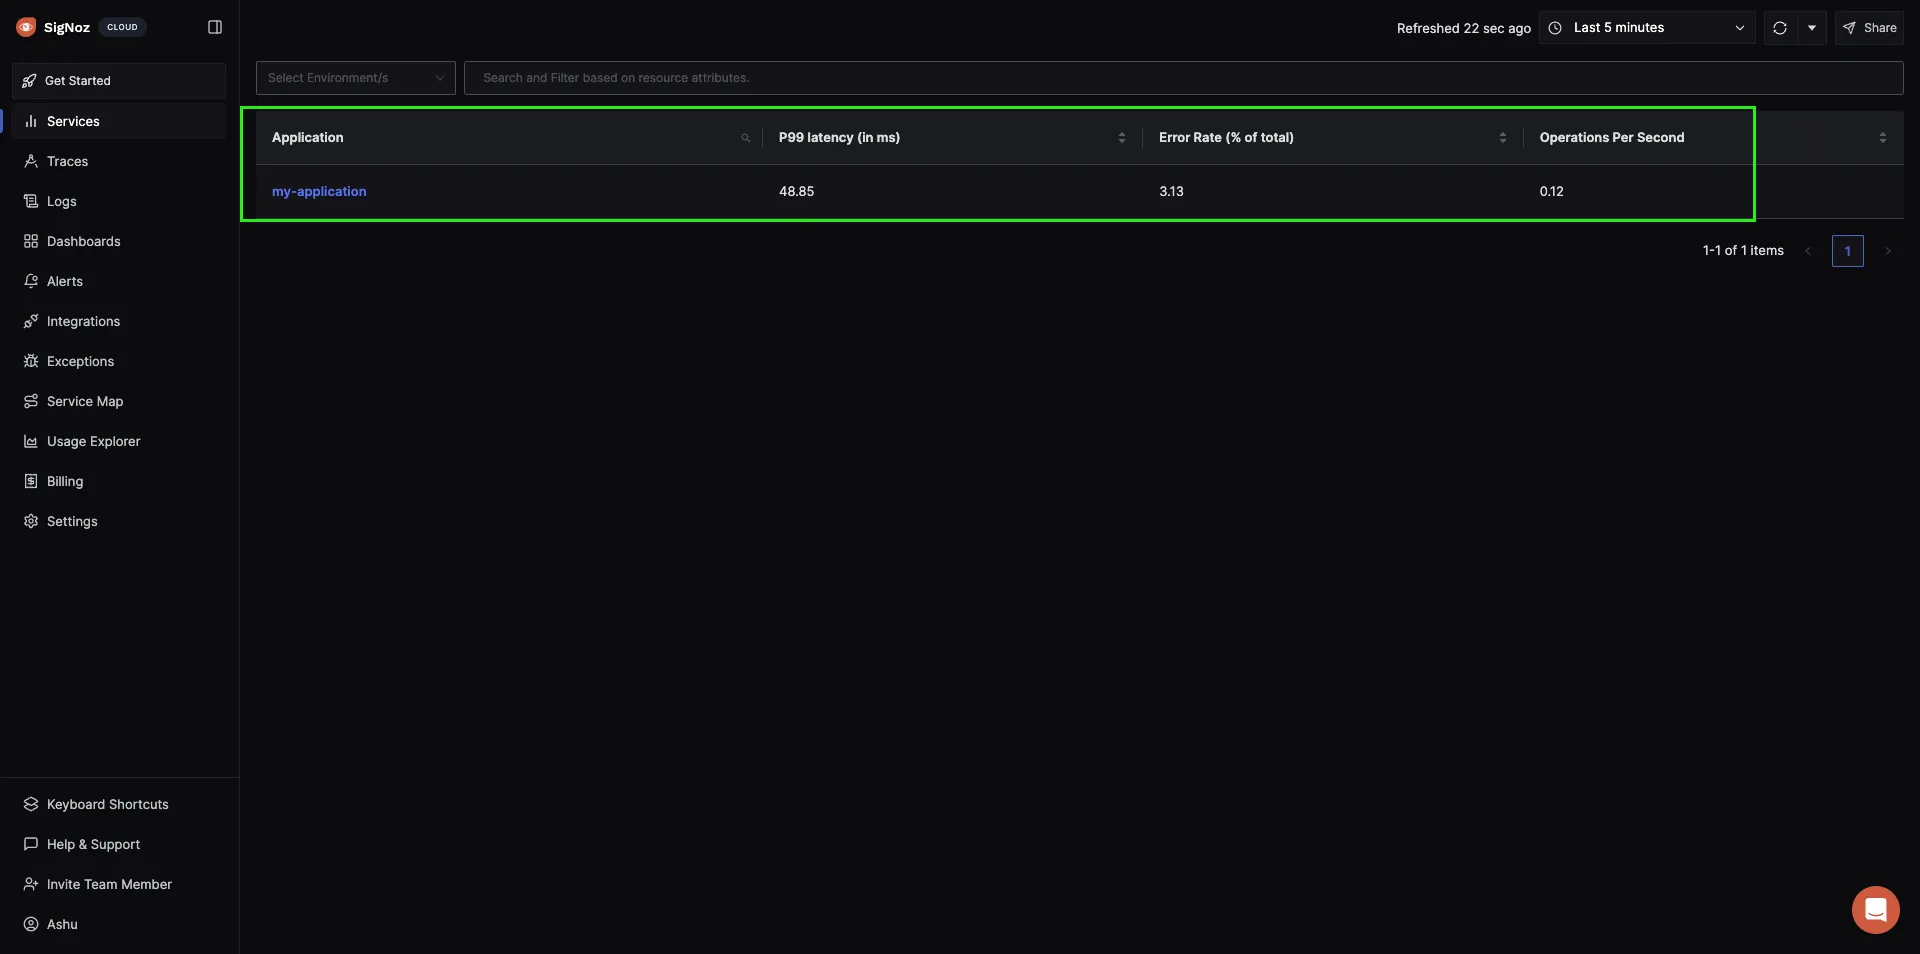
Once you've created some dummy telemetry by interacting with your application, you will be able to find your application under the Services tab of SigNoz.

Next Steps
In this tutorial, we have seen the steps to configure the agent with some code changes.
In the next lesson, we will learn how to create spans manually.
Read Next Article of OpenTelemetry Python series on Create Manual Spans in Python application using OpenTelemetry

