This article is part of the OpenTelemetry Python series:
- Previous Article: Create Manual Spans in Python application using OpenTelemetry
- You are here: Create custom metrics in Python Application using OpenTelemetry
- Next Article: Configure OpenTelemetry logging SDK in a Python application
Check out the complete series at: Overview - Implementing OpenTelemetry in Python applications
In the previous tutorial, we learned how to create spans in a Python application manually.
In this tutorial, we will look at how to create custom metrics using OpenTelemetry. Custom metrics are useful to gain insights that are specific to your application's performance and behavior.

Types of metrics in OpenTelemetry
There are four types of metrics that can be produced using OpenTelemetry:
- Counter: A counter is a cumulative metric that represents a single monotonically increasing counter whose value can only increase or be reset to zero on restart. For example, you can use a counter to represent the number of requests served, tasks completed, or errors.
- UpDownCounter: An UpDown counter is a metric that represents a single numerical value that can arbitrarily go up and down. UpDownCounter is typically used for measured values like the number of active requests or the number of items in a queue.
- Histogram: A histogram samples observations (usually things like request durations or response sizes) and counts them in configurable buckets. It is intended for statistics such as histograms, summaries, and percentile
- Gauge: A gauge is a metric that represents a single numerical value that has non-additive properties. For example, the background noise level - it makes no sense to record the background noise level value from multiple rooms and sum them up.
Code Repo
Here’s the code repo for this tutorial: GitHub repo link
Implementing custom metrics in Python application
The manual instrumentation involves using the OpenTelemetry SDK to create metrics. The following code snippets show how to create custom metrics in a Python application.
Create a Counter
from opentelemetry import metrics

meter = metrics.get_meter(__name__)

counter = meter.create_counter(
    name="tasks_completed",
    unit="1",
    description="The number of tasks completed",
)

counter.add(10)
In the above code snippet, we first import the metrics module from the opentelemetry package. We then create a meter instance using metrics.get_meter(__name__). The __name__ parameter is used to identify the meter instance. You can create as number meter instances. You might want to have one meter instance for a class, module, or a package.
The meter instance is used to create instruments. In this case, we create a counter instrument using the meter.create_counter() method. The create_counter() method creates a counter with the given name, unit, and description. The unit parameter is used to specify the unit of the counter. The description parameter is used to describe the counter. The add() method is used to increment the counter value. It accepts a numeric value to increment the counter by and, optionally, a set of key-value pairs to set attributes on the counter. The value must always be a non-negative number.
Create an UpDownCounter
from opentelemetry import metrics

meter = metrics.get_meter(__name__)

up_down_counter = meter.create_up_down_counter(
    name="active_requests",
    unit="1",
    description="The number of active requests",
)

up_down_counter.add(1)
# do some work
up_down_counter.add(-1)
The create_up_down_counter() method creates an UpDownCounter instrument with the given name, unit, and description. The add() method is used to increment or decrement the counter value. It accepts a numeric value to increment or decrement the counter by and optionally a set of key-value pairs to set attributes on the counter. The value can be positive or negative.
Create a Histogram
from opentelemetry import metrics

meter = metrics.get_meter(__name__)

histogram = meter.create_histogram(
    name="request_duration",
    unit="s",
    description="The duration of requests",
)

histogram.record(0.5)
histogram.record(1.0)
histogram.record(1.1)
histogram.record(5.0)
The create_histogram() method creates a histogram instrument with the given name, unit, and description. The record() method is used to record observations in the histogram. It accepts a numeric value to record and, optionally, a set of key-value pairs to set attributes on the histogram. The value must always be a non-negative number.
Create a Gauge
from opentelemetry import metrics

meter = metrics.get_meter(__name__)

gauge = meter.create_gauge(
    name="background_noise_level",
    unit="dB",
    description="The background noise level",
)

gauge.set(60)
The create_gauge() method creates a gauge instrument with the given name, unit, and description. The set() method is used to set the value of the gauge. It accepts a numeric value to set the gauge to and, optionally, a set of key-value pairs to set attributes on the gauge.
Step 6: See your metrics in SigNoz
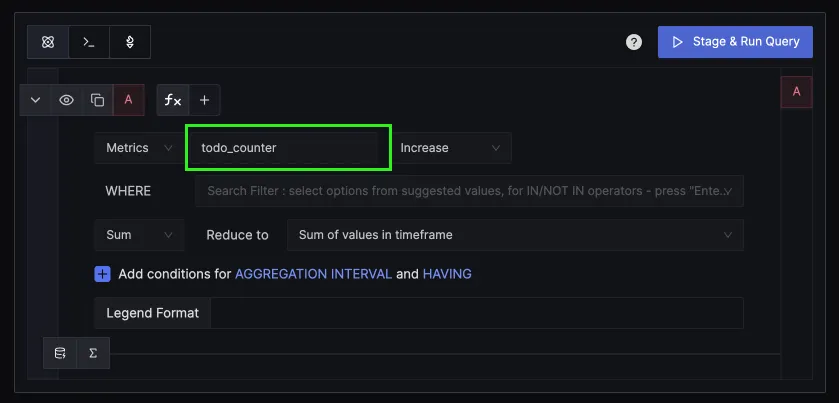
The sample code for lesson 5 has a custom metric named todo_counter, which keeps track of the number of To-Dos added by the user. You can create customized dashboards to monitor your custom metrics.
In order to see your custom metric in SigNoz, run the updated code with a custom metric in Lesson 5.
OTEL_RESOURCE_ATTRIBUTES=service.name=my-application \
OTEL_EXPORTER_OTLP_ENDPOINT="https://ingest.{region}.signoz.cloud:443" \
OTEL_EXPORTER_OTLP_HEADERS="signoz-ingestion-key=<SIGNOZ_INGESTION_KEY>" \
OTEL_EXPORTER_OTLP_PROTOCOL=grpc \
OTEL_PYTHON_LOGGING_AUTO_INSTRUMENTATION_ENABLED=true \
python lesson-5/app.py
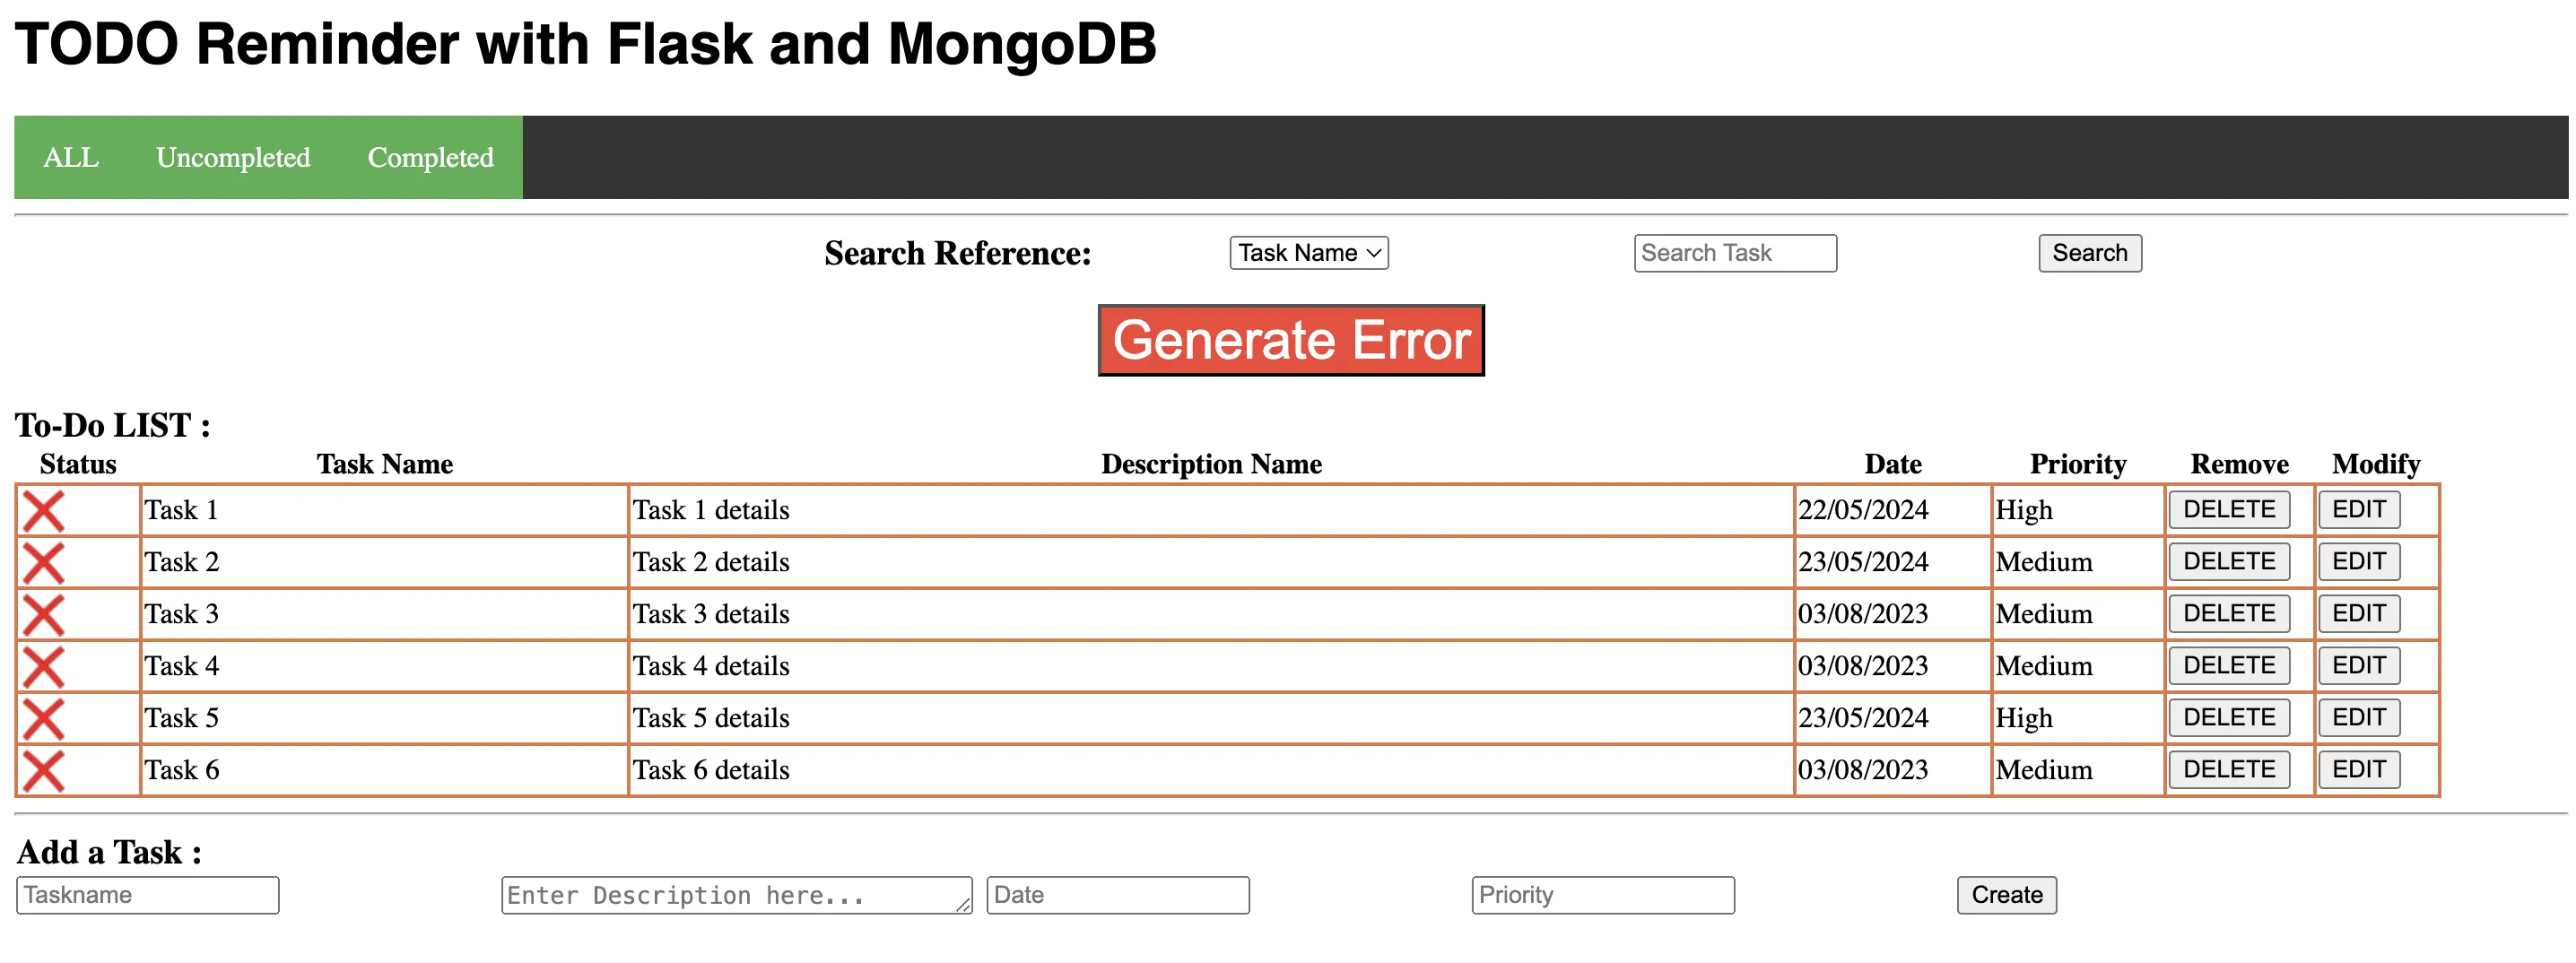
Let's suppose you add 6 tasks to your to-do application.

You can go to Dashboards in SigNoz and create a new panel to monitor the number of tasks in your to-do application using the todo_counter metric.

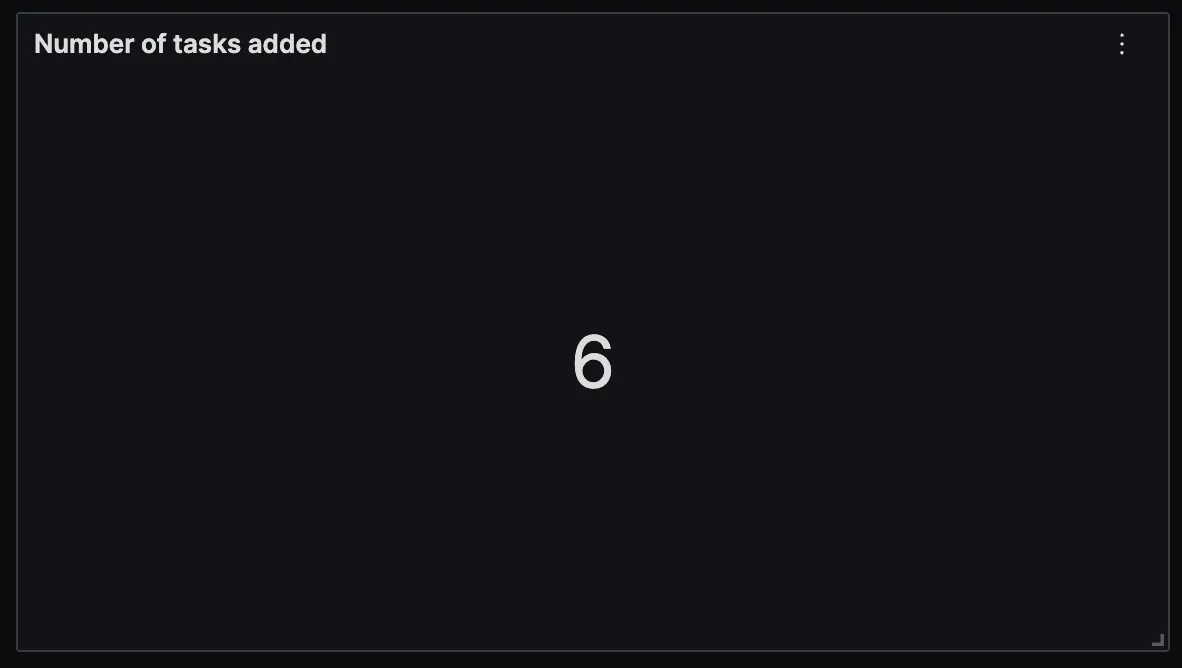
You can create a value panel type and monitor the number of tasks being created.

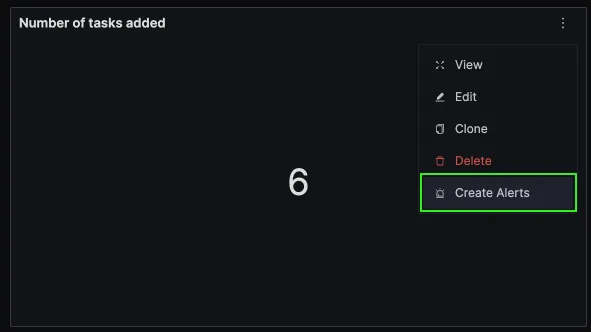
You can also set alerts on metrics based on your use case directly from these panels.

Next Steps
In this tutorial, we configured the Python application to create custom metrics.
In the next tutorial, we will learn how to configure OpenTelemetry logging SDK in Python.
Read Next Article of OpenTelemetry Python series on Configure OpenTelemetry logging SDK in a Python application

